Abstract
Biocompatible polymers, such as polydimethylsiloxane (PDMS), are the materials of choice for creating organ-on-a-chip microfluidic platforms. Desirable qualities include ease of fabrication, optical clarity, and hydrophobicity, the latter of which facilitates oxygen transport to encased cells. An emerging and important application of organ-on-a-chip technology is drug discovery; however, a potential issue for polymer-based microfluidic devices has been highlighted by recent studies with PDMS, which have demonstrated absorption (and thus loss) of hydrophobic drugs into PDMS under certain experimental conditions. Absorption of drug in the polymer can also lead to undesirable transfer of drug between adjacent microfluidic lines. Given the benefits of polymers, it is essential to develop a comprehensive understanding of drug absorption. In this study, we considered convection, dissolution, and diffusion of a drug within a polymer-based microfluidic device to characterize the dynamics of drug loss in a quantitative manner. We solved Fick’s 2nd Law of Diffusion (unsteady diffusion-convection) by finite element analysis in COMSOL®, and experimentally validated the numerical model for loss of three hydrophobic molecules (Rhodamine B, Cyanine NHS ester, and Paclitaxel) in PDMS. Drug loss, as well as the unintended mixing of drugs by adjacent microfluidic channels, depends strongly on platform design parameters, experimental conditions, and the physico-chemical properties of the drug, and can be captured in a simple quantitate relationship that employs four scalable dimensionless numbers. This simple quantitative framework can be used in the design of a wide range of polymer-based microfluidic devices to minimize the impact of drug absorption.
TOC image
We characterized the dynamics of drug-loss in microfluidics, and provide a quantitative framework for the design of organ-on-a-chip for drug discovery.
Introduction
Polymers such as polydimethylsiloxane (PDMS) have been extensively used in the design and fabrication of microfluidic platforms with a wide variety of applications. PDMS is of particular interest for biological platforms because it has many desirable properties to sustain growth of biological cells and tissues. PDMS is non-toxic, has high oxygen permeability, is optically transparent, and is extremely moldable for high fidelity manufacturing of micron-size features. Thus, PDMS has become a material of choice for researchers in the life sciences, and has been employed in a large number of high impact studies1–5. More recently, microfluidic platforms have been designed to mimic pathophysiological conditions of the in vivo microenvironment. These platforms consist of 3D multi-cellular complex tissues (volume < 1 mm3) and have been referred to as “organ-on-a-chip” or “microphysiological” platforms. These in vitro tissue mimics have been shown to simulate a wide range of in vivo human functions of the heart, lung, gut, liver, vasculature, and cancer at very high spatiotemporal resolution1, 4–8.
The promise of organ-on-a-chip technology has stimulated significant interest in the scientific community and investment by both public and private sources in drug discovery. The goal for these efforts is to design drug-screening platforms that reliably predict drug toxicity and efficacy in humans in a quantitative and reproducible manner. Thus, this technology could significantly enhance the efficiency, and thus reduce cost, of the current drug discovery paradigm that employs 2D monolayer culture and pre-clinical animals.
A major concern, particularly for drug discovery, for PDMS and other polymer-based organ-on-a-chip platforms is drug solubility in the polymer. This feature could result in drug loss within the polymer and significantly reduce the actual drug delivered to the microtissue, or lead to cross-contamination of adjacent microchannels. This issue is highlighted in previous studies using Rhodamine B and Nile Red, surrogate dyes for hydrophobic drugs, in PDMS9, 10. These studies demonstrated the absorption of dyes into PDMS under specific experimental conditions. Another study correlated the partition coefficient of a drug with its absorption into PDMS11. Notably, the partition coefficient is an equilibrium property, and therefore does not capture the dynamics of mass transport. For example, consider an extreme example of a drug that is highly soluble in the polymeric material, but cannot diffuse. In this case the drug loss would be negligible as dissolution only occurs at the solution:poymer interface. Nonetheless, these studies have raised the level of concern in the scientific community regarding the use of PDMS and other polymer-based platforms. Given the sheer volume of data generated thus far using PDMS, and the significant advantages described earlier, we thought it prudent to create a more comprehensive and quantitative description of drug absorption and transport into polymer-based microfluidic devices in an effort to create a simple approach that could describe experimental conditions to seek, as well as to avoid, in the platform and experimental protocol design stages.
The process of mass transport across a polymer interface, and thus drug loss, in a microfluidic device depends on multiple parameters including the concentration of the drug, fluid velocity, channel dimensions, the lipid or water solubility (i.e., the partition coefficient), the relative time scale of the experiment, and the diffusion coefficient of drug in the polymer. In this study, we considered all of these aspects to quantitate drug loss from a solution passing through a polymer-based microfluidic channel. Using mathematical simulations and experiments, we demonstrate that drug loss can be characterized in a simple quantitate relationship that employs only three scalable dimensionless numbers which include all of the individual parameters such as flow rate. Furthermore, a fourth dimensionless number can be used to minimize mixing of drugs between adjacent channels. This quantitative framework can be used to design experimental conditions in which drug loss and unintended mixing is minimal even for what has been previously described as hydrophobic molecules in PDMS.
Methods
Three-dimensional mathematical model
Mass transport in a microfluidic channel follows several steps involving dissolution, convection and diffusion (Fig. 1). The geometries simulated in the model were 3D channels of 10 mm (Fig. 2) and 100 mm lengths (Fig. 5C). To develop the mathematical model of the drug transport, the following assumptions were made: 1) polymer-drug solution equilibrium is instantaneous at the interface; 2) the equilibrium distribution of the drug between the two phases is linear, and described using the partition coefficient, K, which represents the ratio of the solubilities of solute in the polymer phase (SP) and solution phase (Ssl); 3) K is constant at the low concentrations employed here and in most experimental conditions; 4) The diffusion of drug molecules through polymer is isotropic and characterized by Fick’s 1st Law of Diffusion. These assumptions are common and explained in detail in numerous mass transport texts12, 13. It has been reported that K for PDMS:water is approximately equal to the octanol: water partition coefficient (Ko:w or P)14. As logP values of many biological molecules and drugs are available, this approach can be easily adapted for many drug molecules.
Figure 1. Transport of hydrophobic drugs in polymer microchannels.
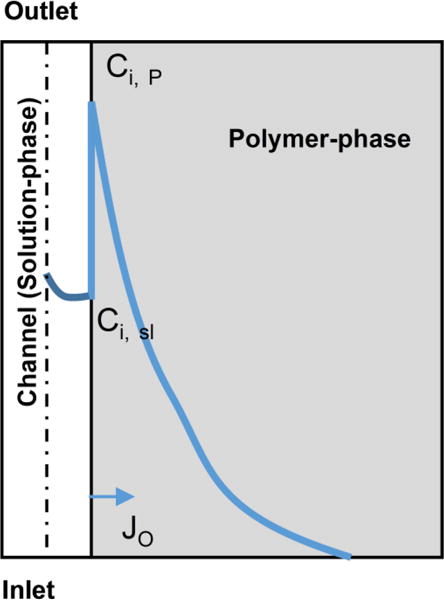
The loss of drug from the solution in the microfluidic channel depends upon all of the following transport processes: 1) convective flux of drug through the microfluidic channel; 2) diffusion of drug in the bulk solution phase, which depends on the diffusion coefficient in solution; 3) the equilibrium concentrations of drug at the interface of polymer-drug solution, which depends on the partition coefficient (K);. 4) Diffusion of drug through the polymer, which depends on the diffusion coefficient in the polymer. Solid blue line represents the concentration profile of a candidate drug from left to right. The loss is proportional to the flux (JO) at the wall indicated by the arrow.
Figure 2. The device design and 3D model simulations used in the study.
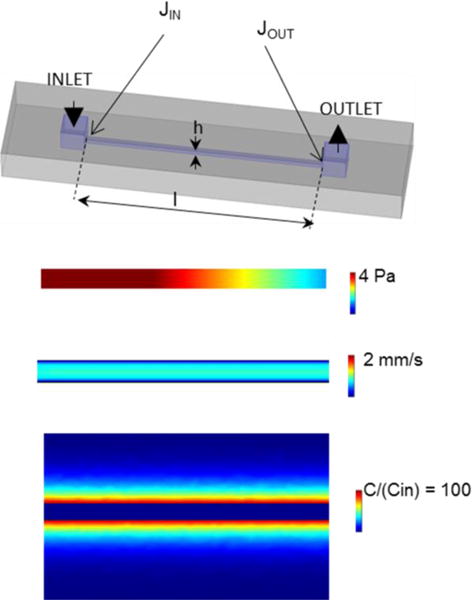
A 3D view of microfluidic channel of 10 × 0.2 × 0.2 mm dimensions was connected to inlet and outlet ports of 1 × 1 × 0.1 mm. The inlet and outlet fluxes (JIN and JOUT) were measured at the entrance of the channel (indicated by the arrows) in model simulations unless otherwise specified. The pressure, velocity, and concentration profiles were generated at logK = 2, logPe = 5.1 and logFo = −3.5 (see text for additional details).
Figure 5. Validation of model data using rhodamine B dye in PDMS.
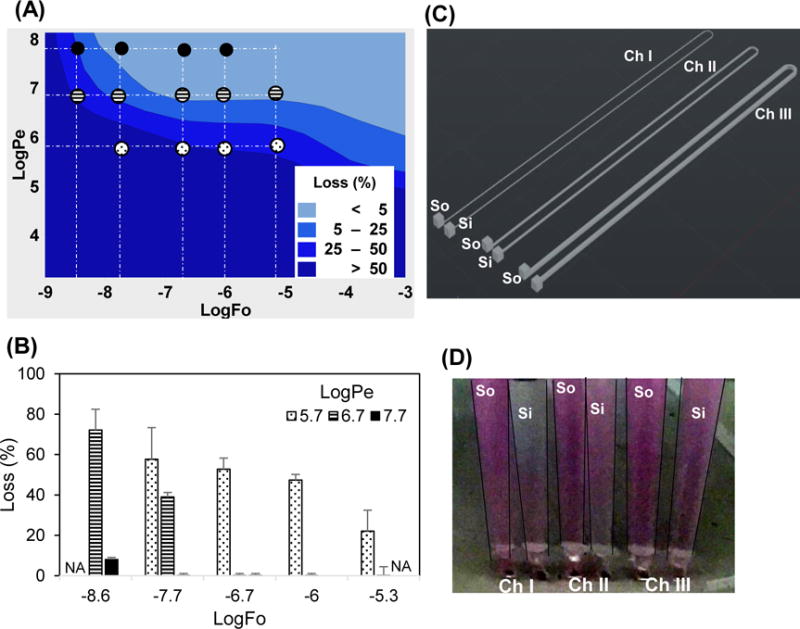
(A) The COMSOL model was simulated using properties of Rhodamine B. The small circles indicate logFo and logPe coordinates at which the experimental data in panel B is obtained. The pattern of the circles (e.g., filled) correspond to the patterns of the columns in B. (B) The loss due to absorption in PDMS was experimentally determined by spectrophotometric analysis. The experimental measurements not performed are indicated by NA. The error bars are mean ±SD for n≥6. (C) The device design to vary Pe 1, 2.3, and 4 times by changing cross sectional area 100 × 100, 200 × 100, 400 × 100 (w × h) μm and driving flow by simple hydrostatic head. The three channels have separate Source (So) and Sink (Si). (D) The color intensity increases in sinks from channel I to III indicating decreasing loss of dye in PDMS from channel I to III as Pe increases.
Convection in the microfluidic channel (Fig. 2) was modeled using the Navier-Stoke’s Equations (momentum balance for a Newtonian fluid). Mass transport in the polymer (and in the solution) was modeled using Fick’s 2nd Law of Diffusion (unsteady isotropic diffusion):
| (1) |
Where C is drug concentration and DP is the diffusion coefficient in the polymer. The assumption of equilibrium at the polymer-solution interface yields following boundary condition:
| (2) |
Where Ci,P and Ci,sl are the interfacial concentrations of drug on the polymer-side and solution-side of the wall, respectively. We solved the system of coupled partial differential equations (mass and momentum balance) using COMSOL® Multiphysics finite element analysis for the microfluidic channel geometries. For each value of the model parameters (Table 1), concentration and velocity profiles were obtained (Fig. 2).
Table 1.
Model Parameters
| Variable Description | Symbol | Range |
|---|---|---|
| time | t | 0 to 72 hr |
| diffusion coefficient in polymer | DP | 10−10 to 10−14 m2/s |
| diffusion coefficient in solution | Dsl | 10−10 m2/s |
| channel width | w | 100 to 400 μm |
| channel height | h | 100 μm |
| channel length | l | 10 mm to 100 mm |
| fluid velocity | U | 0.1 to 100 mm/s |
The drug loss is calculated from the total convective molar fluxes at the inlet (JIN) and outlet (JOUT) of the channel (mol·m−2.s−1), which were computed by surface integrating the molar flux at the inlet and outlet (Fig. 2):
| (3) |
The analysis of the model results was performed by surface plots of drug loss against logPe (log Peclet number) and logFo (log Fourier number) values, defined in the following section, using Minitab statistical analysis software.
One-dimensional simplified model
To formulate a simple and more tractable solution, we made a series of simplifying assumptions (Fig. 1). First, we can assume that the resistance to mass transfer in liquid is negligible and the convective transport is fast enough to maintain the concentration in the liquid constant. This approximation is actually a worst case scenario; in other words, it assumes the concentration at the interface is a maximum and thus diffusion into the polymer is always a maximum. Furthermore, if we assume that the mass transfer is symmetric in all directions and time is short enough or the x-dimension large enough to invoke a semi-infinite boundary condition (i.e., C ➔0 for short times or large x), Fick’s 2nd Law of Diffusion reduces to a single dimension (say x) which has a well-known analytical solution:
| (4) |
where efrc is the complimentary error function. The flux (mol·m−2.s−1), J0, of drug at the PDMS wall was used to calculate the drug loss from the solution (Fig. 1). J0 is found using Fick’s 1st Law of Diffusion, and thus differentiating Eq. 4 with respect to x,
| (5) |
Using Eqs. 2 and 5, the drug loss (%) from the solution can be expressed as:
| (6) |
where s and v are surface area (m2) and volume (m3) of channel, respectively, l is the length of the channel, and U is the average fluid velocity. Alternatively, Eq. 6 can be written as the product of three dimensionless numbers:
| (7) |
| (8) |
| (9) |
Where Q is the flow rate, Fo is the Fourier number (dimensionless time) and Pe is the Peclet number (ratio of mass transfer rate by convection to mass transfer rate by diffusion). Note that this methodology has reduced the problem characterized by eight individual parameters (e.g., channel height) to three dimensionless groups that fully describe the system.
Microfabrication
A master mold of SU8 on a silicon wafer was prepared using soft photolithography. The microdevice was created by casting polydimethylsiloxane (PDMS), prepared by mixing Sylgard® 184 silicone elastomer base and curing agent (Dow Corning, Midland, MI) in 10:1 ratio, on the SU-8 master molds. The molded-PDMS was peeled off of the master mold after heat treatment at 60 °C overnight, and then bonded to a flat PDMS sheet using air plasma. The device bonding was cured briefly at 120 °C. The device design consisted of simple straight rectangular microfluidic channels with a range of cross sections (100 μm × 100 μm, 200 μm × 100 μm, or 400 μm × 100 μm (width × height) and lengths (10 mm or 100 mm).
Experimental determination of dye absorption
The device was connected with a precision syringe pump (Harvard Apparatus, Holliston, Massachusetts) using ND-100-80 Tygon® tubing (Saint-Gobin, Malvern, PA), which served as input tubing to the device. The outlet of the device was connected with an output tubing of 0.76 mm internal diameter and 100 mm length. The syringe pump was operated in push mode. The input and output samples for the device were collected from the respective tubings in polypropelene microcentrifuge tubes (Thermo Fisher Scientific, Boston, MA). Initially the system was equilibrated with phosphate buffered saline. Subsequently, three different molecules with a range of physical properties were passed through the device individually at a concentration of 10 μg/ml: 1) rhodamine B (K~260 or logK = 2.4; MW, 479 Da; Sigma-Aldrich, St. Louis, MO); 2) cyanine3 NHS ester (logK = 5.0; MW, 727, Cy3 SE; Lumiprobe, Hallandale Beach, FL); 3) or paclitaxel (logK = 3.2; MW, 854, Hospira, Lake Forest, IL)9,15,16. The chemical and physical features of these molecules represent many commonly used drugs, and paclitaxel is a vital chemotherapy drug, used in the treatment of breast and other cancers17.
The outlet liquid was collected for analysis of concentration at pre-determined time points. The choice of time points, length and cross section of the device, was based on desired Fo and Pe. Since the flow of fluid was constant throughout the microfluidic line, the fractional loss of drug in PDMS was calculated by following formula,
| (10) |
The values of Pe and Fo were corrected to account for the inlet and outlet ports (Fig. 2). The Pe was calculated by using Eq. 9 using the flow rate dependent definition of Pe and w × h = 100 × 200 μm2. The Fo was calculated by using l of a hypothetical channel of uniform cross sectional area (100 × 200 μm2), and surface area equivalent to the total surface area of inlet, outlet ports, and the microfluidic channel.
Spectrophotometric analysis
The solution concentrations of rhodamine B and Cy3 SE were analysed using a fluorescent plate reader (Tecan, Switzerland). Paclitaxel concentration was measured by UV-Vis spectrophotometry (NanoDrop, Thermo Fisher Scientific, Boston, MA). The upper limit and lower limit of detection were initially determined by analysing a series of solutions of known concentrations. The spectrophotometric analysis of unknown samples was then performed with a serially diluted dye solution as the standard; buffer solution served as a negative control. At least triplicates of each sample were measured and are presented as mean ± SD.
Experimental measurement of the diffusion coefficient
To estimate the diffusion coefficient of the molecules in PDMS, the devices were perfused with rhodamine B, Cy3 SE, or paclitaxel conjugated with Oregon Green (MW 509, Molecular Probes, Carlsbad, CA). Live image acquisition was performed for 30 min using a motorized inverted epifluorescence microscope (Olympus IX 83, Tokyo, Japan) connected to computers with MetaMorph Advanced software (version 7.8.2.0). The acquired videos were analysed off line to determine the spatial distribution of grey values using ImageJ (1.47V). The experimental data was then fit to the analytical solution of Fick’s second law with appropriate boundary conditions (Eq. 4) using non-linear least squares by adjusting the value of the diffusion coefficient.
Results and Discussion
Microfluidic platforms are potentially important tools for drug screening. The absorption of drugs and other hydrophobic compounds in a polymer-based microfluidic platform has never been fully characterized by considering all of the physical factors that impact mass transport. This study was to develop and validate a quantitative understanding of drug absorption into PDMS, and thus be able to use this information to minimize absorption of drugs in PDMS- and other polymer-based organ-on-chip platforms.
Drug loss depends on K, Pe, and Fo
The power of using dimensionless groups is a reduction in the number of parameters needed to fully characterize a system. For our system, we have reduced the problem from 8 dimensional parameters (t, D, w, h, l, U, Sw, SP) to three dimensionless groups (K, Fo, and Pe). Thus, we need only vary the three dimensionless groups to understand and characterize drug loss. To capture the range of values for Fo and Pe, we first determined the range of values for the 6 dimensional parameters that comprise Fo and Pe, which would be commonly found in a microfluidic device (Table 1). Based on these values, we used 10−7 < Fo < 10−3 (−7 < logFo < −3) and 103 < Pe < 108 (3 < logPe < 8) in our simulations. K was varied in the range of 0.1 to 10,000 (logK = −1 to 4), which includes most drugs of relevance for a polymer such as PDMS.
The complete 3D model demonstrates that with: 1) increasing K the drug loss increases; 2) increasing Pe the drug loss decreases; and 3) increasing Fo the drug loss decreases (weakly) (Fig. 3). This is consistent with the dependence of drug loss on these dimensionless parameters in the approximate or simplified 1D model (Eq. 7). Of particular interest for minimizing drug loss is the region of the Pe vs Fo plots in which drug loss is <5%. For K≤0.1 (logK≤−1), drug loss is minimal for essentially all values of Pe and Fo. As K increases, this region shrinks, but does not disappear until logK>4 (Fig. 3). Interestingly, even for logK values as high as 3, less than 5% drug loss can be achieved by maintaining logPe values above ~7.0. Thus, these data collectively show that one can design experimental conditions (altering Pe and Fo) over a wide range of K to minimize drug loss. This result is consistent, yet also contrasts, with previous results that concluded drug absorption into PDMS was significant for logK>2.711. Based on our more comprehensive model, this result must be qualified. While drug absorption is potentially significant for logK>2.7, increasing Pe or Fo can also minimize drug loss in the design of the microfluidic device and/or experimental conditions.
Figure 3. Loss of drug in the PDMS is determined by K, Pe, and Fo.
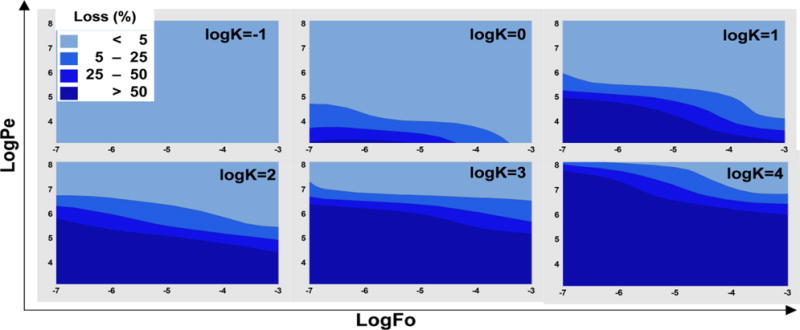
The COMSOL model was simulated by varying the parameters in the ranges given in Table 1. The percentage loss values were calculated. The model parameters were arranged in logPe and logFo values are presented as surface plots for various K values.
Estimation of diffusion coefficient
To validate the findings of the mathematical model, we experimentally analysed the transport properties of rhodamine B, Cy3 SE, and paclitaxel in a PDMS-based microfluidic device. The diffusion coefficients (mean±SD) of the three molecules were determined to be (1.9±0.5) × 10−13, (6.0±2.8) × 10−14, and (6.2±3.5) × 10−16 m2/s, respectively. A small deviation of the model (Fig. 4, rhodamine B) from the experimental data may be due to the weak dependence of the diffusion coefficient on concentration or the other simplifying assumptions in the 1D model. The surrogate paclitaxel used in these experiments was conjugated with a dye, which increased the molecular weight of paclitaxel by approximately 60%. Diffusion in solid polymers is strongly dependent on the molecular and scales approximately inversely with MW−2.67 (ref18); thus, the true diffusion coefficient of paclitaxel is closer to approximately 2.2 × 10⁻¹⁵ m2/s. These diffusion coefficients are expected based on the diffusivities of other hydrophobic solutes, such as benzene (D~4.8 × 10⁻¹² m2/s)19, when one considers the smaller molecular weight of benzene (79 Da) and the strong dependence of DP on MW. Finally, the particularly small diffusivity of paclitaxel is noteworthy (25% of the value predicted based on the diffusivity of benzene). The slow diffusion of paclitaxel should reduce drug loss into the PDMS (see below).
Figure 4. Estimation of rhodamine B diffusion coefficient in PDMS.
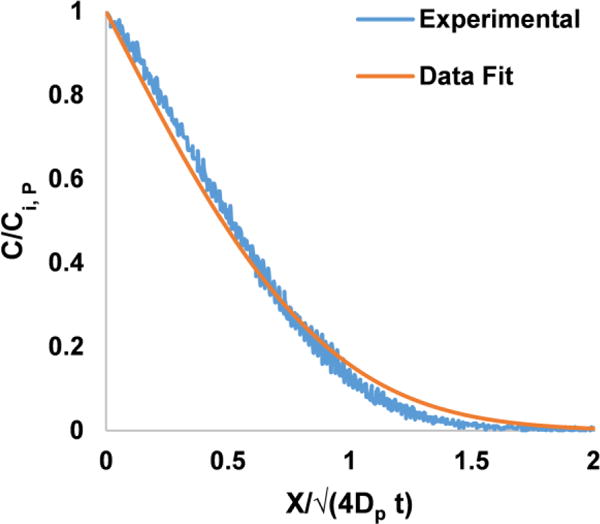
Rhodamine dye is perfused through the microfluidic device and the fluorescence was recorded. The gray values normalized with respect to gray values at the wall of the channel (C/Ci, P) were plotted. The experimental data shown is measured in a straight line perpendicular to the surface of the channel, where × = 0. The regression analysis was performed on the experimental data using equation 4.
Experimental measurements of drug loss match the 3D model
The loss of drug in PDMS was experimentally determined by spectrophotometric measurements of concentrations at the inlet and outlet for various values of Pe and Fo (Fig. 5A–B). The rhodamine B losses found by experiment generally fall in the same regions of losses predicted by the mathematical model. That is, LogPe 5.7, 6.7, and 7.7 resulted, respectively, in losses > 50%, >25%, and <5% at a constant logFo = −7.7. These losses were mainly in the PDMS device, as the losses in the tubing, attached to the device for sample collection, were small (<7% of the total loss), as found by perfusing rhrodamine B dye through tubing at conditions equivalent to logPe=5.7 and logFo =−6.7. These experimental findings, matched with the model data, providing further support to our premise that increasing Pe can minimize the drug loss.
Only one set of experimental conditions (and thus one Pe) was used for Cy3 SE and unlabelled-paclitaxel corresponding to the channel geometries, flow rates, and sampling as that used for rhodamine B dye which produced logPe = 6.7 and logFo = −6.7. For these conditions, the logPe was 7.2 and 9.2 and the logFo was −6.5 and −8.5 for Cy3 SE and paclitaxel, respectively. The experimentally measured losses fall in the same region as predicted by the model for Cy3 SE (>50%) and paclitaxel (<5%), further validating our model. Interestingly, eventhough paclitaxel has logK (=3.2) higher than the cutoff (logK<2.6) suggested previously11, the drug loss is low (<5%). This is due to the low diffusivity of paclitaxel in PDMS and convective flow, both of which serve to increase the value of Pe and thus reduce the loss of paclitaxel (Eq 7). These data strongly support the premise that drug absorption in PDMS is not solely dependent on the solubility, but also Pe and Fo.
To visually demonstrate the striking effect of Pe on drug loss, we created a device with three microfluidic channels of the same length (100 mm) but different cross sectional areas (Fig. 5C). Rhodamine B was delivered through all of the channels at an average hydrostatic head of 30 mm created between the Inlet and outlet of the channel. As velocity of fluid flowing through a channel for a given pressure drop is directly proportional to the square of the characteristic length [w h/(w+h)], with increasing cross sectional area of the channel the velocity increased. This experimental condition creates a constant Fo and K, but variable average Pe (Eq. 9) of 1, 2.3, and 4 times for channels of 100×100, 200×100, and 400×100 μm cross sections. With increasing Pe, the amount of absorption (or loss), indicated by the difference in colour intensity of source and sink, decreased (Fig. 5D).
The experimental data (Fig. 5B) also demonstrates that with increasing Fo (increasing logFo from −9.0 to −3.0 by increasing the time of the experiment, Eq. 8) the percent drug loss decreases for all logPe values. This may be counter intuitive as total drug loss would increase with increasing time of the experiment; however, the percent drug loss decreases as the magnitude of the concentration gradient at the solution-polymer interface decreases with increasing time. As flux of drug across the interface is proportional to the gradient (Fick’s 1st Law), the flux of drug decreases with increasing time. This can also be understood by considering infinite time in which the concentration of drug in the polymer would reach equilibrium with the concentration in the solution, and thus no concentration difference would exist across the interface resulting in zero drug loss. Collectively, these experimental data demonstrate that drug loss due to absorption into PDMS is predicted well using our mathematical model.
Interestingly rhodamine B was previously used to demonstrate a complete absorption of dye into PDMS9. This study was performed using a 0.025 × 0.3 × 240 mm channel at flow rate of 10 μl/hr9. This experimental condition results in logPe = 4.1 and logFo<−6.5. At these logPe and logFo values, our model predicts >50% drug loss (Fig. 5), consistent with the conclusions of the previous publication.
Simplified 1D model constraints
The simplified 1D model with an analytical solution for drug loss (Eq. 7) was formulated to provide an easy way to estimate the drug loss. However, this model is based on several simplifying assumptions. To determine how much the simplified 1D solution deviates from the 3D model, an error can be estimated as simply the difference between the two models:
Using this definition of error as an index, the 1D model provides a good estimate of drug loss with −5 < error < 5 for the following conditions, 1) small logK (<0.5) and all logPe values, and 2) 3.5>logK>0.5 and high logPe (>7; Fig. 6). In general, when logPe >1.1logK+3.6, the 1D model is useful, as indicated by the line graph (Fig. 6). In contrast, at low logPe and moderate logK (faint blue region in Fig. 6), the error in the 1D model is significant. Under these conditions, the drug loss is significant and the 1D model underestimates the losses compared to the 3D model. The low error for high logK (>2.5) and low logPe (<5) occur because in this region the losses approach 100%, and we have considered losses >100% are equal to 100% in the surface plot (Fig. 6).
Figure 6. Error in the estimation of losses by 1D model.
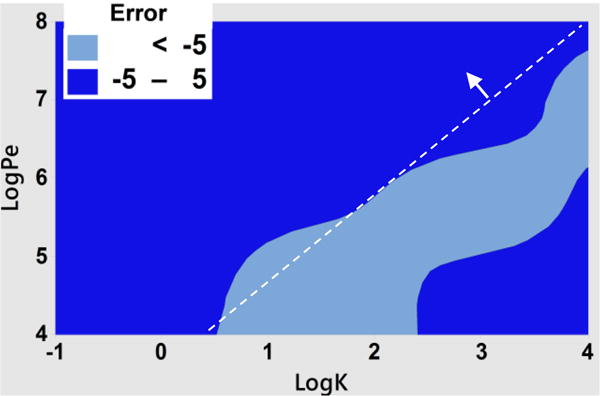
The average error was calculated by averaging the errors between 1D and 3D model over a range of logFo (−4 to −7). The dark blue color (−5 to 5 error) is the region of interest, where error is minimum. The dotted line separates the graph approximately into area of small error (pointed by the arrow), and area of high error. The equation of the line is Log (Pe) =1.1 logK+3.6.
The error variation with respect to variation in logFo (<−4) was very small (the standard deviation in the error < 1) in the regions of interest shown in Fig. 6, and therefore the 1D model is not constrained by logFo for the regions of interest.
Drug mixing between adjacent microfluidic channels
Organ-on-a-chip devices are typically designed to achieve high-throughput and include multiple microfluidic channels on a single platform. In such cases, it is possible that a drug could diffuse between adjacent or nearby microfluidic channels resulting in unintended mixing of the drug between adjacent channels. Thus, an important design consideration, or constraint, is the minimum distance between adjacent microfluidic channels. We can use our validated model to achieve this design constraint.
The conceptualization of adjacent microfluidic channels (one with drug and one without) is shown in Fig. 7. To find the concentration of drug at the interface of the drug-free channel Eq. 2 and 4 can be modified to yield following relationship,
| (11) |
by assuming that the drug-free channel is positioned just beyond the limit of the semi-infinite boundary condition. Here and are concentrations of drug at the solution-polymer interface of the drug-free channel and drug-containing channel, respectively and × is the separation distance between the two channels. This equation indicates that the relative concentration of drug ( ) at the interface of an adjacent drug-free channel depends on the dimensionless number,
Figure 7. The design parameter for controlling unintended mixing of drug in drug-free channel is ζ.
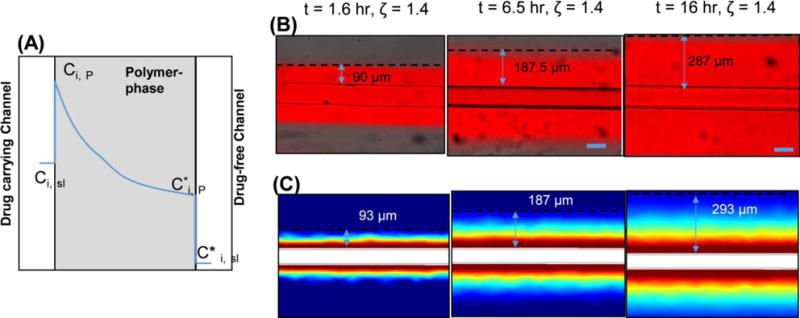
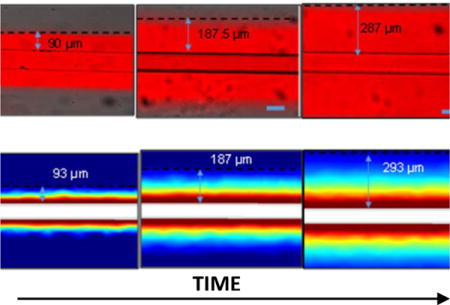
(A) The spatial concentration profile of drug (blue line) in a system of drug-carrying and drug-free channels. B) Rhodamine B dye perfused through the microfluidic channel and the diffusion distance, which was distance from the wall of the channel to the point where the gray values are <5% of that at wall was measured. The pictures show the diffusion distance for three different time points. C) The profiles were calculated using the 3D model.
| (12) |
Note that for ζ ≥ 2, .
To demonstrate the impact of ζ in our 3D model and experiments, we measured the maximum distance for which rhodamine B was detectable as it diffused away from the microfluidic channel (Fig. 7). In experiments and the 3D model, the maximum diffusion distance was defined as the distance from the drug-free channel in which the concentration was ≤ 5% of that at the drug-containing channel-PDMS interface. It is simple to see experimentally and understand conceptually that the distance travelled by the dye varies with time (Eq. 12), thus each time point is associated with a different maximum distance holding ζ constant at a value of 1.4. Thus, with the same constraints on Pe, Fo, and K as described earlier for the 1D model, one can determine from Eq. 11 and 12 that an additional design constraint for microfluidic devices is ζ ≥ 2.0 and 1.4 for maintaining concentrations < 1% and 5%, respectively, at the interface of an adjacent drug-free channel. For instance, the drug exposure duration for an organ-on-a-chip experiment could be as long as 1 day. For this time duration, to maintain < 1 % concentration at the interface of a drug-free channel (assuming drug D = 1.9 × 10⁻¹³ m2/s), the channels should be separated by >466 μm from the drug-carrying channel.
The flux of drug into an adjacent drug-free channel (J*) could be estimated by using equations 5 and 11, as follows.
| (13) |
Where Dsl is the diffusivity of drug into the solution, which could be considered constant (~10−10 m2/s). Thus, equations 11–13 show that, by maintaining the above mentioned constraints on ζ, the concentration ( ) and thereby the flux of drug in the surrounding channels could be minimized. Yet it is important to note that the extent of unintended drug mixing in a channel also depends on the concentrations of drug in the channel, geometry (surface area and volume), and convective flow through the channel. For instance, a high flow of fluid through the channel could significantly reduce the impact of drug diffusion through the polymer on overall concentration of the drug in the channel. Such experimental conditions could be accounted by adapting equations 11 and 13, on a case by case basis.
To provide a scalable equation, we can define the relative flux, Jrelative, as a ratio of flux into the drug free channel to flux out of the drug carrying channel. An analytical expression for Jrelative can be derived from equations 11–13 and equation 5,
| (14) |
This equation shows Jrelative is inversely proportional to K; in other words, as solubility in the polymer increases, the contamination in an adjacent channel decreases because the polymer has a larger capacity to absorb more of the drug (Fig. 8). The diffusion coefficient of rhodamine B in water is 4.5 × 10⁻¹⁰ m2/s; thus the ratio Dsl/DP is approximately 2500. As a result, with the constraint of ζ ≥ 2, the relative flux of drug into the drug free channel would be approximately 0.25/K (note erfc(2) is ~ 0.005). In other words, the flux of drug into the drug-free channel is <1% of the flux out of the drug carrying channel as long as K>25 (logK >1.4), or K<25 and ζ ≥ 2 (Fig. 8). Eqs. 11–14 can be used to make similar calculations for specific drugs. Thus, these data show that the experiments involving drugs with low K should also be carefully designed, especially when low levels of unintended mixing is desirable.
Figure 8. The relative flux into drug free channel depends on K and ζ.
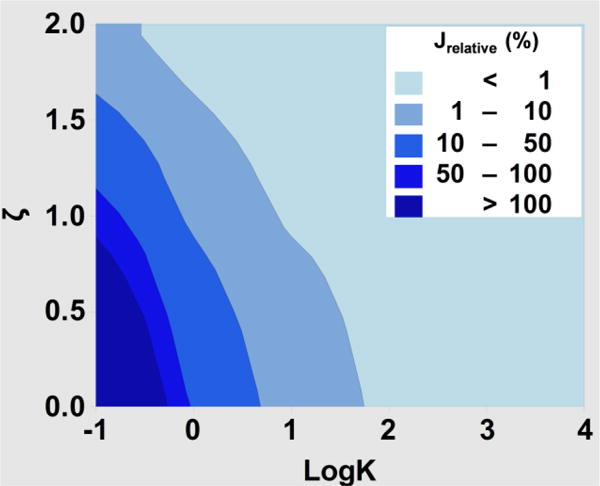
The relative flux was calculated by using eq. 14 for various values of K and ζ and diffusivities of rhodamine B.
Estimation of cancer and cardiovascular drug loss
To provide an estimate of losses of common drugs under common experimental conditions, we analysed the behaviour of a series of anti-cancer and cardiovascular drugs (Table S1). We estimated the diffusion coefficients of the drugs using a simple correlation in molecular weight and diffusivities (supplementary methods). The data show that several types of anti-cancer and cardiovascular drugs could be used in PDMS platforms with <5% losses. Even when logK>4. it is possible to achieve small losses (<25%) by increasing flow rate (e.g., Sunitinib and Verapamil in Table S1). Alternatively, the losses for lipophilic drugs could be low if the drug diffusivity in PDMS is small, as we found for paclitaxel. These strategies could be useful for implementing highly lipophilic drugs with logK>4 in PDMS devices.
The molecular weight based correlation to determine the diffusion coefficient provided in this study may not be sufficient for precisely predicting losses in PDMS. More comprehensive correlations accounting for additional physicochemical properties of solute, such as charge, size, and shape would provide a more precise estimate of the diffusion coeffiecients and losses, but is beyond the scope of the current study.
The ratio ( ), indicating mixing in adjacent drug free channel, is <1% if the channel is at >10 mm from the drug carrying channel for all of the drugs we analysed. If the design necessitates a separation distance of <10 mm, one should consider other methods to minimize channel interaction such as the duration of the experiment or the diffusivity of the drug.
Conclusions
The use of polymer-based microfluidic devices to create organ-on-a-chip mimics of human physiology for drug discovery is compelling. A potential hurdle to overcome is the absorption of drugs into the polymer, which can reduce the intended drug exposure and cause undesirable mixing between adjacent channels, both of which confound interpretation of experiments. By considering convection, dissolution, and diffusion of the drug within the microfluidic channels and surrounding polymer, we have created a quantitative framework consisting of only four dimensionless groups that can be used to design devices and experiments that minimize the effect of drug absorption into the polymer. Reducing the problem to a minimum number of dimensionless groups provides tremendous flexibility to minimize drug loss. For example, one can increase the Pe by increasing the volumetric flow, decreasing the channel height, or decreasing the channel width (Eq. 9). The percent drug loss from a microfluidic channel into the surrounding polymer can be easily estimated (Eq. 7), and the unintended mixing of drugs can be minimized for ζ ≥ 2 (Eq. 12). These design considerations are derived from a simple 1D model and are thus subject to the following constraints: logPe >1.1logK+3.6, logFo < −4. Using this framework, microfluidic devices and experiments can be designed for drug discovery using hydrophobic polymers such as PDMS even for lipophilic drugs.
Supplementary Material
Acknowledgments
This work was supported by grants from the National Institutes of Health (UH3 TR00048 and R01 CA170879. The authors thanks to Dr. M. Traore (Washington University in St. Louis) for insightful discussions, and Mr. A. Tao for technical assistance (Washington University in St. Louis).
References
- 1.Bhatia SN, Ingber DE. Nat Biotechnol. 2014;32:760–772. doi: 10.1038/nbt.2989. [DOI] [PubMed] [Google Scholar]
- 2.Huh D, Leslie DC, Matthews BD, Fraser JP, Jurek S, Hamilton GA, Thorneloe KS, McAlexander MA, Ingber DE. Sci Transl Med. 2012;4 doi: 10.1126/scitranslmed.3004249. [DOI] [PMC free article] [PubMed] [Google Scholar]
- 3.Morgan JP, Delnero PF, Zheng Y, Verbridge SS, Chen JM, Craven M, Choi NW, Diaz-Santana A, Kermani P, Hempstead B, Lopez JA, Corso TN, Fischbach C, Stroock AD. Nature protocols. 2013;8:1820–1836. doi: 10.1038/nprot.2013.110. [DOI] [PubMed] [Google Scholar]
- 4.Zervantonakis IK, Hughes-Alford SK, Charest JL, Condeelis JS, Gertler FB, Kamm RD. Proc Natl Acad Sci U S A. 2012;109:13515–13520. doi: 10.1073/pnas.1210182109. [DOI] [PMC free article] [PubMed] [Google Scholar]
- 5.Kim HJ, Li H, Collins JJ, Ingber DE. Proc Natl Acad Sci U S A. 2016;113:E7–E15. doi: 10.1073/pnas.1522193112. [DOI] [PMC free article] [PubMed] [Google Scholar]
- 6.Huh D, Matthews BD, Mammoto A, Montoya-Zavala M, Hsin HY, Ingber DE. Science. 2010;328:1662–1668. doi: 10.1126/science.1188302. [DOI] [PMC free article] [PubMed] [Google Scholar]
- 7.Marsano A, Conficconi C, Lemme M, Occhetta P, Gaudiello E, Votta E, Cerino G, Redaelli A, Rasponi M. Lab on a Chip. 2016;16:599–610. doi: 10.1039/c5lc01356a. [DOI] [PubMed] [Google Scholar]
- 8.Moya ML, Hsu YH, Lee AP, Hughes CC, George SC. Tissue engineering Part C, Methods. 2013;19:730–737. doi: 10.1089/ten.tec.2012.0430. [DOI] [PMC free article] [PubMed] [Google Scholar]
- 9.Domansky K, Leslie DC, McKinney J, Fraser JP, Sliz JD, Hamkins-Indik T, Hamilton GA, Bahinski A, Ingber DE. Lab on a Chip. 2013;13:3956–3964. doi: 10.1039/c3lc50558h. [DOI] [PMC free article] [PubMed] [Google Scholar]
- 10.Toepke MW, Beebe DJ. Lab on a Chip. 2006;6:1484–1486. doi: 10.1039/b612140c. [DOI] [PubMed] [Google Scholar]
- 11.Wang JD, Douville NJ, Takayama S, ElSayed M. Ann Biomed Eng. 2012;40:1862–1873. doi: 10.1007/s10439-012-0562-z. [DOI] [PubMed] [Google Scholar]
- 12.Crank J. The mathematics of diffusion. Oxford University Press; US: 1975. [Google Scholar]
- 13.Treybal RE. Mass-Transfer Operations. McGraw-Hill; 1980. [Google Scholar]
- 14.Difilippo EL, Eganhouse RP. Environ Sci Technol. 2010;44:6917–6925. doi: 10.1021/es101103x. [DOI] [PubMed] [Google Scholar]
- 15.Wishart DS, Knox C, Guo AC, Shrivastava S, Hassanali M, Stothard P, Chang Z, Woolsey J. Nucleic Acids Res. 2006;34:D668–672. doi: 10.1093/nar/gkj067. [DOI] [PMC free article] [PubMed] [Google Scholar]
- 16.Tetko IV, Gasteiger J, Todeschini R, Mauri A, Livingstone D, Ertl P, Palyulin V, Radchenko E, Zefirov NS, Makarenko AS, Tanchuk VY, Prokopenko VV. J Comput Aided Mol Des. 2005;19:453–463. doi: 10.1007/s10822-005-8694-y. [DOI] [PubMed] [Google Scholar]
- 17.Leeson PD, Springthorpe B. Nat Rev Drug Discov. 2007;6:881–890. doi: 10.1038/nrd2445. [DOI] [PubMed] [Google Scholar]
- 18.Karlsson OJ, Stubbs JM, Karlsson LE, Sundberg DC. Polymer. 2001;42:4915–4923. [Google Scholar]
- 19.Li B, Pan FS, Fang ZP, Liu L, Jiang ZY. Ind Eng Chem Res. 2008;47:4440–4447. [Google Scholar]
Associated Data
This section collects any data citations, data availability statements, or supplementary materials included in this article.


