Abstract
Purpose:
Our goal was to study both right and left ventricular blood flow in patients with precapillary pulmonary hypertension (pre-PH) with 4-dimensional (4D) flow magnetic resonance imaging (MRI) and to analyze their correlation with cardiac functional metrics on cardiovascular magnetic resonance (CMR) and hemodynamics from right heart catheterization (RHC).
Materials and Methods:
129 patients (64 females, mean age 47 ± 13 y) including 105 patients with pre-PH (54 females, mean age 49 ± 13 y) and 24 patients without PH (10 females, mean age 40 ± 12 y) were retrospectively included. All patients underwent CMR and RHC within 48 hours. 4D flow MRI was acquired using a 3-dimensional retrospectively electrocardiograph-triggered, navigator-gated phase contrast sequence. Right and left ventricular flow components including the percentages of direct flow (PDF), retained inflow (PRI), delayed ejection flow (PDE), and residual volume (PRVo) were respectively quantified. The ventricular flow components between patients with pre-PH and non-PH were compared and correlations of flow components with CMR functional metrics and hemodynamics measured with RHC were analyzed. Biventricular flow components were compared between survivors and deceased patients during the perioperative period.
Results:
Right ventricular (RV) PDF and PDE significantly correlated with RVEDV and RV ejection fraction. RV PDF negatively correlated with pulmonary arterial pressure (PAP) and pulmonary vascular resistance. When the RV PDF was <11%, the sensitivity and specificity of RV PDF for predicting mean PAP ≥25 mm Hg were 88.6% and 98.7%, respectively, with an area under the curve value of 0.95 ± 0.02. When RV PRVo was more than 42%, the sensitivity and specificity of RV PRVo for predicting mean PAP ≥25 mm Hg were 85.7% and 98.5%, respectively, with an area under the curve value of 0.95 ± 0.01. Nine patients died during the perioperative period. Biventricular PDF, RV PDE, and PRI of survivors were higher than nonsurvivors whereas RV PRVo increased in deceased patients.
Conclusions:
Biventricular flow analysis with 4D flow MRI provides comprehensive information about the severity and cardiac remodeling of PH and may be a predictor of perioperative death of patients with pre-PH.
Key Words: magnetic resonance imaging, 4-dimensional flow, precapillary pulmonary hypertension, function, hemodynamics
Precapillary pulmonary hypertension (pre-PH) is a condition characterized by an increased mean pulmonary artery pressure (MPAP; ≥25 mm Hg) and pulmonary arterial wedge pressure (PAWP) ≤15 mm Hg measured with right heart catheterization (RHC),1 in which pulmonary arterial hypertension (PAH) and chronic thromboembolic PH (CTEPH) are the representative diseases. The main cause of mortality in PH patients is right ventricular (RV) failure, especially in patients with PAH and CTEPH.2 Although RV ejection fraction (RVEF) was the strongest prognostic factor among all the RV remodeling parameters, it is clear that cardiac interaction can cause left ventricular dysfunction, thus biventricular assessment is paramount.
Cardiovascular magnetic resonance (CMR) is accurate and reproducible in the assessment of cardiac size, morphology, and function and allows noninvasive assessment of blood flow.3–5 Recently, time-resolved phase contrasted-magnetic resonance imaging (MRI) with velocity encoding along all 3 flow directions and 3-dimensional anatomic coverage (also termed “4-dimensional [4D] flow MRI”), provides unrivaled capabilities for comprehensive analysis of complex blood flow patterns using new visualization tools.6,7 Pulmonary arterial wall shear stress, blood flow, pulse-wave velocities, and kinetic energy losses also have been noninvasively evaluated with 4D flow MRI.8–11 Moreover, 4D flow MRI can characterize atrial and ventricular blood flow, allowing for qualitative and visual assessment of coherent ventricular blood flow patterns.12,13 Alattar et al14 suggested that the ratio of early (E) and late (A) blood peak filling velocities (E/A ratio) can be accurately measured using 4D flow MRI either at a fixed mitral leaflet tip location or through annulus plane time-resolved tracking. Han et al15 found patients with PH had significantly increased RV kinetic energy work density as well as a much greater percentage of pulmonary arterial energy loss than healthy subjects. Noticeably, Fredriksson et al,16 with 4D flow MRI, found RV flow components differed from the left ventricle (LV) and direct flow (DF) ensues systolic ejection. Ventricular function and flow are not independent, however, to date, their relationships have not been clarified in patients with pre-PH. In addition, the relationship between right and left ventricular flow components with risks of perioperative death remains unclear.
Therefore, the purpose of this study was to observe the characteristics of biventricular flow components in Pre-PH patients with 4D flow MRI and to analyze the correlation of ventricular flow with RV function and hemodynamics. Subsequently, we compare ventricular flow components between survivors and deceased patients in the perioperative period.
MATERIALS AND METHODS
Population and Study Design
This single-center, retrospective cohort study was performed according to the Declaration of Helsinki and was approved by the Ethics Committee of our hospital. The consent of individuals was waived for the retrospective study. We enrolled patients with pre-PH who underwent RHC and CMR in our hospital between January 2017 and January 2022. The included participants were older than 18 years and younger than 65 years. All patients who underwent CMR within 48 hours before RHC were included. Patients whose PAWP is more than 15 mm Hg were excluded. Patients in groups 2, 3, and 5 PH were excluded.1 Patients with malignancy, cardiomyopathy, cardiac shunts, severe cirrhosis, and kidney dysfunction were excluded. Patients with poor quality 4D flow MRI or CMR images or incomplete RHC data were also excluded. Meanwhile, patients without PH (MPAP <25 mm Hg and pulmonary arterial wedge pressure ≤15 mm Hg measured with RHC) were included as the controls (non-PH group). Figure 1 demonstrates a flowchart detailing how participants were selected. Treatment and prognosis during the perioperative period of patients who underwent pulmonary endarterectomy (PEA), balloon pulmonary angioplasty (BPA), or lung transplantation were collected from the medical charts.
FIGURE 1.
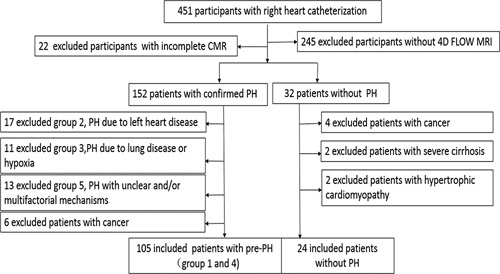
A flowchart detailing how participants were selected.
Cardiovascular MRI
CMR including 4D flow was performed on a 1.5 T clinical scanner (MAGNETOM Area, Siemens Healthcare) using an 18-channel phased-array surface coil. Images were acquired during end-expiratory breath holds with retrospective electrocardiographic gating. The cine of standard long-axis 4-chamber and contiguous short-axis slices covering both ventricles from base to apex were acquired with Trufi (typical acquisition parameters: repetition time/echo time 34.5/1.1 ms, flip angle 50 to 60 degrees, slice thickness 8 mm, in-plane spatial resolution 1.8×1.8 mm2, temporal resolution 40 ms, 25 reconstructed cardiac phases). 4D flow data were acquired using a 3-dimensional retrospectively electrocardiograph-triggered, navigator-gated phase contrast sequence in free-breath. The field of view was adjusted to cover the whole heart of each subject. Parameters included: repetition time/echo time 40.2/2.5 ms, flip angle 7 degrees, 50 ms reconstructed temporal resolution, 2.4×2.4×2.8 mm3 voxel size, and velocity encoding 100 -150 cm/s. Twenty-five reconstructed cardiac phases. Maxwell corrections were done during scanning. Concomitant gradient field effects were also corrected on the scanner. The total scan time was 6 to 8 minutes.
CMR Function and Ventricular 4D Flow Analysis
Ventricular metrics including RV and LV end-diastolic and end-systolic volumes index (RVEDVI, RVESVI, LVEDVI, LVESVI) and ejection fractions (RVEF, LVEF) were analyzed with CardiacFunction on SyngoVia workstation (Siemens Healthcare) by a cardiovascular radiologist with 5 years of experience. RV end-systolic remodeling index (RVESRI)17,18 was measured by a cardiovascular radiologist with 3 years of experience.
4D flow data were transferred to cmr42 (Version 5.10.1, Circle Cardiovascular Imaging), and biventricular flow was analyzed by a cardiovascular radiologist with 5 years of experience with 4D flow software module, consisting of background phase correction, noise filer and velocity aliasing correction, endocardial segmentation at end diastole, and end-systole with pathline generation from each segmented voxel. The positions of pathlines at end-systole were divided into 4 functional flow components as described19,20 (Fig. 2): (1) DF: blood that enters the ventricle during diastole and leaves the ventricle during systole in the analyzed heartbeat; (2) Retained inflow (RI): blood that enters the ventricle during diastole but does not leave during systole in the analyzed heartbeat; (3) Delayed ejection (DE) flow: blood that starts and resides inside the ventricle during diastole and leaves during systole in the analyzed heartbeat. (4) Residual volume (RVo): blood that resides within the ventricle for at least 2 cardiac cycles. Each component was calculated as a proportion of the total end-diastolic volume. The total analysis time of the 4D flow was 5 to 10 minutes.
FIGURE 2.
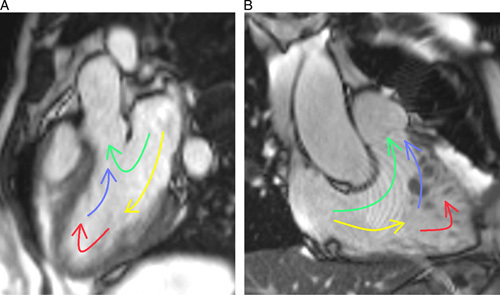
A, LV flow component illustration. B, RV blood flow component illustration. DF represented by green; RI, yellow; DE, blue; RVo, red.
RHC
Hemodynamics of all included patients were assessed with RHC. Venous access was obtained by inserting an introducer into the internal jugular vein. A Swan-Ganz standard thermodilution pulmonary artery catheter was placed at the right inferior pulmonary artery. The measured indices were mean MPAP, PAWP, and pulmonary vascular resistance (PVR). Cardiac output (CO) was determined using the Fick method.
Statistical Analyses
Statistics were analyzed using SPSS 22. All data are presented as mean ± SD unless otherwise specified. T test or Mann-Whitney U tests were used to compare the 2 groups. Correlations were assessed using the Spearman correlation analysis. The receiver operating characteristic curve (ROC) analysis was used to determine the cutoff value of RV flow components in the prediction of MPAP ≥25 mm Hg. All tests were 2-sided and P <0.05 was considered a statistically significant difference.
RESULTS
Participants
One hundred five patients with pre-PH (pre-PH group) and 24 patients without PH (non-PH group) retrospectively entered this study. Demographic and clinical data of all patients are shown in Table 1. There were 72 with CTEPH, 23 with idiopathic pulmonary arterial hypertension (IPAH), 2 with pulmonary artery sarcoma (PAS), 7 with Takayasu Arteritis (TA), and 1 pulmonary capillary hemangiomatosis (PCH) in the pre-PH group whereas 24 patients with non-PH included 18 with chronic thromboembolism, 5 with TA, and 1 with pulmonary artery lipoma.
TABLE 1.
Demographic and Clinical Characteristics of All Included Patients
| Demographic and clinical data | Total | Pre-PH | Non-PH | P |
|---|---|---|---|---|
| Case; n (%) | 129 | 105 (81.4) | 24 (18.6) | — |
| Age (y) | 47±13 | 49±13 | 40±12 | t = −2.38 (0.019)* |
| Sex (F/M) | 64/65 | 54/51 | 10/14 | x 2 = 2.31 (0.129) |
| Heart rate (b/min) | 83±17 | 88±18 | 81±10 | t = 2.27 (0.025)* |
| Body mass index (Kg/m2) | 23±2 | 23±4 | 24±4 | t = −0.23 (0.822) |
| Systolic BP (mm Hg) | 116±14 | 114±14 | 120±13 | t = 0.97 (0.333) |
| Diastolic BP (mm Hg) | 79±13 | 77±13 | 82±12 | t = 1.27 (0.208) |
| 6 min walk distance (m) | 349±164 | 296±115 | 572±103 | t = 7.36 (<0.001)* |
| Plasma biomarkers | ||||
| NT-proBNP (pg/mL), median (IQR) | 506 (138,1341) | 770 (288,1400) | 28 (21,83) | U = 54.00 (<0.001)* |
| RHC | ||||
| Systolic PAP (mm Hg) | 65±27 | 76±23 | 26±3 | t = −9.31 (<0.001)* |
| Diastolic PAP (mm Hg) | 24±13 | 29±11 | 12±4 | t = −8.84 (<0.001)* |
| MPAP (mm Hg) | 40±17 | 48±14 | 19±3 | t = −9.17 (<0.001)* |
| PAWP (mm Hg) | 9±3 | 10±4 | 8±2 | t = 3.26 (0.074) |
| PVR (dyne.s.cm5) | 917±615 | 1119±597 | 205±22 | t = −13.04 (<0.001)* |
| CO (L/min) | 3.8±1.8 | 3.0±1.2 | 5.1±2.1 | t = 11.37 (<0.001)* |
| CI (L/min/m2) | 2.3±1.3 | 2.4±1.0 | 4.3±1.2 | t = 10.18 (<0.001)* |
| Treatment | ||||
| PEA | 63 | 62 | 1 | — |
| BPA | 30 | 12 | 18 | — |
| Lung transplantation | 6 | 6 | 0 | — |
| Combination medical therapy | 30 | 25 | 5 | — |
| perioperative death | 9 | 9 | 0 | — |
P < 0.05, values are expressed as mean ± SD or number (percentage), or median and IQR.
BP indicates blood pressure; BPA, balloon pulmonary angioplasty; CI, cardiac index; IQR, interquartile range
In pre-PH group, 60 and 12 patients with CTEPH respectively underwent PEA and BPA. Two patients with PAS underwent PEA. Five patients with IPAH and 1 with PCH underwent lung transplantation. In non-PH group, 15 patients with chronic thromboembolism and 3 patients with TA underwent BPA. One case of pulmonary lipoma underwent pulmonary lipoma resection.
Of patients with CTEPH, 3 patients died within 1 week after PEA and 1 patient died after BPA. Two patients with IPAH and 1 patient with PCH died within 12 days after lung transplantation, and 2 patients with IPAH died of sudden massive hemoptysis during hospitalization in 1 month. Other patients are still being follow-up.
Ventricular Function and Flow Characters
Table 2 shows right and left ventricular function between the pre-PH group and non-PH group. Compared with the non-PH group, patients with pre-PH had significantly lower RVEF, CO, and cardiac index (P < 0.001) but higher RVEDVI, RVESVI RV mass index, and RVESRI (P < 0.001). LVEDVI, stroke volume index (LVSVI), and LV mass index (P < 0.001) in patients with pre-PH significantly reduced whereas LVESVI and LVEF were comparable between the two groups.
TABLE 2.
CMR Functional Parameters in Patients With Pre-PH and Non-PH
| CMR variables | Pre-PH group | Non-PH group | U (P) |
|---|---|---|---|
| RVEDVI (mL/m2) | 101.1±37.2 | 60.4±6.1 | 218.5 (<0.001)* |
| RVESVI (mL/m2) | 68.1±36.8 | 28.6±8.2 | 163.2 (<0.001)* |
| RVSVI (mL/m2) | 33.4±22.2 | 32.2±4.1 | 1096.0 (0.976) |
| RVEF (%) | 33.7±19.9 | 54.8±10.0 | 488.0 (<0.001)* |
| RVMI (g/m2) | 38.1±19.2 | 25.1±14.7 | 288.4 (<0.001)* |
| RV-CO (L/min) | 2.9±1.4 | 4.8±1.7 | 15.0 (<0.001)* |
| RV-CI(L/min/m2) | 2.0±1.3 | 3.9±1.6 | 14.7 (<0.001)* |
| RVESRI | 1.9±0.3 | 1.2±0.1 | 84.3 (<0.001)* |
| LVEDVI (mL/m2) | 54.9±14.3 | 67.0±7.1 | 498.0 (<0.001)* |
| LVESVI (mL/m2) | 25.3±8.1 | 25.8±3.8 | 1049.3 (0.724) |
| LVSVI (mL/m2) | 31.3±10.7 | 40.2±4.6 | 463.2 (<0.001)* |
| LVEF (%) | 53.7±14.7 | 61.9±2.7 | 829.1 (0.071) |
| LVMI (g/m²) | 78.9±16.3 | 86.3±15.0 | 720.2 (0.012)* |
P < 0.05.
CI indicates cardiac index; LVMI, left ventricular mass index; RVMI, right ventricular mass index.
Visualizations of right and left ventricular flow of patients with pre-PH and non-PH are respectively shown in Figure 3 (pre-PH) and Figure 4 (non-PH). Table 3 shows the proportion of the RV and LV flow components between pre-PH and non-PH groups. The percentage of LV DF (LV-PDF) of patients with pre-PH decreased (U = 432.0, P < 0.001) whereas the percentage of LV DE (LV-PDE) (U = 954.0, P < 0.001) and the percentage of LV RI (LV-PRI) (U = 931.0, P < 0.001) increased. However, the percentage of LV residual volume (LV-PRVo) (U = 1629.0, P = 0.271) was comparable between the two groups. The percentage of RV DF (RV-PDF) (U = 171.0, P < 0.001), RV-DE (RV-PDE) (U = 459.0, P < 0.001), and RV RI (RV-PRI) (U = 441.0, P < 0.001) of patients with pre-PH significantly decreased in comparison with the non-PH group. The percentage of RV residual volume (RV-PRVo) of patients with pre-PH was significantly elevated (U = 162.0, P < 0.001).
FIGURE 3.
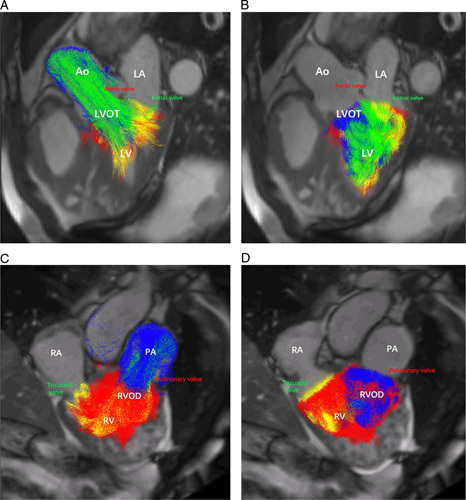
Visualization of LV and RV flow in a female patient with CTEPH (MPAP = 44 mm Hg and PVR = 1200 dyne.s.cm5). A, Pathline visualization of the LV flow components (DF, RI, DE flow, and residual volume) in systole. B, Pathline visualization of the LV flow components (DF, RI, DE flow, and residual volume) in diastole. C, Pathline visualization of the RV flow components (DF, RI, DE flow, and residual volume) in systole. D, Pathline visualization of the RV flow components (DF, RI, DE flow, and residual volume) in diastole. Ao indicates aorta; LA, left atrium; LVOT, left ventricular outflow tract; PA, pulmonary artery; RA, right atrium; RVOD, RV outflow tract.
FIGURE 4.
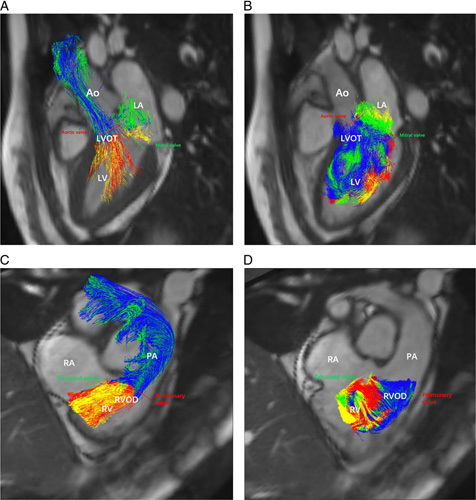
Visualization of left and RV flow in a male patient with chronic thromboembolism (MPAP = 16 mm Hg, PVR = 160 dyne.s.cm5). A, Pathline visualization of the LV flow components (DF, RI, DE flow, and residual volume) in systole, B, Pathline visualization of the LV flow components (DF, RI, DE flow, and residual volume) in diastole. C, Pathline visualization of the RV flow components (DF, RI, DE flow, and residual volume) in systole. D, Pathline visualization of the RV flow components (DF, RI, DE flow, and residual volume) in diastole. Ao indicates aorta; LA, left atrium; LVOT, left ventricular outflow tract; PA, pulmonary artery; RA, right atrium; RVOD, RV outflow tract.
TABLE 3.
Comparison of Right and Left Ventricular Flow in Patients With Pre-PH and Non-PH
| Biventricular flow | Pre-PH (%) | Non-PH (%) | U | P |
|---|---|---|---|---|
| RV-PDF | 5.9±8.9 | 31.2±10.7 | 171.0 | <0.001* |
| RV-PDE | 15.3±5.7 | 22.3±2.8 | 459.0 | <0.001* |
| RV-PRI | 15.6±5.9 | 23.2±3.9 | 441.0 | <0.001* |
| RV-PRVo | 63.2±17.9 | 22.6±10.0 | 162.0 | <0.001* |
| LV-PDF | 21.8±10.6 | 37.8±2.7 | 432.0 | <0.001* |
| LV-PDE | 22.4±6.6 | 16.9±3.2 | 954.0 | <0.001* |
| LV-PRI | 22.3±6.7 | 17.1±4.6 | 931.0 | <0.001* |
| LV-PRVo | 33.7±13.5 | 28.3±3.6 | 1629.0 | 0.271 |
P < 0.001.
Correlation of RV Flow With CMR Function and Remodeling Markers
Table 4 shows RV-PDF, RV-PDE, RV-PRI, and RV-PRVo significantly correlated with RVEDVI, RVSVI, RVEF, RV mass, and RV-CO. RV-PDF (r = −0.633, P < 0.001), RV-PDE (r = −0.566, P < 0.001), and RV-PRI (r = −0.593, P < 0.001) negatively correlated with RVESRI whereas RV-PRVo positively correlated with RVESRI (r = 0.710, P < 0.001). Moreover, Figure 5 shows that RV-PDF (r = −0.693, P < 0.001), RV-PDE (r = −0.515, P < 0.001), and RV-PRI (r = −0.499, P < 0.001) had a negative correlation with N-terminal pro-brain natriuretic peptide (NT-proBNP) whereas PRVo (r = 0.714, P < 0.001) was positively correlated with NT-proBNP.
TABLE 4.
Correlation of RV Flow Components With RV Function on CMR of All Patients
| CMR metrics | RVEDVI (mL/m2) | RVESVI (mL/m2) | RVSVI (mL/m2) | RVMI (g/m2) | RV-CO (L/min) | RVEF (%) |
|---|---|---|---|---|---|---|
| RV-PDF | −0.67* | −0.46* | 0.31* | −0.78* | 0.65* | 0.55* |
| RV-PDE | −0.62* | −0.50* | 0.14 (0.126) | −0.56* | 0.48* | 0.45* |
| RV-PRI | −0.58* | −0.48* | 0.10 (0.248) | −0.58* | 0.48* | 0.41* |
| RV-PRVo | 0.69* | 0.52* | −0.20 (0.028) | 0.77* | 0.67* | −0.52* |
Statistically significant (P < 0.01) correlation.
RVMI indicates right ventricular mass index.
FIGURE 5.
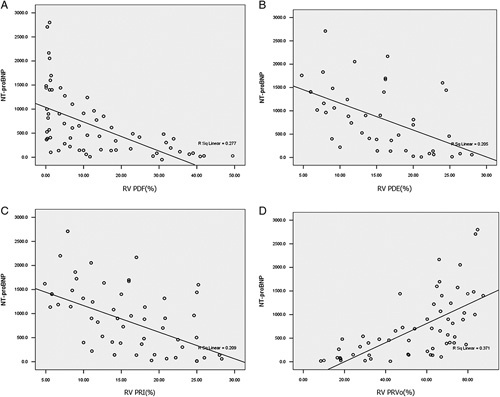
Correlations of RV flow components with NT-proBNP. A, RV-PDF negatively correlates with NT-proBNP. B, RV-PDE negatively correlates with NT-proBNP. C, RV-PRI negatively correlates with NT-proBNP. D, RV-PRVo positively correlates with NT-proBNP.
RV Flow and Hemodynamics With RHC
Table 5 shows the correlation of RV flow components with hemodynamics measured with RHC. RV-PDF, RV-PDE, and RV-PRI negatively correlated with pulmonary artery pressure (PAP) and PVR while they positively correlated with CO. Moreover, RV-PRVo had a positive correlation with PAP and PVR whereas PRVo had a negative correlation with CO. None of the RV flow components correlated with PCWP. ROC (Fig. 6) shows that when RV-PDF is <11%, the sensitivity and specificity of RV-PDF for predicting PH (MPAP ≥25 mm Hg) respectively are 88.6% and 98.7% with an area under ROC value of 0.95 ± 0.02. When RV-PRVo is more than 42%, its sensitivity and specificity for predicting PH (MPAP ≥25 mm Hg) respectively were 85.7% and 98.5% with an area under the curve value of 0.95 ± 0.01.
TABLE 5.
Correlation of RV Flow Components and Hemodynamics With RHC
| RV flow (%) | SPAP (mm Hg) | DPAP (mm Hg) | MPAP (mm Hg) | CO (L/min) | PVR (dyne.s.cm5) | PCWP (mm Hg) |
|---|---|---|---|---|---|---|
| −0.68* | −0.55* | −0.67* | 0.56* | −0.74* | 0.09 (0.525) | |
| PDE | −0.70* | −0.54* | −0.69* | 0.30 (0.013) | −0.49* | −0.05 (0.695) |
| PRI | −0.69* | −0.52* | −0.68* | 0.27 (0.030) | −0.46* | −0.08 (0.561) |
| PRVo | 0.74* | 0.66* | 0.78* | −0.49* | 0.70* | −0.02 (0.930) |
Statistically significant (P < 0.01).
DPAP indicates diastolic pulmonary arterial pressure; SPAP, systolic pulmonary arterial pressure.
FIGURE 6.
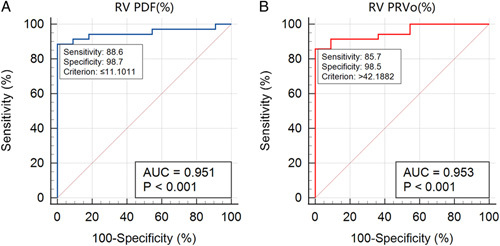
The ROC of the ability of RV-PDF (A) and RV-PRVo (B) to detect MPAP ≥25 mm Hg. A, When RV-PDF is <11%, the sensitivity and specificity of RV-PDF for predicting PH (MPAP ≥25 mm Hg) respectively are 88.6% and 98.7% with an area under ROC value of 0.95 ± 0.02. B, When RV-PRVo is more than 42%, its sensitivity and specificity for predicting PH (MPAP ≥25 mm Hg) respectively were 85.7% and 98.5% with an area under the curve value of 0.95 ± 0.01. AUC indicates area under the curve.
Ventricular Flows in Patients With PH During Perioperative Period
Nine patients with pre-PH deceased during the perioperative period. As shown in Table 6, RV-PDF, RV-PDE, and RV-PRI of survivors were higher in comparison with the deceased patients whereas RV-PRVo was significantly increased in the deceased patients. Moreover, compared with survivors, LV-PDF was also decreased in nonsurvivors while other LV flow components were comparable.
TABLE 6.
Biventricular Flow in Survivors and Deceased PH Patients During Perioperative Periods
| Flow components (%) | Survivors (median) | Nonsurvivors (median) | U (P) |
|---|---|---|---|
| RV-PDF | 8.4 | 3.1 | 238.5 (0.003)* |
| RV-PDE | 16.7 | 6.9 | 18.0 (<0.001)* |
| RV-PRI | 16.6 | 6.9 | 18.0 (<0.001)* |
| RV-PRVo | 58.3 | 83.1 | 25.00 (<0.001)* |
| LV-PDF | 26.6 | 13.1 | 270.0 (0.015)* |
| LV-PDE | 19.5 | 24.2 | 507.0 (0.595) |
| LV-PRI | 19.6 | 24.3 | 507.0 (0.595) |
| LV-PRVo | 34.3 | 38.4 | 455.0 (0.381) |
Mann-Whitney U test, P < 0.05.
DISCUSSION
In the current study, we analyzed both right and left ventricular flow in patients with pre-PH and non-PH for the first time, moreover, we investigated the correlation of ventricular flow with ventricular function and remodeling biomarkers as well as hemodynamics. The major findings are as follows: (1) flow components in both ventricles were disturbed in patients with pre-PH, in comparison with patients with non-PH. (2) RV flow components closely correlated with RV functional and remodeling markers as well as NT-proBNP. (3) RV flow components, especially the PDF and PRVo, correlated with PAP and PVR. (4) RV flow and LV-PDF deteriorate and may be a predictor of perioperative death.
First, we found the biventricular blood flow components of the pre-PH group were different from the non-PH group. Compared with patients with non-PH, RV-PDF, RV-PDE, and RV-PRVo of patients with pre-PH significantly decreased while RV-PRVo increased. This phenomenon is similar to the changes in LV flow components of patients with dilated cardiomyopathy and ischemic cardiomyopathy.19 Moreover, there was a decrease in LV-PDF and an increase in LV-PRI in patients with PH compared with patients with non-PH. As ventricular anatomic structures and the patterns of blood flow are highly interdependent, the underlying mechanism is assumed to be increased RV pressure and RV dilatation resulting in higher trans-septal pressures. This causes a bowing of the interventricular septum into the LV with resultant distortion of LV geometry and function whereas an adaptive atrophy of LV cardiomyocytes caused by LV underfilling contrasts with hypertrophic RV changes in patients with PH.20 These factors may ultimately result in a decrease in LV-PDF. To maintain normal left ventricular stroke volume, myocardial work is enhanced, which leads to a compensatory increase in LV-PDE and PRI.
More and more researches focus on ventricular flow and function.9,11–13,16,19 Fredriksson et al16 reported that the RV flow components of 12 healthy people, respectively PDF = 44 ± 6%, PRI = 17 ± 3%, PDE = 15 ± 3%, and PRVo = 23 ± 6%, and Stoll, et al19 reported the LV flow components of 36 healthy people, respectively, PDF = 38 ± 4%, PRI = 16 ± 4%, PDE = 16 ± 3%, and PRVo = 30 ± 4%. In patients with non-PH, RV-PDF was substantially larger than the other 3 flow components, which was similar to Fredriksson’s findings. However, compared with those healthy subjects,16 RV-PDF in our patients with non-PH decreased whereas RV-PRI and RV-PDE increased. We speculate that there may be 2 reasons: (1) subjects in Fredriksson’s studies were healthy people whereas all of our patients with non-PH had pulmonary stenosis or occlusion although their MPAP was <25 mm Hg. (2) The right heart hemodynamics maybe have changed before the pulmonary artery pressure increased over 25 mm Hg. This phenomenon also indicates that blood flow is closely related to function. In patients with non-PH, the percentage of the 4 LV flow components was similar to the results from Stoll et al.19 LV-PDF is also the main flow component more than the other 3 flow components. In addition, PRI is comparable to PDE in the LV or the RV.
Cardiac remodeling is the most significant feature in patients with PH.21 RVESRI is a maladaptive myocardial remodeling index and strongly predicts outcomes in PAH.17 In this research, RV-PDF negatively correlated and RV-PRVo positively correlated with RVESRI. Moreover, circulating blood biomarkers such as B-type natriuretic peptide or NT-proBNP have confirmed the predictive value of right heart remodeling.22 RV-PDF negatively correlated and RV-PRVo positively correlated with NT-proBNP. Although the mechanism is unknown, these findings indicated that flow-specific component measurements could serve as markers for RV remodeling in patients with pre-PH. In contrast, we speculate the different times, at which 4D flow MRI and blood NT-proBNP were tested may be the main reason for the weak correlation between ventricular flow components and blood NT-proBNP levels. Moreover, our results indicated that RV-PDF, RV-PDE, and RV-PRI positively correlated with RVEF whereas negatively correlated with RVEDVI, RVESVI, and RV mass. In contrast, RV-PRVo increased with EDVI, ESVI, and RV mass whereas decreased with the deteriorating RVEF. These are similar to the correlation of LV flow components with LVEF reported by Stoll et al.19
PH is characterized by the increased pulmonary arterial load requiring more RV hydraulic power to sustain adequate forward blood flow. Previous studies reported that 4D flow CMR could provide a noninvasive estimate of PVR11 or MPAP9 in patients with PH. We found RV flow components, especially RV-PDF, inversely correlated with MPAP and PVR whereas RV-PRVo positively correlated with MPAP and PVR. Importantly, RV-PDF ≤11% and RV-PRVo >42% can indicate MPAP ≥25 mm Hg with higher sensitivity and specificity. To our knowledge, this study is the first to confirm the thresholds of RV blood flow components in predicting pH (MPAP ≥25 mm Hg), RV dysfunction is associated with poor prognosis in patients with PH. However, the right and LVs cannot function independently for sharing a common pericardial sac and interventricular septum. A recent study suggested that LV dysfunction might be present in patients with PH23 and LV global longitudinal strain was independently associated with death in addition to RV abnormalities.24,25 Similarly, our study indicated that, in addition to RV blood flow, LV-PDF may be a predictor of perioperative death of patients with pre-PH.
It should be noted that there are several main limitations in our current study. First, this is a single-center retrospective study, we only included a part of patients with pre-PH including CTEPH, IPAH, PAS, TA, and PCH, important limitations to consider include that the vast majority of patients had group 1 and 4 PH, so whether these findings can be extrapolated to other etiologies of pre-PH, postcapillary PH, or combined postcapillary and pre-PH, still unclear. Further work is to observe blood flow components in different etiologies of PH patients. Second, RHC is an invasive technique that is only used in patients with clinically suspected PH. As we could not obtain hemodynamics from healthy people with RHC, we only included patients with normal PAP (MPAP <25 mm Hg) as control. However, the non-PH group does not represent healthy controls. These patients have pulmonary arterial stenosis, even their normal pulmonary pressure. Even though we compared the data in non-PH with the “normal” values reported in controls in the literature, lacking ventricular flow data in a healthy control group for comparison in this research lead to the unknown normal ventricular flow state. In addition, patients with non-PH are younger than patients with pre-PH, moreover, the heart rate of patients with non-PH is slower than patients with pre-PH, which may also affect the ventricular flow. Third, more and more metrics on MRI or computed tomography have been used to evaluate PH, however, the correlation of ventricular flow with these metrics remains unknown, a comparison of computed tomography metrics such as the diameter of the main pulmonary artery, the ratio of main pulmonary artery/ascending aorta with metrics from 4D flow MRI will be analyzed in the further study. Fourth, as preoperative death is uncommon, whether flow data could be prognostic predictors of pre-PH patients or combining clinical and magnetic resonance data can better predict the outcome remains for further research. The last one, due to the limitation of software algorithms, we did not analyze the kinetic energy of each flow component, so the role of the kinetic energy of each ventricular component in PH needs further study.
In conclusion, right and left ventricular blood flow quantified from 4D flow MRI can noninvasively provide comprehensive information about the cardiopulmonary unit and may be a predictor for perioperative death for patients with pre-PH.
Footnotes
This single-center, retrospective cohort study was performed according to the Declaration of Helsinki and was approved by the Ethics Committee of our hospital (IRB No. 2022-KY-048). Informed consent from patients was waived for this retrospective study.
This work was supported by National High-Level Hospital Clinical Research Funding and Elite Medical Professionals Project of China-Japan Friendship Hospital (2022-NHLHCRF-LX-01&ZRJY2021-BJ02), Chinese Academy of Medical Sciences Innovation Fund for Medical Sciences (2021-I2M-1-049), the National Natural Science Foundation of China (81871328).
N.J. is employed by Siemens. The remaining authors declare no conflict of interest.
Contributor Information
Wenqing Xu, Email: wenqingxu2021@163.com.
Mei Deng, Email: dr_deng_7306@163.com.
Ling Zhang, Email: zhangl527@163.com.
Peiyao Zhang, Email: 15011353102@163.com.
Qian Gao, Email: gaoqian@bjmu.edu.cn.
Xincao Tao, Email: taoxincao@163.com.
Yanan Zhen, Email: jamario@163.com.
Xiaopeng Liu, Email: xiaopengl@yeah.net.
Ning Jin, Email: ning.jin@siemens-healthineers.com.
Wenhui Chen, Email: wenhuichen1004@sina.com.
Wanmu Xie, Email: xiewanmu@126.com.
Min Liu, Email: mikie0763@126.com.
REFERENCES
- 1. Galiè N, Humbert M, Vachiery JL, et al. 2015 ESC/ERS Guidelines for the diagnosis and treatment of pulmonary hypertension: the Joint Task Force for the Diagnosis and Treatment of Pulmonary Hypertension of the European Society of Cardiology (ESC) and the European Respiratory Society (ERS): endorsed by: ASSOCIATION for European Paediatric and Congenital Cardiology (AEPC), International Society for Heart and Lung Transplantation (ISHLT). Eur Respir J. 2015;46:903–975. [DOI] [PubMed] [Google Scholar]
- 2. Crowe T, Jayasekera G, Peacock AJ. Non-invasive imaging of global and regional cardiac function in pulmonary hypertension. Pulm Circ. 2018;8:2045893217742000. [DOI] [PMC free article] [PubMed] [Google Scholar]
- 3. Baillie TJ, Sidharta S, Steele PM, et al. The predictive capabilities of a novel cardiovascular magnetic resonance derived marker of cardiopulmonary reserve on established prognostic surrogate markers in patients with pulmonary vascular disease: results of a longitudinal pilot study. J Cardiovasc Magn Reson. 2017;19:3. [DOI] [PMC free article] [PubMed] [Google Scholar]
- 4. Baggen VJ, Leiner T, Post MC, et al. Cardiac magnetic resonance findings predicting mortality in patients with pulmonary arterial hypertension: a systematic review and meta-analysis. Eur Radiol. 2016;26:3771–3780. [DOI] [PMC free article] [PubMed] [Google Scholar]
- 5. Peacock AJ, Vonk Noordegraaf A. Cardiac magnetic resonance imaging in pulmonary arterial hypertension. Eur Respir Rev. 2013;22:526–534. [DOI] [PMC free article] [PubMed] [Google Scholar]
- 6. Lewandowski AJ, Raman B, Banerjee R, et al. Novel insights into complex cardiovascular pathologies using 4D flow analysis by cardiovascular magnetic resonance imaging. Curr Pharm Des. 2017;23:3262–3267. [DOI] [PubMed] [Google Scholar]
- 7. Gordon DZ, Abbasi MA, Lee J, et al. Four-dimensional flow magnetic resonance imaging quantification of blood flow in bicuspid aortic valve. J Thorac Imaging. 2020;35:383–388. [DOI] [PMC free article] [PubMed] [Google Scholar]
- 8. Odagiri K, Inui N, Hakamata A, et al. Non-invasive evaluation of pulmonary arterial blood flow and wall shear stress in pulmonary arterial hypertension with 3D phase contrast magnetic resonance imaging. Springerplus. 2016;5:1071. [DOI] [PMC free article] [PubMed] [Google Scholar]
- 9. Reiter U, Reiter G, Kovacs G, et al. Evaluation of elevated mean pulmonary arterial pressure based on magnetic resonance 4D velocity mapping: comparison of visualization techniques. PLoS One. 2013;8:e82212. [DOI] [PMC free article] [PubMed] [Google Scholar]
- 10. Reiter U, Reiter G, Fuchsjäger M. MR phase-contrast imaging in pulmonary hypertension. Br J Radiol. 2016;89:20150995. [DOI] [PMC free article] [PubMed] [Google Scholar]
- 11. Kheyfets VO, Schafer M, Podgorski CA, et al. 4D magnetic resonance flow imaging for estimating pulmonary vascular resistance in pulmonary hypertension. J Magn Reson Imaging. 2016;44:914–922. [DOI] [PMC free article] [PubMed] [Google Scholar]
- 12. Browning JR, Hertzberg JR, Schroeder JD, et al. 4D flow assessment of vorticity in right ventricular diastolic dysfunction. Bioengineering (Basel). 2017;4:E30. [DOI] [PMC free article] [PubMed] [Google Scholar]
- 13. Steding-Ehrenborg K, Arvidsson PM, Töger J, et al. Determinants of kinetic energy of blood flow in the four-chambered heart in athletes and sedentary controls. Am J Physiol Heart Circ Physiol. 2016;310:H113–H122. [DOI] [PubMed] [Google Scholar]
- 14. Alattar Y, Soulat G, Gencer U, et al. Left ventricular diastolic early and late filling quantified from 4D flow magnetic resonance imaging. Diagn Interv Imaging. 2022;103:345–352. [DOI] [PubMed] [Google Scholar]
- 15. Han QJ, Witschey WR, Fang-Yen CM, et al. Altered right ventricular kinetic energy work density and viscous energy dissipation in patients with pulmonary arterial hypertension: a pilot study using 4D flow MRI. PLoS One. 2015;10:e0138365. [DOI] [PMC free article] [PubMed] [Google Scholar]
- 16. Fredriksson AG, Zajac J, Eriksson J, et al. 4-D blood flow in the human right ventricle. Am J Physiol Heart Circ Physiol. 2011;301:H2344–H2350. [DOI] [PubMed] [Google Scholar]
- 17. Amsallem M, Sweatt AJ, Aymami MC, et al. Right heart end-systolic remodeling index strongly predicts outcomes in pulmonary arterial hypertension: comparison with validated models. Circ Cardiovasc Imaging. 2017;10:e005771. [DOI] [PMC free article] [PubMed] [Google Scholar]
- 18. Zhang L, Dai J, Zhang P, et al. Right ventricular end-systolic remodeling index on cardiac magnetic resonance imaging: comparison with other functional markers in patients with chronic thromboembolic pulmonary hypertension. Quant Imaging Med Surg. 2022;12:894–905. [DOI] [PMC free article] [PubMed] [Google Scholar]
- 19. Stoll VM, Hess AT, Rodgers CT, et al. Left ventricular flow analysis. Circ Cardiovasc Imaging. 2019;12:e008130. [DOI] [PMC free article] [PubMed] [Google Scholar]
- 20. Homsi R, Luetkens JA, Skowasch D, et al. Left Ventricular myocardial fibrosis, atrophy, and impaired contractility in patients with pulmonary arterial hypertension and a preserved left ventricular function: a cardiac magnetic resonance study. J Thorac Imaging. 2017;32:36–42. [DOI] [PubMed] [Google Scholar]
- 21. Dong Y, Pan Z, Wang D, et al. Prognostic value of cardiac magnetic resonance-derived right ventricular remodeling parameters in pulmonary hypertension: a systematic review and meta-analysis. Circ Cardiovasc Imaging. 2020;13:e010568. [DOI] [PubMed] [Google Scholar]
- 22. Vonk-Noordegraaf A, Haddad F, Chin KM, et al. Right heart adaptation to pulmonary arterial hypertension: physiology and pathobiology. J Am Coll Cardiol. 2013;62(suppl 25):D22–D33. [DOI] [PubMed] [Google Scholar]
- 23. Motoji Y, Tanaka H, Fukuda Y, et al. Interdependence of right ventricular systolic function and left ventricular filling and its association with outcome for patients with pulmonary hypertension. Int J Cardiovasc Imaging. 2015;31:691–698. [DOI] [PubMed] [Google Scholar]
- 24. Querejeta Roca G, Campbell P, Claggett B, et al. Impact of lowering pulmonary vascular resistance on right and left ventricular deformation in pulmonary arterial hypertension. Eur J Heart Fail. 2015;17:63–73. [DOI] [PMC free article] [PubMed] [Google Scholar]
- 25. Hardegree EL, Sachdev A, Fenstad ER, et al. Impaired left ventricular mechanics in pulmonary arterial hypertension: identification of a cohort at high risk. Circ Heart Fail. 2013;6:748–755. [DOI] [PubMed] [Google Scholar]


