Abstract
Microwaves (MWs) are an emerging technology for intensified and electrified chemical manufacturing. MW heating is intimately linked to a material’s dielectric permittivity. These properties are highly dependent on temperature and pressure, but such datasets are not readily available due to the limited accessibility of the current methodologies to process-oriented laboratories. We introduce a simple, benchtop approach for producing these datasets near the 2.45 GHz industrial, medical, and scientific (ISM) frequency for liquid samples. By building upon a previously-demonstrated bireentrant microwave measurement cavity, we introduce larger pressure- and temperature-capable vials to deduce temperature-dependent permittivity quickly and accurately for vapor pressures up to 7 bar. Our methodology is validated using literature data, demonstrating broad applicability for materials with dielectric constant ε' ranging from 1 to 100. We provide new permittivity data for water, organic solvents, and hydrochloric acid solutions. Finally, we provide simple fits to our data for easy use.
Subject terms: Chemical engineering, Characterization and analytical techniques
Introduction
Microwaves (MWs) are an emerging technology for chemical manufacturing. Their rapid and selective heating using renewable energy sources, like solar and wind power, can decarbonize chemical processes while enhancing performance1–8. MWs operate through dipole polarization and ionic conduction, depositing energy volumetrically and enabling selective heating based on the dielectric properties of materials9. This unique heating has been applied to various chemical processes, including organic synthesis3,10–13, catalytic reactors14,15, microfluidic processes15–17, nanoparticle synthesis18–20, polymerization reactions21,22, and reactive distillation23,24. In many such studies, the focus has been on MW-mediated process improvement or reactor design, especially as MWs expand beyond the laboratory scale25–27. Particularly, MW-assisted continuous flow is a promising process intensification and electrification technology for sustainable chemical manufacturing28.
The phenomena of MW heating are intimately linked to a material’s dielectric permittivity. The complex permittivity (ε*) of a material comprises a real part (ε′) related to polarization and stored energy, and an imaginary part (εʺ) linked to energy loss. These aspects depend on the material's structure and molecular interactions, influencing its response to external fields. As such, multiphysics simulations, such as COMSOL, have emerged for implementing MW-heated flow reactors. These simulations can optimize reactor geometry29–31, comprehend the impact of dielectric properties27,31,32, and select optimal operating experimental conditions27. This joint approach can drive remarkably high heating efficiency (> 95%)27,31 and optimal reaction performance27. The profound influence of temperature and pressure on the dielectric permittivity of various materials highlights the immediate significance of quantifying properties across temperatures33–35. Regrettably, detailed datasets are not available.
The measurement of liquid-phase dielectric permittivity at elevated temperatures poses technical challenges as elevated pressures must be accommodated to prevent boiling. Previous approaches involved constructing specialized steel pressure vessels for measuring the dielectric constant (ε′), but many of these systems could not capture the complex permittivity (they neglect the dielectric loss factor εʺ)36–38. Dimitrakis and coworkers demonstrated a great traceable measurement system for complex dielectric permittivity in liquids at high temperatures and pressures, utilizing a dedicated vector network analyzer (VNA) and a custom high-pressure adapter for the coaxial line35. Such an approach yields measurements over a large frequency range (30 kHz to 6 GHz), but the equipment is uncommon in process-oriented laboratories. The unavailability of datasets for MW heating simulations arguably stems from a disparity between the necessary equipment and the familiarity with or access to such equipment by MW practitioners. Gutierrez-Cano39 and coworkers report a benchtop standalone dielectric measurement kit that partly addresses this gap enabling easy room temperature, open-to-atmosphere measurements at MW-relevant frequencies ranging from 1.5 to 2.6 GHz39.
In this study, we present an extension to the benchtop dielectric measurement kit described by Gutierrez-Cano39 that enables pressurization and temperature resolution to rapidly acquire the temperature-dependent complex dielectric permittivity near the 2.45 GHz ISM frequency relevant to MW heating.
Methods
The experimental setup employed in this study is a modified system39, an autonomous system capable of acquiring dielectric properties of materials near the 2.45 GHz ISM band. This design allows convenient measurement of materials inside tubes, particularly suitable for liquids, semisolids, powders, and granular materials. The MW structure is based on a single-post re-entrant cavity40, CNC-machined from aluminum (± 5 µm precision), and featuring an open port on the top cover to accommodate the tubes along the central axis of the cell. The measurement procedure relies on the precise measurement of the MW cavity’s reflection or impedance to determine the resonant frequency and quality factor and the subsequent use of the resonance parameters to calculate the dielectric properties of the material from a rigorous numerical method39. Permittivity characterization with MW cavities is typically restricted to low-loss materials41. However, high-coupling networks enable measurements of both low-loss and high-loss materials using the same experimental setup. To streamline and simplify the measurement process, the device includes a tailor-made MW reflectometer, which assesses the MW cavity's reflection coefficient, eliminating the need for a full-featured VNA.
The developed electromagnetic (EM) numerical method of the MW cavity to calculate the dielectric properties of the materials made use of circuit analysis and mode-matching techniques42, as described in detail in previous work39. This technique involves decomposing the complex MW cavity into simpler canonical circuits, which are analyzed and computed independently and then connected to assemble the complete structure. The relationship between the complex resonance frequency (resonant frequency and quality factor) and complex permittivity (dielectric constant and loss factor) is solved by applying the resonance condition to the numerical response of the MW cavity. Unlike other dielectric properties measurement methods, such as the cavity perturbation methods (CPM), the approach described in reference39 does not require calibration with reference materials. We refer readers to our previous demonstration of such a system for a full description39 and that we build upon here.
In the previous setup, commercial Pyrex tubes were utilized to house the materials. However, the permittivity of Pyrex is highly temperature-dependent43. As the temperature rises, the resonance measurement becomes influenced by both the changes in material permittivity and the variations in the tube's permittivity. This interplay complicates the development of an accurate EM model and its practical implementation. On the other hand, while the small size of the Pyrex tubes facilitates the use of minimal sample quantities, it limits the incorporation of external elements for high-pressure containment or atmospheric control. To overcome these limitations, an upgraded MW cavity has been developed to accommodate more convenient larger tubes, with the dimensions of the tubes and cavity described in Fig. 1. These tubes are crafted from materials like quartz and alumina, which exhibit more consistent permittivity across different temperatures44,45.
Figure 1.
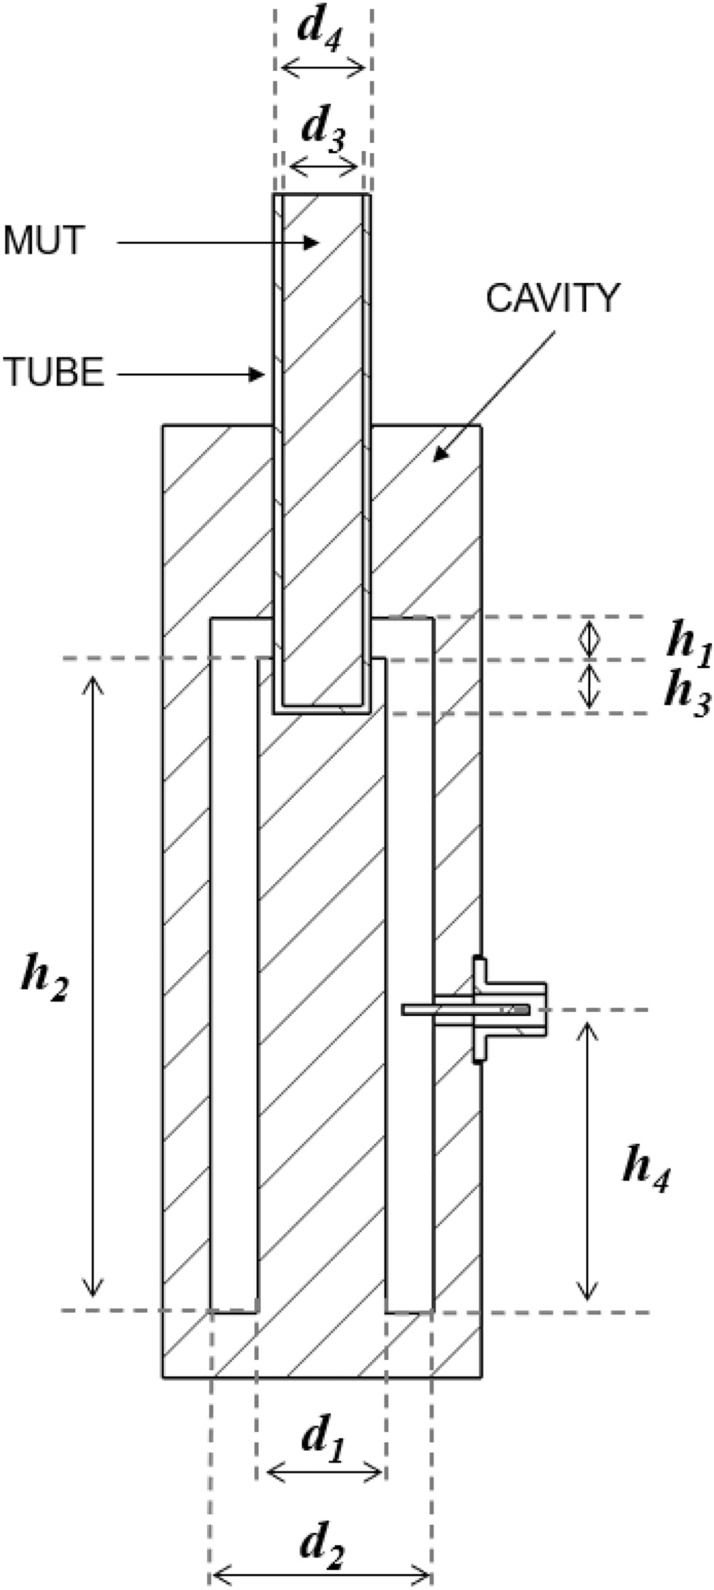
Cross-section of the designed bireentrant MW cavity, tube, and material under test (“MUT”) with dimensions h1 = 5 mm, h2 = 82 mm, h3 = 6 mm, h4 = 41 mm, d1 = 16.1 mm, d2 = 28 mm, d3 = 10 mm, and d4 = 12 mm.
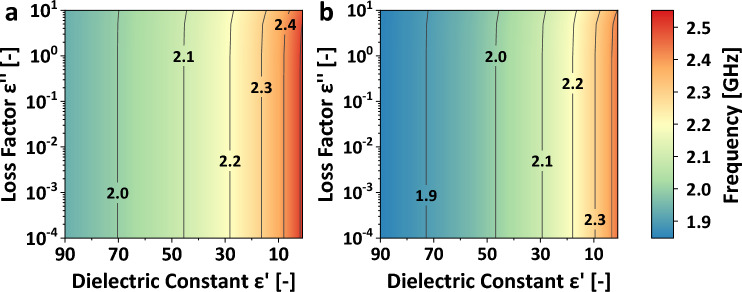
An EM numerical model was developed in MATLAB and employed to ascertain the optimal dimensions of the bireentrant resonator, aiming to achieve a sensitivity level comparable to that of the Pyrex tube version, attaining a single resonant mode encompassing the operational range of the MW reflectometer, spanning from 1.5 to 2.6 GHz. Figure 1 depicts a cross-sectional view of the resonant geometry and the dimensions. The relationship between the permittivity and the resonant frequency of the resulting bireentrant MW structure is shown in Fig. 2. Figure 2a illustrates the frequency shift of the cavity loaded with quartz tubes, and Fig. 2b corresponds to the frequency variation using alumina tubes. The resonance frequencies of the cavity using alumina tubes for the same dielectric material are lower than those using quartz tubes, attributed to the higher dielectric constant of alumina. Nevertheless, in both cases, a maximum frequency shift of approximately 600 MHz is achieved for materials with a dielectric constant ranging from 1 to 100, like the frequency shift obtained with the Pyrex tubes in the original bireentrant setup39.
Figure 2.
Frequency shift as a function of permittivity for the designed bireentrant cavity. (a) Dielectric materials enclosed in quartz tubes and (b) dielectric materials inside alumina tubes. Contours are placed at 0.1 GHz frequency increments.
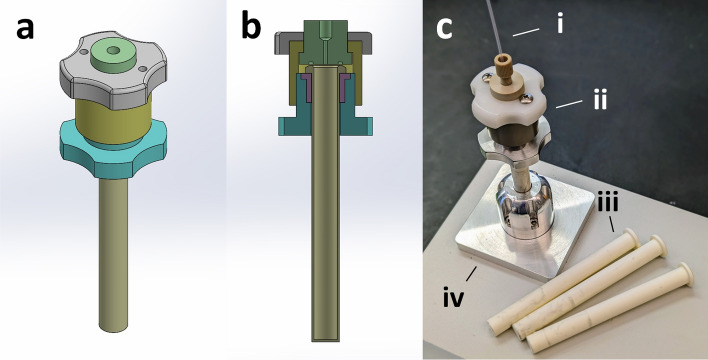
The described MW setup allows for flexible sample handling. A vessel was then developed to facilitate high-pressure containment of liquid samples at elevated temperatures while still allowing for accurate measurement of dielectric permittivity. To maintain permittivity uncertainties within a 2% margin for the dielectric constant and a 5% margin for the loss factor, the uncertainty associated with the internal diameter of the tube, with respect to the nominal value used in the model, was determined to be ± 20 µm39. The pressure–temperature-dielectric (PTD) vessel is illustrated in Fig. 3 and fulfills the requirements as follows: Alumina vials (Fig. 3c(iii)) are designed to fit the access hole of the bireentrant cavity (iv) and are equipped with a flanged top for sealing via an o-ring fixture. A threaded assembly (ii) ensures pressure containment within the vessel. Additionally, a temperature-sensing optical fiber (i) with a silica cladding is inserted and sealed within the vial using soft ETFE ferrules, as described in prior work31,46. Specific dimensions of the alumina vial are offered in Fig. S1. The PTD vessel is heated to a predetermined temperature using an external heating block, after which it is transferred to the cavity. As the vessel cools, permittivity-temperature data points are collected. Throughout this process, the pressure changes to reflect the vapor pressure of the solvent at each temperature. We do not expect this to affect the measurements for sub-critical liquids as demonstrated by Dimitrakis and coworkers35 who showed no difference in the permittivity for alcohols at pressures ranging from 1 to 60 bar.
Figure 3.
Depiction of the PTD vessel. The external (a) and internal cross section (b) views of the vessel are shown as designed for machining, illustrating the simplicity of the approach. A photograph of the vessel (c) with the temperature-sensing optical fibers (i), screw-topped sealing fixture (ii), alumina vials (iii), and the cavity access hole (iv).
Results and discussion
Validation of permittivity measurements
Although the MW setup can operate with both quartz or alumina tubes which result in nearly identical measurements (Fig. S2), quartz tubes are limited to near atmospheric pressures. This study focuses on alumina vials since they have superior pressure resistance and can reliably be used up to 7 bar, providing access to wider temperature ranges for liquid permittivity measurements.
To validate the temperature measurement scheme, the dielectric permittivity of ultrapure water was measured from 20 to 160 °C. While some references in the literature report water permittivity up to 100 °C33,34, the frequency at which they provide the permittivity values is significantly different. This discrepancy hinders the proper comparison of permittivity values due to the strong dependency of permittivity with frequency for polar materials47. Then the measured permittivity was compared to the values given by the Debye-type relaxation spectral function provided by Kaatze48, allowing the calculation of the permittivity of water as a function of frequency and temperature up to 60 °C. Figure 4 compares our measurements taken at 1.85 GHz to the permittivity values obtained from Kaatze's Debye model at the same frequency. Our experimental results align remarkably well with those values throughout the entire temperature range of the reference48. This agreement in data demonstrates the successful efficacy of our temperature measurement scheme in accurately capturing the temperature-dependent dielectric permittivity.
Figure 4.
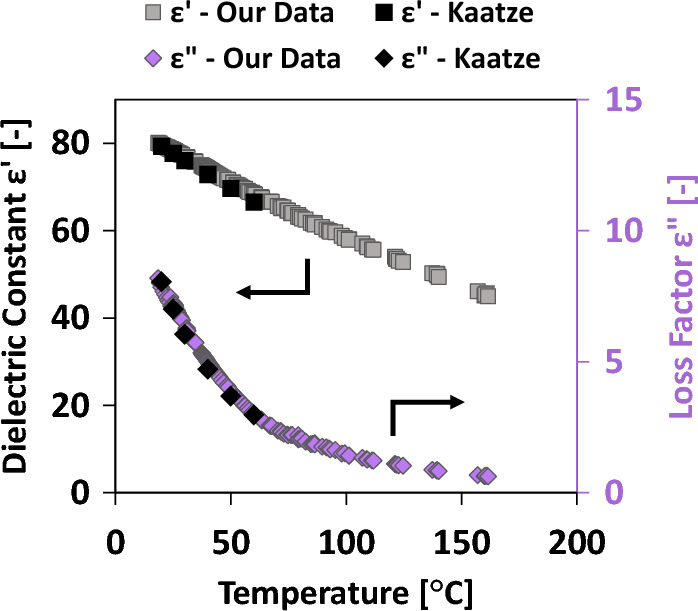
Temperature-dependent dielectric permittivity of water. Comparison of literature values with measurements made using alumina vials. Square symbols represent ε′ values (left axis) while diamond symbols represent εʺ values (right axis).
To demonstrate the efficacy of alumina vials for measuring various solvents across a wide range of ε′ values, we conducted room temperature dielectric constant measurements as depicted in Fig. 5. We compare our experimental results to literature values obtained from different sources (refer to Table S1 for details). Notably, certain solvents exhibit a significant ε' variation depending on the measurement frequency according to literature data (namely alcohols). After accounting for this, the agreement between our experimental measurements and the reported literature values is excellent (an average of 5.8% relative error) across the entire ε' range of approximately 1 to 100. Unfortunately, literature data for solvents at elevated temperatures and the same frequency as our measurements are lacking, so additional comparisons cannot be made.
Figure 5.
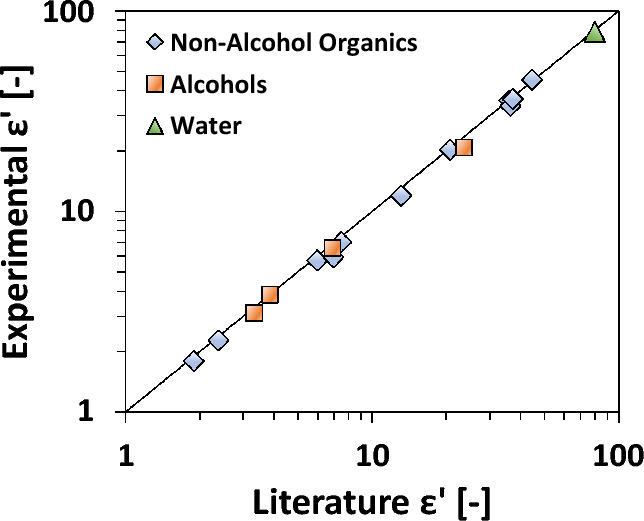
Parity of measured and literature ε′ values for various solvents at room temperature utilizing the alumina PTD vessel. Including data from references49–59.
In comparison to the most contemporary approach35, our experimental setup does not require a full-featured VNA, an HPLC pump, a dedicated temperature controller, or a customized high-pressure adapter for the coaxial line. Rather, temperature is continuously monitored internally in the alumina vial which is placed on a hot plate for heating and then removed and placed into the measurement cell at the desired time. This process can be repeated quickly for various liquid samples, and the experimental data presented in this work was collected in a single day. However, our approach can only reach moderate pressures (~ 7 bar) with the current design which can limit the accessible temperature range. Furthermore, our method does not allow for traceable measurements which may be important given the sensitivity to frequency exhibited by certain compounds. The low experimental variance in our measurements also represents an improvement, possibly owing to our seal placement scheme which avoids the introduction of geometric changes to the measurement cell upon pressurization35.
Dielectric permittivity of non-alcohol organic solvents
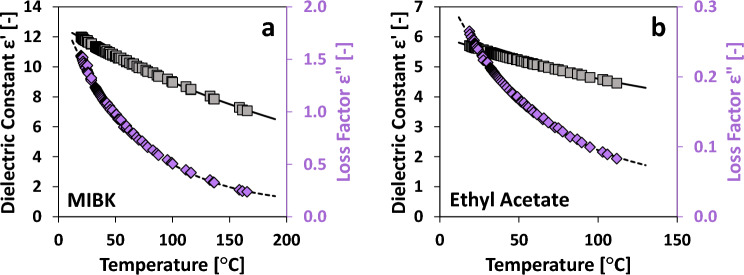
We tested a variety of organic solvents to investigate their temperature-dependent permittivity behavior and establish a small repository of such data. Most solvents generally exhibit a consistent, monotonic decrease in both ε' and ε" as temperature increases. Figure 6a and Fig. 6b showcase this trend with representative examples of MIBK and ethyl acetate permittivity. For such cases, a straightforward three-parameter exponential fit, as presented in Eq. (1), provides an accurate, empirical model of permittivity across the entire range of measured temperatures.
| 1 |
Figure 6.
Sample permittivity profiles for MIBK (a) and ethyl acetate (b). Grey squares represent ε′ (left axis) while purple diamonds represent εʺ (right axis). Solid and dashed lines represent the exponential fits for ε′ and εʺ data, respectively.
Here, A1, A2, and A3 are the regressed parameters, T is the measured temperature [°C], and ε is either the real or imaginary component of the dielectric permittivity. The temperature-dependent permittivity data for each non-alcohol organic solvent is listed in Figs. S3 and S4, while the regressed parameters A1, A2, and A3 from Eq. (1) are available for each solvent in Table 1. The standard error of the fitted Eq. (1) for each solvent is less than 3% in all cases. The suitable temperature range for each solvent was chosen to limit the vapor pressure to 7 bar for safe operation.
Table 1.
Regressed parameters for non-alcohol organic solvents fitted to Eq. (1).
| Solvent | Dielectric constant ε′ [–] | Loss factor εʺ [–] | TMAX | ||||||
|---|---|---|---|---|---|---|---|---|---|
| A1 | A2 | A3 | Error | A1 | A2 | A3 | Error | ||
| MIBK | 12.801 | − 0.003555 | 0.000 | 0.5% | 1.908 | − 0.015495 | 0.095 | 1.9% | 165.4 |
| Tetrahydrofuran | 7.089 | − 0.003233 | 0.326 | 0.3% | 0.219 | − 0.012762 | 0.025 | 1.0% | 135.4 |
| γ-Valeractone | 35.766 | − 0.001980 | 0.000 | 1.9% | 12.924 | − 0.017054 | 1.041 | 2.6% | 185.3 |
| DMSO | 48.082 | − 0.002262 | 0.000 | 0.9% | 14.008 | − 0.019674 | 1.223 | 1.4% | 179.0 |
| Dimethylformamide | 29.870 | − 0.005903 | 9.803 | 0.3% | 5.954 | − 0.017535 | 0.481 | 1.7% | 186.6 |
| Ethyl acetate | 3.537 | − 0.005128 | 2.484 | 0.1% | 0.299 | − 0.017324 | 0.042 | 0.9% | 111.8 |
| Acetonitrile | 33.160 | − 0.004736 | 5.434 | 0.2% | 1.737 | − 0.014391 | 0.207 | 0.6% | 133.8 |
| 2 m-THF | 4.642 | − 0.004662 | 1.673 | 0.2% | 0.289 | − 0.014894 | 0.024 | 0.8% | 145.2 |
| Acetone | 22.997 | − 0.004106 | − 0.936 | 0.3% | 1.036 | − 0.013575 | 0.059 | 0.8% | 115.4 |
The standard error relative to the mean is reported for each parameter set along with the maximum temperature measured for each solvent.
Dielectric permittivity of alcohols
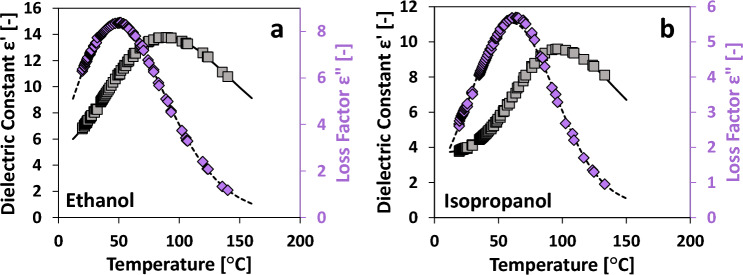
The permittivity of alcohols displays a nonmonotonic dependence on temperature35,60. As temperature increases, so do ε′ and εʺ until the trend is reversed at some point and ε′ and εʺ decrease with further increments of temperature. This effect is highlighted in Fig. 7a and Fig. 7b where ethanol and isopropanol permittivity are displayed. In these cases, a modified lognormal fit is used with a total of 6 regressed parameters as shown in Eq. (2)
| 2 |
where B1, B2, B3, B4, σ, and µ are the regressed parameters. In this case, σ and µ are the traditional descriptors of a lognormal fit while B1, B2, B3, and B4 allow x-axis and y-axis stretching and offset. The temperature-dependent permittivity data for each alcohol are listed in Fig. S5, while the regressed parameters B1, B2, B3, B4, σ, and µ from Eq. (2) are available for each solvent in Table 2. The standard error of the fitted Eq. (2) for each solvent is less than 3.5% in all cases.
Figure 7.
Sample permittivity profiles for ethanol (a) and isopropanol (b). Grey squares represent ε′ (left axis) while purple diamonds represent εʺ (right axis). Solid and dashed lines represent the lognormal fits for ε′ and εʺ data, respectively.
Table 2.
Regressed parameters for alcohols fitted to Eq. (2).
| Solvent | B1 | B2 | B3 | B4 | σ | µ | Error | TMAX |
|---|---|---|---|---|---|---|---|---|
| Dielectric constant ε′ [–] | ||||||||
| Ethanol | 112.82 | 169.75 | 6.846 | 5.167 | 0.23079 | 0.25746 | 0.6% | 140.0 |
| Methanol | 17.572 | 195.77 | 36.847 | 0.8127 | 1.01634 | 0.00305 | 0.2% | 111.5 |
| Isopropanol | 89.533 | 137.39 | 4.275 | 3.681 | 0.20388 | 0.35941 | 0.8% | 133.0 |
| 2-Pentanol | 27.006 | 108.26 | 3.239 | 3.102 | 0.33902 | 0.30006 | 1.1% | 172.1 |
| Loss factor εʺ [–] | ||||||||
| Ethanol | 177.08 | 193.78 | 4.516 | 0.106 | 0.17261 | 0.17374 | 1.0% | 140.0 |
| Methanol | 315.885 | 754.41 | 2645.101 | 0.0000 | 0.53719 | -2.59687 | 0.8% | 111.5 |
| Isopropanol | 561.926 | 324.10 | 1.352 | 0.317 | 0.05364 | 0.65545 | 2.6% | 133.0 |
| 2-Pentanol | 313.805 | 288.81 | 0.752 | 0.109 | 0.08754 | 0.27231 | 3.4% | 172.1 |
The standard error relative to the mean is reported for each parameter set along with the maximum temperature measured for each solvent.
Dielectric permittivity of aqueous hydrochloric acid solutions
Next, we measured permittivity of water and hydrochloric acid solutions of various strengths. Figure 8a shows the permittivity for a continuum of HCl solutions ranging from pH 7 to 1. ε′ for pure water descends monotonically with temperature. Up to pH ≈ 1.6, HCl addition has little effect on εʺ. However, for stronger and stronger HCl solutions, smaller and smaller ε' drops are observed with increasing temperature. Finally, at pH 1, ε′ increases with increasing temperature. ε′ at room temperature decreases slightly by lowering pH. In Fig. 8b, εʺ is reported for the same solutions. HCl addition monotonically increases εʺ—even at room temperature. As HCl is added, the decrease in εʺ with temperature is less prominent until pH 2, where increases in temperature cause increases in εʺ. This behavior in which ionic concentration changes the temperature effect on permittivity has not been previously reported to our knowledge.
Figure 8.
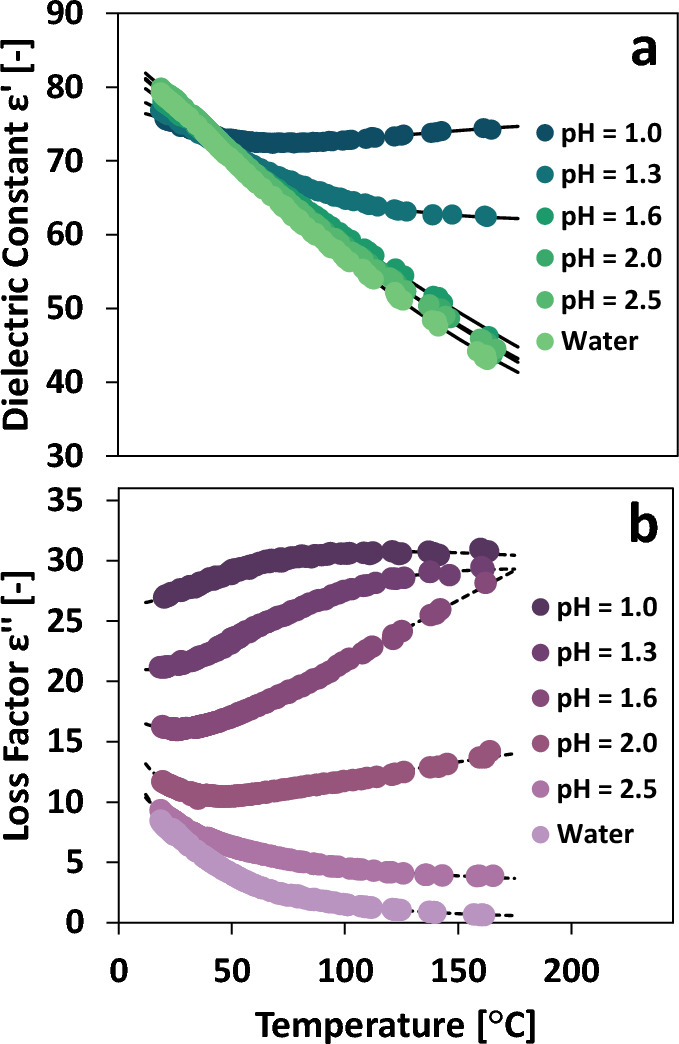
Temperature-dependent dielectric permittivity of hydrochloric acid solutions including dielectric constant (a) and loss factor (b).
The permittivity data for HCl solutions is fitted using Eq. (2). The regressed parameters for each HCl solution are presented in Table 3. In each case, the standard error of the fitted Eq. (2) is less than 4%.
Table 3.
Regressed parameters for HCl solutions fitted to Eq. (2).
| Solution | B1 | B2 | B3 | B4 | σ | µ | Error | TMAX |
|---|---|---|---|---|---|---|---|---|
| Dielectric constant ε′ [–] | ||||||||
| Water | 328.07 | 440.42 | 50.052 | 20.425 | 0.4137 | − 0.35783 | 0.3% | 161.5 |
| pH 2.5 | 100.153 | 251.06 | 133.19 | 0.4520 | 1.1311 | 0.00290 | 0.2% | 165.4 |
| pH 2.0 | 257.88 | 527.20 | 64.293 | 4.604 | 0.6550 | − 0.63567 | 0.3% | 164.0 |
| pH 1.6 | 254.28 | 437.25 | 103.07 | − 4.812 | 0.7801 | − 0.32871 | 0.2% | 162.1 |
| pH 1.3 | 170.802 | 93.591 | 22.15 | 61.793 | 0.2754 | 0.61419 | 0.2% | 161.3 |
| pH 1.0 | 3.389 | 100.943 | − 7.424 | 76.750 | 0.7132 | 0.21673 | 0.1% | 163.3 |
| Loss factor εʺ [–] | ||||||||
| Water | 76.014 | 84.415 | 61.390 | 0.24264 | 0.8689 | − 1.1598 | 3.0% | 161.5 |
| pH 2.5 | 37.13 | 10,586.3 | 2630.04 | 2.4934 | 13.5644 | − 58.4632 | 1.1% | 165.4 |
| pH 2.0 | 5.0850 | 253.13 | − 37.596 | 23.493 | 1.6017 | 0.9550 | 0.7% | 164.0 |
| pH 1.6 | 49.807 | 765.6 | − 177.51 | 93.607 | 1.8130 | 0.9576 | 0.3% | 162.1 |
| pH 1.3 | − 0.12798 | 246.07 | 15.783 | 20.938 | 0.7880 | 0.2661 | 0.4% | 161.3 |
| pH 1.0 | − 0.12801 | 218.71 | 8.8847 | 26.337 | 0.9260 | 0.2853 | 0.3% | 163.3 |
The standard error relative to the mean is reported for each parameter set along with the maximum temperature measured for each solvent.
Conclusions
We demonstrate a simple benchtop approach for evaluating temperature-dependent dielectric permittivity near the 2.45 GHZ ISM frequency, constituting a substantial simplification of existing equipment and ease of use. By building upon the existing benchtop standalone dielectric measurement kit with larger, easier-to-use vials, a simple pressurization scheme was implemented. Improvements in vial materials were also made by tuning the electromagnetic model for quartz and alumina tubes, which exhibit less sensitivity of dielectric permittivity to temperature. Ultimately, liquids can be heated via a hotplate to temperatures significantly above their boiling point and up to 7 bar, and the pressurized and heated vial can be transferred to the measurement cavity for permittivity evaluation. The methodology was validated using the known temperature-dependent permittivity of water and the room temperature permittivity of various solvents. Excellent agreement with the literature data was demonstrated.
We then report the permittivity of water, alcohols, organic solvents, and hydrochloric acid solutions across temperatures up to 7 bar of vapor pressure. While water and non-alcohol organic solvents display monotonic decreases in ε′ and εʺ with increasing temperatures, more surprising behavior emerges for other compounds. Alcohols seemingly share a separate behavior in which ε′ and εʺ increase to a maximum and then decrease with increasing temperature. Hydrochloric acid solutions also exhibit non-monotonic behavior which changes across pH values. Based on the permittivity behavior for the various categories of liquids, exponential and lognormal fits were provided.
Supplementary Information
Acknowledgements
Funding from the RAPID manufacturing institute, supported by the Department of Energy (DOE) Advanced Manufacturing Office (AMO), Award Numbers DE-EE0007888-7.6 is gratefully acknowledged. RAPID projects at the University of Delaware are also made possible partly by funding provided by the State of Delaware. The Delaware Energy Institute gratefully acknowledges the support and partnership of the State of Delaware in furthering the essential scientific research being conducted through the RAPID projects.
Author contributions
M.B.F. implemented the pressure-temperature-dielectric device, performed the experiments, and analyzed the data. J.M.C.C. performed the modeling, implemented the updated dielectric measurement kit, and analyzed the data. All authors co-conceptualized the work and jointly wrote the manuscript.
Data availability
The datasets used and/or analyzed during the current study are available from the corresponding author upon reasonable request.
Competing interests
The authors declare no competing interests.
Footnotes
Publisher's note
Springer Nature remains neutral with regard to jurisdictional claims in published maps and institutional affiliations.
Supplementary Information
The online version contains supplementary material available at 10.1038/s41598-023-45049-8.
References
- 1.Gao X, Liu X, Yan P, Li X, Li H. Numerical analysis and optimization of the microwave inductive heating performance of water film. Int. J. Heat Mass Transf. 2019;139:17–30. doi: 10.1016/j.ijheatmasstransfer.2019.04.122. [DOI] [Google Scholar]
- 2.Kappe CO. Unraveling the mysteries of microwave chemistry using silicon carbide reactor technology. Acc. Chem. Res. 2013;46:1579–1587. doi: 10.1021/ar300318c. [DOI] [PubMed] [Google Scholar]
- 3.Tao Y, et al. Direct measurement of the selective microwave-induced heating of agglomerates of dipolar molecules: The origin of and parameters controlling a microwave specific superheating effect. J. Phys. Chem. B. 2021;125:2146–2156. doi: 10.1021/acs.jpcb.0c10291. [DOI] [PubMed] [Google Scholar]
- 4.Li H, Liu J, Li X, Gao X. Microwave-induced polar/nonpolar mixture separation performance in a film evaporation process. AIChE J. 2019;65:745–754. doi: 10.1002/aic.16436. [DOI] [Google Scholar]
- 5.Robinson J, et al. Electromagnetic simulations of microwave heating experiments using reaction vessels made out of silicon carbide. Phys. Chem. Chem. Phys. 2010;12:10793–10800. doi: 10.1039/c0cp00080a. [DOI] [PubMed] [Google Scholar]
- 6.Motasemi F, Afzal MT. A review on the microwave-assisted pyrolysis technique. Renew. Sustain. Energy Rev. 2013;28:317–330. doi: 10.1016/j.rser.2013.08.008. [DOI] [Google Scholar]
- 7.Parvez AM, et al. Conventional and microwave-assisted pyrolysis of gumwood: A comparison study using thermodynamic evaluation and hydrogen production. Fuel Process. Technol. 2019;184:1–11. doi: 10.1016/j.fuproc.2018.11.007. [DOI] [Google Scholar]
- 8.Musho TD, Wildfire C, Houlihan NM, Sabolsky EM, Shekhawat D. Study of Cu2O particle morphology on microwave field enhancement. Mater. Chem. Phys. 2018;216:278–284. doi: 10.1016/j.matchemphys.2018.05.059. [DOI] [Google Scholar]
- 9.Kappe CO. How to measure reaction temperature in microwave-heated transformations. Chem. Soc. Rev. 2013;42:4977–4990. doi: 10.1039/c3cs00010a. [DOI] [PubMed] [Google Scholar]
- 10.Dundas AA, et al. Methodology for the synthesis of methacrylate monomers using designed single mode microwave applicators. React. Chem. Eng. 2019;4:1472–1476. doi: 10.1039/C9RE00173E. [DOI] [Google Scholar]
- 11.Öhrngren P, et al. Evaluation of a nonresonant microwave applicator for continuous-flow chemistry applications. Org. Process. Res. Dev. 2012;16:1053–1063. doi: 10.1021/op300003b. [DOI] [Google Scholar]
- 12.Wilson NS, Sarko CR, Roth GP. Development and applications of a practical continuous flow microwave cell. Org. Process. Res. Dev. 2004;8:535–538. doi: 10.1021/op034181b. [DOI] [Google Scholar]
- 13.Choedkiatsakul I, Ngaosuwan K, Assabumrungrat S, Mantegna S, Cravotto G. Biodiesel production in a novel continuous flow microwave reactor. Renew Energy. 2015;83:5–29. doi: 10.1016/j.renene.2015.04.012. [DOI] [Google Scholar]
- 14.Julian I, Ramirez H, Hueso JL, Mallada R, Santamaria J. Non-oxidative methane conversion in microwave-assisted structured reactors. Chem. Eng. J. 2019;377:119764. doi: 10.1016/j.cej.2018.08.150. [DOI] [Google Scholar]
- 15.He P, Haswell SJ, Fletcher PDI. Microwave heating of heterogeneously catalysed Suzuki reactions in a micro reactor. Lab. Chip. 2004;4:38–41. doi: 10.1039/b313057f. [DOI] [PubMed] [Google Scholar]
- 16.Rodriguez A, Juan A, Gómez MV, Moreno A, de La Hoz A. Continuous-flow microliter microwave irradiation in the synthesis of isoxazole derivatives: An optimization procedure. Synthesis. 2012;44:2527–2530. doi: 10.1055/s-0031-1290944. [DOI] [Google Scholar]
- 17.Ahmed B, Barrow D, Wirth T. Enhancement of reaction rates by segmented fluid flow in capillary scale reactors. Adv. Synth. Catal. 2006;348:1043–1048. doi: 10.1002/adsc.200505480. [DOI] [Google Scholar]
- 18.Baghbanzadeh M, Carbone L, Cozzoli PD, Kappe CO. Microwave-assisted synthesis of colloidal inorganic nanocrystals. Angew. Chem. Int. Ed. 2011 doi: 10.1002/anie.201101274. [DOI] [PubMed] [Google Scholar]
- 19.Manno R, Sebastian V, Mallada R, Santamaria J. 110th anniversary: Nucleation of Ag nanoparticles in helical microfluidic reactor: Comparison between microwave and conventional heating. Ind. Eng. Chem. Res. 2019;58:12702–12711. doi: 10.1021/acs.iecr.9b01460. [DOI] [Google Scholar]
- 20.Saleem Q, et al. Microwave-promoted continuous flow systems in nanoparticle synthesis: A perspective. ACS Sustain. Chem. Eng. 2021;9:9988–10015. doi: 10.1021/acssuschemeng.1c02695. [DOI] [Google Scholar]
- 21.Kalamiotis A, Ilchev A, Irvine DJ, Dimitrakis G. Optimised use of dielectric spectroscopy at microwave frequencies for direct online monitoring of polymerisation reactions. Sens. Actuators B Chem. 2019;290:34–40. doi: 10.1016/j.snb.2019.03.120. [DOI] [Google Scholar]
- 22.Hayden S, Studentschnig AFH, Schober S, Kappe CO. A critical investigation on the occurrence of microwave effects in emulsion polymerizations. Macromol. Chem. Phys. 2014;215:2318–2326. doi: 10.1002/macp.201400279. [DOI] [Google Scholar]
- 23.Li H, et al. Breaking the equilibrium at the interface: Microwave-assisted reactive distillation (MARD) React. Chem. Eng. 2019;4:688–694. doi: 10.1039/C8RE00254A. [DOI] [Google Scholar]
- 24.Werth K, et al. A systematic investigation of microwave-assisted reactive distillation: Influence of microwaves on separation and reaction. Chem. Eng. Process. Process. Intens. 2015;93:87–97. doi: 10.1016/j.cep.2015.05.002. [DOI] [Google Scholar]
- 25.Morschhäuser R, et al. Microwave-assisted continuous flow synthesis on industrial scale. Green Process. Synth. 2012;1:281–290. [Google Scholar]
- 26.Julian I, et al. From bench scale to pilot plant: A 150x scaled-up configuration of a microwave-driven structured reactor for methane dehydroaromatization. Catal. Today. 2022;383:21–30. doi: 10.1016/j.cattod.2021.04.013. [DOI] [Google Scholar]
- 27.Baker-Fales M, Chen TY, Vlachos DG. Scale-up of microwave-assisted, continuous flow, liquid phase reactors: Application to 5-hydroxymethylfurfural production. Chem. Eng. J. 2023;454:139985. doi: 10.1016/j.cej.2022.139985. [DOI] [Google Scholar]
- 28.Chen TY, et al. Microflow chemistry and its electrification for sustainable chemical manufacturing. Chem. Sci. 2022;13:10644–10685. doi: 10.1039/D2SC01684B. [DOI] [PMC free article] [PubMed] [Google Scholar]
- 29.Damilos S, Radhakrishnan ANP, Dimitrakis G, Tang J, Gavriilidis A. Experimental and computational investigation of heat transfer in a microwave-assisted flow system. Chem. Eng. Process. Process Intens. 2019;142:107537. doi: 10.1016/j.cep.2019.107537. [DOI] [Google Scholar]
- 30.Zhang Y, et al. Continuous flow microwave system with helical tubes for liquid food heating. J. Food Eng. 2021;294:110409. doi: 10.1016/j.jfoodeng.2020.110409. [DOI] [Google Scholar]
- 31.Chen TY, Baker-Fales M, Vlachos DG. Operation and optimization of microwave-heated continuous-flow microfluidics. Ind. Eng. Chem. Res. 2020;59:10418–10427. doi: 10.1021/acs.iecr.0c01650. [DOI] [Google Scholar]
- 32.Yokozawa S, et al. Development of a highly efficient single-mode microwave applicator with a resonant cavity and its application to continuous flow syntheses. RSC Adv. 2015;5:10204–10210. doi: 10.1039/C4RA12428F. [DOI] [Google Scholar]
- 33.Sturm GSJ, Verweij MD, Van Gerven T, Stankiewicz AI, Stefanidis GD. On the effect of resonant microwave fields on temperature distribution in time and space. Int. J. Heat Mass Transf. 2012;55:3800–3811. doi: 10.1016/j.ijheatmasstransfer.2012.02.065. [DOI] [Google Scholar]
- 34.Zahn M, Ohki Y, Fenneman DB, Gripshover RJ, Gehman VH. Dielectric properties of water and water/ethylene glycol mixtures for use in pulsed power system design. Proc. IEEE. 1986;74:1182–1221. doi: 10.1109/PROC.1986.13611. [DOI] [Google Scholar]
- 35.Dimitrakis GA, et al. A system for traceable measurement of the microwave complex permittivity of liquids at high pressures and temperatures. Meas. Sci. Technol. 2009;20:045091. doi: 10.1088/0957-0233/20/4/045901. [DOI] [Google Scholar]
- 36.Akerlof GC, Oshry HI. The dielectric constant of water at high temperatures and in equilibrium with its vapor. J. Am. Chem. Soc. 1950;72:045901. doi: 10.1021/ja01163a006. [DOI] [Google Scholar]
- 37.Franck EU, Deul R. Dielectric behaviour of methanol and related polar fluids at high pressures and temperatures. Faraday Discuss. Chem. Soc. 1978;66:191–198. doi: 10.1039/dc9786600191. [DOI] [Google Scholar]
- 38.Buback M, Harder WD. Static dielectric constant of ammonia to high pressures and temperatures: 1. Computer assisted data evaluation. Phys. Chem. Chem. Phys. 1977;81:603–609. [Google Scholar]
- 39.Gutierrez-Cano JD, et al. A new stand-alone microwave instrument for measuring the complex permittivity of materials at microwave frequencies. IEEE Trans. Instrum. Meas. 2020;69:3595–3605. doi: 10.1109/TIM.2019.2941038. [DOI] [Google Scholar]
- 40.Xi W, Tinga WR, Voss WAG, Tian BQ. New results for coaxial re-entrant cavity with partially dielectric filled gap. IEEE Trans. Microw. Theory Tech. 1992;40:747–753. doi: 10.1109/22.127525. [DOI] [Google Scholar]
- 41.Clarke R, et al. A Guide to Characterisation of Dielectric Materials at RF and Microwave Frequencies. Institute of Measurement and Control; 2003. [Google Scholar]
- 42.Felipe, L. & Jose, M. Circuital analysis of cylindrical structures applied to the electromagnetic resolution of resonant cavities. in Passive Microwave Components and Antennas (2010). 10.5772/9400.
- 43.García-Baños B, Reinosa JJ, Peñaranda-Foix FL, Fernández JF, Catalá-Civera JM. Temperature assessment of microwave-enhanced heating processes. Sci. Rep. 2019;9:10809. doi: 10.1038/s41598-019-47296-0. [DOI] [PMC free article] [PubMed] [Google Scholar]
- 44.Chen, L. Y. Dielectric performance of a high purity HTCC alumina at high temperatures: A comparison study with other polycrystalline alumina. in International Conference and Exhibition on High Temperature Electronics, HiTEC 2014 (2014). 10.4071/hitec-wp26.
- 45.Zhou Y, Li E, Guo G, Gao Y, Yang T. Broadband complex permittivity measurement of low loss materials over large temperature ranges by stripline resonator cavity using segmentation calculation method. Progress Electromagn. Res. 2011;113:143–160. doi: 10.2528/PIER10112402. [DOI] [Google Scholar]
- 46.Chen T-Y, Baker-Fales M, Goyal H, Vlachos DG. Microwave heating-induced temperature gradients in liquid-liquid biphasic systems. Ind. Eng. Chem. Res. 2022 doi: 10.1021/ACS.IECR.1C04859. [DOI] [Google Scholar]
- 47.Klein L, Swift CT. An improved model for the dielectric constant of sea water at microwave frequencies. IEEE Trans. Antennas Propag. 1977;25:104–111. doi: 10.1109/TAP.1977.1141539. [DOI] [Google Scholar]
- 48.Kaatze U. Complex permittivity of water as a function of frequency and temperature. J. Chem. Eng. Data. 1989;34:371–374. doi: 10.1021/je00058a001. [DOI] [Google Scholar]
- 49.Mopsik FI. Dielectric constant of n-hexane as a function of temperature, pressure, and density. J. Res. Natl. Bur. Stand. A. Phys. Chem. 1967;71A:287. doi: 10.6028/jres.071A.035. [DOI] [PMC free article] [PubMed] [Google Scholar]
- 50.Ritzoulls G, Papadopoulos N, Jannakoudakls D. Densities viscosities, and dielectric constants of acetonitrile + toluene at 15, 25, and 35 °C. J. Chem. Eng. Data. 1986;31:146–148. doi: 10.1021/je00044a004. [DOI] [Google Scholar]
- 51.Sastry NV, Patel MC. Densities, excess molar volumes, viscosities, speeds of sound, excess isentropic compressibilities, and relative permittivities for alkyl (methyl, ethyl, butyl, and isoamyl) acetates + glycols at different temperatures. J. Chem. Eng. Data. 2003;48:1019–1027. doi: 10.1021/je0340248. [DOI] [Google Scholar]
- 52.Aycock DF. Solvent applications of 2-methyltetrahydrofuran in organometallic and biphasic reactions. Org. Process Res. Dev. 2007;11:156–159. doi: 10.1021/op060155c. [DOI] [Google Scholar]
- 53.Tsierkezos NG, Kelarakis AE, Molinou IE. Densities, viscosities, refractive indices, and surface tensions of 4-methyl-2-pentanone+ethyl benzoate mixtures at (283.15, 293.15, and 303.15) K. J. Chem. Eng. Data. 2000;45:395–398. doi: 10.1021/je990271t. [DOI] [Google Scholar]
- 54.De Jesús-González NE, Pérez De La Luz A, López-Lemus J, Alejandre J. Effect of the dielectric constant on the solubility of acetone in water. J. Chem. Eng. Data. 2018;63:1170–1179. doi: 10.1021/acs.jced.7b00573. [DOI] [Google Scholar]
- 55.Shen XR, Xia DZ, Xiang YX, Gao JG. γ-Valerolactone (GVL) as a bio-based green solvent and ligand for iron-mediated AGET ATRP. E-Polymers. 2019;19:323–329. doi: 10.1515/epoly-2019-0033. [DOI] [Google Scholar]
- 56.Hunger J, et al. Relative permittivity of dimethylsulfoxide and N, N-dimethylformamide at temperatures from (278 to 328) K and pressures from (0.1 to 5) MPa. J. Chem. Eng. Data. 2010;55:2055–2065. doi: 10.1021/je9010773. [DOI] [Google Scholar]
- 57.Gregory, A. P. & Clarke, R. N. Tables of the complex permittivity of dielectric reference liquids at frequencies up to 5 GHz; NPL report MAT 23. Innovation (2009).
- 58.Shinomiya T. Dielectric dispersion and intermolecular association for 28 pure liquid alcohols: The position dependence of hydroxyl group in the hydrocarbon chain. Bull. Chem. Soc. Jpn. 1989;62:908–914. doi: 10.1246/bcsj.62.908. [DOI] [Google Scholar]
- 59.Malmberg CG, Maryott AA. Dielectric constant of water from 0 to 100 C. J. Res. Natl. Bur. Stand. 1956;56:1–8. doi: 10.6028/jres.056.001. [DOI] [Google Scholar]
- 60.Gabriel C, Gabriel S, Grant EH, Halstead BSJ, Michael Mingos D. Dielectric parameters relevant to microwave dielectric heating. Chem. Soc. Rev. 1998;27:213–224. doi: 10.1039/a827213z. [DOI] [Google Scholar]
Associated Data
This section collects any data citations, data availability statements, or supplementary materials included in this article.
Supplementary Materials
Data Availability Statement
The datasets used and/or analyzed during the current study are available from the corresponding author upon reasonable request.


