

Abstract
In this study, the magnetic photocatalyst Scendesmus/Fe3O4/TiO2 was synthesized, and its sonophotocatalytic properties in relation to the degradation of the Red195 dye were evaluated. Particles were characterized using a scanning electron microscope (SEM), Fourier's transform infrared spectroscopy (FTIR), X-ray powder diffraction (XRD), and a vibrating-sample magnetometer (VSM). At a pH of 5, a photocatalyst dosage of 100 mg, an initial R195 concentration of 100 mg/l, an ultrasound power of 38W, and an exposure time of 20 min, the maximum Red195 removal efficiency (100%) was achieved. After five cycles of recycling, the composite's sonophotocatalytic degradation stability for R195 remains above 95%. Experiments on scavenging indicate that electrons (h+) and hydroxyls (OH-) are indispensable decomposition agents. The removal of R195 by Scendesmus/Fe3O4/TiO2 is consistent with the pseudo-first-order kinetic, Freundlich, and Henderson's isotherm models, as determined by kinetic and isotherm investigations. The negative activation enthalpy of the standard (ΔH°) illuminates the exothermic adsorption mechanism. The increase in standard Gibbs activation free energy (ΔG°) with increasing temperature reveals the process is not spontaneous. As indicated by the negative value of the standard entropy of activation (ΔS°), activation of the reactants resulted in a loss of freedom.
Subject terms: Biochemistry, Environmental sciences, Chemistry, Engineering, Materials science
Introduction
The textile industry's production and disposal of effluent, which frequently contains toxic metals and biodegradation-resistant organic compounds1. The most widely used dyes in the textile industry are azo dyes with azo (–N=N–), hydroxyl (•OH), and –SO3H groups2. Due to their resilience and high solubility in aqueous solutions, it is challenging to eliminate these dyes using a microorganism-based remediation method3. Recently, conventional physicochemical processes such as reverse osmosis, coagulation-flocculation, adsorption, and filtration have been utilized to remove persistent pollutants from wastewater4. The production of secondary pollutants, high post-treatment costs, and the inability of pollutants to decompose are current issues with technologies5. Traditional physicochemical techniques include membrane filtration, adsorption, chemical precipitation, reverse osmosis, ion exchange, electro-dialysis, solvent extraction, chemical oxidation/reduction, and others for removing dye pollutants from contaminated water6.
However, current methods frequently have issues, including the production of secondary pollutants, high post-treatment costs, and the inability of pollutants to degrade. In contrast to these removal methods, advanced oxidation processes (AOPs) based on the generation of free radicals such as •OH and O2 can mineralize a wide range of contaminants without generating sediment or hazardous residues5,6. In recent years, researchers have shown a great deal of interest in the AOP photocatalysis system for the treatment of industrial wastewater due to its demonstrated cost-effectiveness and non-toxic, complete mineralization7. By absorbing light, photocatalytic systems generate electron/hole (e-/h+) pairs that degrade contaminants in the aquatic environment by producing reactive oxygen species (such as •OH and O2•-)8. Semiconductors composed of TiO2 and ZnO are the materials utilized most frequently in this process. In contrast, the disadvantages of semiconductors in real-world applications include high cost, limited affinity for aromatic hydrocarbons, simple deactivation, and rapid e-/h+ pair recombination. To address these limitations, the researchers proposed the development of photocatalysts with a high light absorption potential and suitable electron transport7,9.
Microalgae have recently emerged as a viable microorganism for removing contaminants from effluent. Microalgae production is not commercially viable, however, due to photosynthesis and high growth and harvesting costs10. It is simple to obtain and cultivate green algae (Scenedesmus spp.), which are abundant in all aquatic environments. Due to its low cost, ease of recovery and reuse, large contact area, and high efficiency during limited contact periods, the use of algal biomass for the biosorption of pollutants is fascinating. Carbohydrates, intercellular pores, and sulfated polysaccharides observable on the adsorbent cell partition may enhance dye biosorption from effluent11. The recombination of photoproduced carriers limits the photocatalytic effectiveness of Scendesmus/TiO2 in large-scale treatment12. Since their abundance, low toxicity, and adequate band opening, it is suggested that magnetic nanoparticles be combined with Scendesmus or TiO2 to address this issue. Combining iron with Scendesmus/Fe3O4/TiO2 is advantageous because separation by an external magnetic field is easier6.
Recent research has combined sonocatalysis and photocatalysis to improve the treatment of resilient wastewater as well as the photocatalyst's activity13,14. In the sonophotocatalytic process, microbubbles are created by absorbing energy from an Ultrasonic field, which causes high concentrations of •OH15. Consequently, light and US waves stimulate the photocatalyst to generate more energetic radicals. In addition to enhancing adsorption, mass transfer, and particle dispersion, the resultant cavitation also cleans the active regions of the particles by removing adhesive residues16.
Sono-photocatalysis based on Scendesmus/Fe3O4/TiO2 is limited due to a lack of information17–19. In addition, data regarding the efficacy and properties of the synthetic photocatalyst are lacking13,19,20. Using a variety of diagnostic techniques, Scendesmus/Fe3O4/TiO2 nanoparticles were synthesized and characterized as a novel photocatalyst. In order to determine the viability of a novel photocatalyst for the well-organized degradation of R195, the process efficiencies of sono-photodegradation were compared with those of sonolysis, photolysis, sonocatalysis, and photocatalysis systems.
The main goals of this study are to synthesize a novel structured Scendesmus/Fe3O4/TiO2 magnetic photocatalyst, characterize and evaluate the Scendesmus/Fe3O4/TiO2 potential in R195 removal, and optimize the effects of pH, exposure time, photocatalyst dosage, dye concentration, and US power on R195 removal using response surface methodology. Thus, the findings of this study can serve as a guide for the safe and effective remediation of various textile wastewaters.
Materials and methods
Prepration of algae (Scendesmus sp.)
The Caspian Sea Ecology Research Institute in Mazandaran, Iran, cultivated a sample of Scendesmus sp Algae. The samples were then transferred to the Gorgan University of Agriculture and Natural Resources laboratory. Using a super grinder, the microalgae were then ground as finely as possible21.
Synthesis of Fe3O4 nanoparticles
For the synthesizing of Fe3O4 nanoparticles, the sol–gel method was modified. To produce a golden solution, 65 ml of ethylene glycol and 4.95 g of ferric nitrate nonahydrate were stirred for two hours at 45 °C. After 10 h of increasing the temperature of the mixture to 95 °C, gel formation was obtained22. The emulsion was then centrifuged and desiccated in a 105 °C furnace for twenty hours (Memmert VO 400). The material was annealed for two hours at 450 °C in a vacuum furnace (Nabertherm, R80-750/11, Germany) to produce magnetic Fe3O4 nanoparticles6.
synthesis of Fe3O4/scendesmus
0.49 g of Fe3O4 nanoparticles and 3.93 g of Scendesmus were dissolved in 60 ml of ethanol. At 73 °C, one hour was spent agitating the mixture. A solution of 6 ml ethanol and 1.58 ml diethanolamine was added dropwise to the initial mixture, which was stirred with a magnetic stirrer for 10 h at 76 °C until a dark brown solution was obtained. The solid was then isolated with an external magnet and dried in a vacuum furnace (Memmert VO 400) for 24 h at 90 °C23,24.
Synthesis of scendesmus/Fe3O4/TiO2
For one hour, a mixture of synthesized Scendesmus/Fe3O4 and ethanol at a concentration of 99.9% was agitated. During 10 h of heating at 150 °C, the mixture was treated with 6.16 ml of tetrabutylammonium hydroxide (TBOT) and 60 ml of ethanol. After washing the sample with methanol and distilled water, it was calcined at 450 °C for three hours6,22.
Point of zero charge
The point of zero charge (PZC) of algal biosorbent was determined with minor modifications to the salt addition method. The collection of various containers containing 0.1 M NaNO3 concentrations. HCl and NaOH (0.1 M) solutions were used to obtain pH values ranging from 2 to 1025. Each vial obtained 1 g of algal biosorbent and was stirred at 160 rpm for 24 h. The pH of each filtrate was noted after its constituents. Calculating the PZC value of algal biosorbent by plotting the initial pH against pH change graph26.
Sonophotocatalytic experiments
Sonophotocatalysis was utilized in a US bath containing a UVA lamp to ascertain the R195 degradation rate. A precise amount of our prepared catalyst (0.25–1 mg/l) was added to a 250 mL Erlenmeyer Pyrex containing R195 at a determined pH (between 3 and 7). Using a pH meter, NaOH, and H2SO4, the initial pH adjustment was performed27. To better comprehend the effect of the parameters, the reactor was exposed to US frequencies (20–50 kHz) at UV light intensities (6 W). The concentration of 1 ml samples collected at different times (10–40 min) was determined using UV–vis spectrophotometry at 550 nm. Utilizing Eqs. (1) and (2), the degradation efficiency and reaction kinetics of R195 were determined:28
| 1 |
| 2 |
qe in Eq. (1) quantifies the adsorbed ions (sorbate) in milligrams per gram in the biosorbent, where the initial and final metal concentrations Ci and Ce were measured by atomic absorption spectrometry; V represents the volume of the synthetic medium, and M represents the biomass of the biosorbent (g)27,28.
Desorption and regeneration studies
Using the supplied methodology, the reusability of the adsorbent to desorb the dye ions and regenerate the biomass for reuse was evaluated. To conduct an effective adsorption and desorption experiment, the aforementioned substances were subjected to five cycles of cycle repetition. 0.1 M hydrochloric acid was used to desorb metal ions29. Desorption experiments were carried out by combining a metal-loaded adsorbent with 50 mL of desorption medium (0.1 M HCl) and agitating at 160 rpm30. Each cycle is dominated by sorption, followed by desorption and regeneration. The following equations characterize biosorbent desorption and regeneration performance29,30:
| 3 |
| 4 |
Isotherm modeling
Isotherm models help describe the interactions between contaminants and synthetic adsorbents. Langmuir, Freundlich, Temkin, and Harkins–Jura are the adsorption isotherms most frequently used. The Langmuir isotherm model depicts monolayer adsorption on a surface with restricted sites and no intermolecular interaction8. For a linear fit of the Langmuir isotherm model to the experimental data, the following equation was used: Ce/qe versus Ce (Eq. 5).
| 5 |
where qe is the equilibrium adsorbate concentration in the adsorbent phase (mg/g), Ce is the equilibrium adsorbate concentration in the aqueous phase (mg/l), and b is the constant associated with the free adsorption energy and the concentration at which the adsorbent reaches half saturation. qm also represents the maximum absorption capacity (mg/g)5.
The quantity of reversible adsorption on a heterogeneous surface increases with increasing concentration (Eq. 6) according to the Freundlich adsorption isotherm31:
| 6 |
where qm is the amount of molecules adsorbed to the adsorbent surface at any given time (mg/g), Ce is the equilibrium concentration (mg/l), n and KF are the Freundlich constant and Freundlich exponent (mg/g (l/g)1/n, respectively), and Ce is the equilibrium concentration (mg/l)5.
As demonstrated by the following equations (Eqs. 7 and 8), the Temkin isotherm model is dependent on interactions between the absorbent and the adsorbate and assumes the linearity of the heat of adsorption of all molecules in the layer32:
| 7 |
| 8 |
bT is the Temkin isotherm constant (J/mol), R is the universal gas constant (8.314 J/mol K), T is the temperature (K), and AT is the Temkin isotherm equilibrium binding constant (l/g)32.
The fourth model examined to support the multilayer adsorption of iodine atoms onto the synthesized photocatalyst is the Harkins–Jura model, whose linear form (Eq. 9) is as follows33:
| 9 |
where AH and BH are Harkins constants derived from the slope and intercept of the linear plots of qe2 versus log Ce, respectively33.
Kinetics modeling
Adsorption kinetics provides data on adsorbent performance and mass transfer modes, such as diffusion, surface adsorption, intramolecular adsorption, and chemical adsorption. Adsorption kinetics are typically consistent with the pseudo-first-order kinetic model when the adsorption control factor is located in the boundary layer5. It indicates that a change in adsorption rate is proportional to the accessible sites on the surface of the adsorbent. As demonstrated by Eq. (10) 8:
| 10 |
where qe1 and qt represent the quantity of adsorbate adsorbed at equilibrium time and time t, respectively (mg/g). K1 (1/min) is the pseudo-first-order rate constant5.
In addition, the pseudo-second-order kinetic model is described as follows (Eq. 11)34:
| 11 |
where t is the time (min) and k2 is the constant pseudo-second-order rate (g/mg min) 34.
The Elovich model is one of the most commonly employed kinetic models for analyzing the impact of temperature on adsorption systems. The expression for the Elovich model is (Eq. 12)8:
| 12 |
where represents the initial adsorption rate constant (mg/g min) and Elovich's constant is the activation energy and surface coverage associated with chemisorption (g/m2)8.
According to the intraparticle diffusion model, the adsorption procedure consists of intraparticle diffusion, film diffusion, and emptying of the infill. This is crucial to the advancement of physical adsorption processes (Eq. 13), as it accounts for the formation of multiple layers based on van der Waals forces35,36:
| 13 |
where kint represents the intra-particle diffusion rate constant (g/mg min) and the intercept of the plot and C represents the boundary layer effect or surface adsorption35,36.
Thermodinamics modeling
The Arrhenius equation determines the activation energy, Ea, which is the minimum amount of energy necessary to initiate a chemical reaction5.
| 14 |
| 15 |
where kapp represents the apparent rate constant (min-1), Ea is the activation energy (kJ mol-1), T is the temperature (K), R is the gas constant (8.314 J K-1 mol-1) and A is the Arrhenius constant (min-1)22. In the transition state theory (TST), the conventional Gibbs free energy, ΔG° (kJ mol-1), is defined by the following equations6:
| 16 |
| 17 |
where ΔH° is the standard enthalpy (kJ mol-1) and ΔS° is the standard entropy (JK-1 mol-1)5. TST implies the temperature dependence of the apparent rate constant in the Henry equation33:
| 18 |
where KB is the Boltzmann’s constant (KB = 1.380510–23 JK-1) and h is the Planck’s constant (h = 1.380510-23Js)33.
| 19 |
| 20 |
The ΔH° and frequency factor constant (A) are analogous to the activation energy quantity (Ea)6.
| 21 |
| 22 |
Experimental design
Four independent variables were selected, including pH (A), photocatalyst dosage (B), exposure time (C), dye concentration (D), and US power (E) at three levels (Table 1). 48 experimental trials were prescribed by the CCD-RSM, and the response of independent variables was fitted to the model using the following regression equation (Table 2):5.
| 23 |
where β0, bi, bii, and bij are the intercept, linear, squared, and interaction coefficients, respectively. Y denotes the response. In addition, xi2, xj2… xk2 are the square effects, and xixj, xixk, and xjxk are the interaction effects of variables. k is the number of considered factors, and ε is the random errore5.
Table 1.
Range levels of independent variables.
| Independent variables | Range and level | ||
|---|---|---|---|
| − 1 | 0 | + 1 | |
| pH (A) | 3 | 5 | 7 |
| Photocatalyst dosage, mg (B) | 25 | 62.5 | 100 |
| Exposure time, min (C) | 5 | 22.5 | 40 |
| Concentarion of dye, mg/lit (D) | 50 | 125 | 200 |
| US power, W (E) | 30 | 65 | 100 |
Table 2.
ANOVA used to the designated quadratic model.
| Source | Sum of Squares | df | Mean Square | F-value | p-value | |
|---|---|---|---|---|---|---|
| Model | 4601.64 | 20 | 230.08 | 29.33 | < 0.0001 | Significant |
| A-pH | 243.56 | 1 | 243.56 | 31.04 | < 0.0001 | |
| B-Exposure time | 24.74 | 1 | 24.74 | 3.15 | 0.0871 | |
| C-Concentraion dye | 395.76 | 1 | 395.76 | 50.44 | < 0.0001 | |
| D-Photocatalyst dosage | 59.56 | 1 | 59.56 | 7.59 | 0.0104 | |
| E-US power | 105.88 | 1 | 105.88 | 13.50 | 0.0010 | |
| AB | 18.00 | 1 | 18.00 | 2.29 | 0.1415 | |
| AC | 66.13 | 1 | 66.13 | 8.43 | 0.0073 | |
| AD | 45.13 | 1 | 45.13 | 5.75 | 0.0237 | |
| AE | 105.13 | 1 | 105.13 | 13.40 | 0.0011 | |
| BC | 21.13 | 1 | 21.13 | 2.69 | 0.1124 | |
| BD | 153.13 | 1 | 153.13 | 19.52 | 0.0001 | |
| BE | 120.13 | 1 | 120.13 | 15.31 | 0.0006 | |
| CD | 12.50 | 1 | 12.50 | 1.59 | 0.2177 | |
| CE | 2.00 | 1 | 2.00 | 0.2549 | 0.6177 | |
| DE | 72.00 | 1 | 72.00 | 9.18 | 0.0053 | |
| A2 | 165.11 | 1 | 165.11 | 21.04 | < 0.0001 | |
| B2 | 207.97 | 1 | 207.97 | 26.51 | < 0.0001 | |
| C2 | 33.37 | 1 | 33.37 | 4.25 | 0.0489 | |
| D2 | 8.22 | 1 | 8.22 | 1.05 | 0.3150 | |
| E2 | 0.2604 | 1 | 0.2604 | 0.0332 | 0.8568 | |
| Residual | 211.84 | 27 | 7.85 | |||
| Lack of fit | 168.50 | 22 | 7.66 | 0.8838 | 0.6268 | Not significant |
| Pure error | 43.33 | 5 | 8.67 | |||
| Cor total | 4813.48 | 47 |
Results and discussion
Characterization
FTIR analysis
As determined by FTIR spectroscopy, Fig. 1 depicts the functional groups of Scendesmus/Fe3O4 and Scendesmus/Fe3O4/TiO2. Strong –OH stretching is detected at 3440.55 cm-1 in Scendesmus/Fe3O4/TiO2 and scendesmus/Fe3O4, which may be related to the presence of water6. The bands at 1164.35 and 1367.35 cm-1 correspond, respectively, to the C=O, C–O, and Fe (C–O–Fe) stretching vibrations22. C=O at 1631.55 cm-1, however, indicated the presence of acetylacetonate on the photocatalyst surface5. The Fe–O content of Scendesmus/Fe3O4 and Scendesmus/Fe3O4/TiO2 is also confirmed by bands between 511.06 and 590.14 cm-137. The observed bands between 550 and 900 cm-1 verify the presence of Ti–O–Ti and Fe–O6. In addition to Fe–O stretching vibrations, symmetric and asymmetric stretching, and COO-, the bands are also associated with Fe–O stretching vibrations. Anatase Fe–O and TiO2 are responsible for the peaks at 576 and 593 cm-1 in the Scendemus/Fe3O4/TiO2 spectrum37.
Figure 1.

FTIR analysis of Scendesmus/Fe3O4 and Scendesmus/Fe3O4/TiO2.
SEM,Mapping and VSM analysis
Figure 2a and b depict the surface morphology of Scendesmus/Fe3O4/TiO2, respectively. Figure 2a demonstrates the octagonal shape and flat surface of the Scendesmus.sp37. Scendesmus was uniformly coated with TiO2 particles for photocatalytic activity, as shown in Fig. 2b 38. This indicates that the titanium particles on the Scendesmus' surface are securely adhered. Therefore, the Scendesmus/Fe3O4/TiO2 synthesis was successful. Carbon, iron, oxygen, and titanium are present in the mapping analysis, confirming the formation of Scendesmus/Fe3O4/TiO2 (Fig. 2c–f)39. Based on VSM analysis, the presence of diamagnetic TiO2 in the structure of Scendesmus/Fe3O/TiO2 was responsible for a minor decrease in magnetic strength5. The photocatalyst exhibited robust magnetic activity against a 1.4 Tesla external magnet. In addition, the saturation magnetization (MS) value was approximately 16 emu/g, demonstrating the photocatalyst's high magnetic properties (Fig. 3)22.
Figure 2.

FESEM images Scendesmus (a) and Scendesmus/Fe3O4/TiO2 (b), Map analyses of the Scendesmus/Fe3O4/TiO2, (c) C ka, (d) Fe ka, (e) O ka, (f) Ti ka.
Figure 3.

VSM analysis of (a) Scendesmus/Fe3O4 and (b) Scendesmus/Fe3O4/TiO2.
Central composite design
Model and statistical analysis
To design and optimize the interaction effects of five sono-photocatalytic process variables, the CCD model (RSM) was used. Table 2 displays the obtained results (actual and predicted responses) for the R195 degradation by means of the sono-photocatalytic process, after designating the number of trials using the CCD plan. Taking into consideration the coded factors, the proposed model equation (Eq. 24) was fitted to the quadratic model for R195 degradation following statistical analysis.
| 24 |
Table 3 presents a summary of the F-value, P-value, and R2 values used in the analysis of variance (ANOVA) to determine the significance and degree of fit of the employed model. The F-value and P-value for the degradation of R195 in the constructed model are 29.33 and 0.00001, respectively, indicating that the proposed model is significant5. As the factor with the highest F-value, the C-factor (dye concentration) is deemed significant. In addition, the P-value for lack of fit (LOF) reveals an insignificant mode (P-value > 0.05), which indicates a superior action compared to the model described40. Three categories of correlation coefficients, including R2 (0.9560), adjusted R2 (0.9234), and predicted R2 (0.8566), were used to evaluate the suitability of the models (Table 4).
Table 3.
ANOVA results for Red195 removals.
| Response | Sum of squares | Mean square | F Value | p-valuProb > F | Predicted R2 |
|---|---|---|---|---|---|
| Red195 removal | 4601.64 | 230.08 | 29.33 | < 0.0001 | 0.8566 |
| Std.Dev | C.V | Ad. pre* | R2 | Adj.R2 | |
| 2.80 | 3.35 | 20.63 | 0.9560 | 0.9234 |
Table 4.
Experimental conditions, and the obtained results.
| Run | Value | ||||||
|---|---|---|---|---|---|---|---|
| A | B | C | D | E | R195 removal (%) | Predicted removal(%) | |
| 1 | 7 (+ 1) | 40 (+ 1) | 50 (− 1) | 25 (− 1) | 30 (− 1) | 71 | 71.85 |
| 2 | 7 (+ 1) | 5 (− 1) | 50 (− 1) | 100 (+ 1) | 100 (+ 1) | 86 | 83.69 |
| 3 | 3 (− 1) | 40 (+ 1) | 200 (+ 1) | 25 (− 1) | 100 (+ 1) | 82 | 79.03 |
| 4 | 7 (+ 1) | 40 (+ 1) | 50 (− 1) | 25 (− 1) | 100 (+ 1) | 81 | 79.38 |
| 5 | 3 (− 1) | 5 (− 1) | 50 (− 1) | 25 (− 1) | 100 (+ 1) | 80 | 81.02 |
| 6 | 3 (− 1) | 40 (+ 1) | 50 (− 1) | 100 (+ 1) | 100 (+ 1) | 85 | 88.50 |
| 7 | 5 (0) | 22.5 (0) | 125 (0) | 62.5 (0) | 65 (0) | 100 | 97.10 |
| 8 | 7 (+ 1) | 40 (+ 1) | 50 (− 1) | 100 (+ 1) | 30 (− 1) | 77 | 77.00 |
| 9 | 3 (− 1) | 40 (+ 1) | 50 (− 1) | 25 (− 1) | 30 (− 1) | 84 | 81.83 |
| 10 | 7 (+ 1) | 5 (− 1) | 200 (+ 1) | 100 (+ 1) | 100 (+ 1) | 70 | 74.12 |
| 11 | 7 (+ 1) | 5 (− 1) | 200 (+ 1) | 25 (− 1) | 30 (− 1) | 73 | 68.44 |
| 12 | 7 (+ 1) | 40 (+ 1) | 200 (+ 1) | 25 (− 1) | 100 (+ 1) | 70 | 70.55 |
| 13 | 5 (0) | 22.5 (0) | 125 (0) | 62.5 (0) | 30 (− 1) | 94 | 95.66 |
| 14 | 7 (+ 1) | 5 (− 1) | 200 (+ 1) | 100 (+ 1) | 30 (− 1) | 70 | 67.34 |
| 15 | 3 (− 1) | 5 (− 1) | 50 (− 1) | 100 (+ 1) | 30 (− 1) | 80 | 80.14 |
| 16 | 3 (− 1) | 5 (− 1) | 200 (+ 1) | 25 (− 1) | 100 (+ 1) | 74 | 74.70 |
| 17 | 7 (+ 1) | 5 (− 1) | 50 (− 1) | 25 (− 1) | 100 (+ 1) | 80 | 81.30 |
| 18 | 5 (0) | 22.5 (0) | 125 (0) | 62.5 (0) | 65 (0) | 98 | 97.10 |
| 19 | 7 (+ 1) | 40 (+ 1) | 200 (+ 1) | 100 (+ 1) | 30 (− 1) | 70 | 69.67 |
| 20 | 3 (− 1) | 5 (− 1) | 50 (− 1) | 25 (− 1) | 30 (− 1) | 90 | 88.50 |
| 21 | 5 (0) | 5 (− 1) | 125 (0) | 62.5 (0) | 65 (0) | 85 | 87.07 |
| 22 | 5 (0) | 22.5 (0) | 125 (0) | 25 (− 1) | 65 (0) | 97 | 97.60 |
| 23 | 3 (− 1) | 40 (+ 1) | 200 (+ 1) | 100 (+ 1) | 100 (+ 1) | 87 | 87.93 |
| 24 | 7 (+ 1) | 5 (− 1) | 50 (− 1) | 100 (+ 1) | 30 (− 1) | 76 | 77.91 |
| 25 | 3 (− 1) | 40 (+ 1) | 200 (+ 1) | 25 (− 1) | 30 (− 1) | 76 | 77.75 |
| 26 | 5 (0) | 40 (+ 1) | 125 (0) | 62.5 (0) | 65 (0) | 90 | 88.78 |
| 27 | 5 (0) | 22.5 (0) | 125 (0) | 62.5 (0) | 65 (0) | 98 | 97.10 |
| 28 | 5 (0) | 22.5 (0) | 125 (0) | 62.5 (0) | 65 (0) | 92 | 97.10 |
| 29 | 7 (+ 1) | 5 (− 1) | 50 (− 1) | 25 (− 1) | 30 (− 1) | 80 | 81.52 |
| 30 | 5 (0) | 22.5 (0) | 125 (0) | 62.5 (0) | 65 (0) | 98 | 97.10 |
| 31 | 3 (− 1) | 5 (− 1) | 200 (+ 1) | 100 (+ 1) | 30 (− 1) | 73 | 75.32 |
| 32 | 3 (− 1) | 40 (+ 1) | 50 (− 1) | 25 (− 1) | 100 (+ 1) | 80 | 82.11 |
| 33 | 3 (− 1) | 5 (− 1) | 200 (+ 1) | 25 (− 1) | 30 (− 1) | 80 | 81.17 |
| 34 | 5 (0) | 22.5 (0) | 200 (+ 1) | 62.5(0) | 65 (0) | 86 | 90.01 |
| 35 | 3 (− 1) | 40 (+ 1) | 50 (− 1) | 100(+ 1) | 30 (− 1) | 82 | 82.22 |
| 36 | 3 (− 1) | 5 (− 1) | 50 (− 1) | 100(+ 1) | 100 (+ 1) | 80 | 78.67 |
| 37 | 7 (+ 1) | 5 (− 1) | 200 (+ 1) | 25 (− 1) | 100 (+ 1) | 70 | 69.22 |
| 38 | 7 (+ 1) | 40 (+ 1) | 200 (+ 1) | 100(+ 1) | 100 (+ 1) | 85 | 84.20 |
| 39 | 3 (− 1) | 40 (+ 1) | 200 (+ 1) | 100(+ 1) | 30 (− 1) | 83 | 80.65 |
| 40 | 7 (+ 1) | 22.5 (0) | 125 (0) | 62.5(0) | 65 (0) | 85 | 86.25 |
| 41 | 5 (0) | 22.5 (0) | 125 (0) | 62.5(0) | 65 (0) | 100 | 97.10 |
| 42 | 3 (− 1) | 22.5 (0) | 125 (0) | 62.5(0) | 65 (0) | 92 | 91.60 |
| 43 | 7 (+ 1) | 40 (+ 1) | 200 (+ 1) | 25 (− 1) | 30 (− 1) | 60 | 62.02 |
| 44 | 7 (+ 1) | 40 (+ 1) | 50 (− 1) | 100(+ 1) | 100 (+ 1) | 91 | 90.52 |
| 45 | 5 (0) | 22.5 (0) | 50 (− 1) | 62.5(0) | 65 (0) | 100 | 96.84 |
| 46 | 5 (0) | 22.5 (0) | 125 (0) | 62.5(0) | 100 (+ 1) | 100 | 99.19 |
| 47 | 5 (0) | 22.5 (0) | 125 (0) | 100(+ 1) | 65 (0) | 100 | 100.25 |
| 48 | 3 (− 1) | 5 (− 1) | 200 (+ 1) | 100(+ 1) | 100 (+ 1) | 78 | 74.85 |
Figure 4a was constructed from a comparison of predicted values against factual values41. The validity of the model was confirmed by a straight trend line connecting residuals (Fig. 4b). Comparing the residual's plot to the predicted values (Fig. 4c) and run numbers (Fig. 4d) requires a random dispersion. A Box-Cox procedure (Fig. 4e) was used to determine the normality of the data and establish the model significance of the sonophotocatalytic process42.
Figure 4.

The diagnostics plots for validation of quadratic model: (a) predicted values vs. factual values, (b) normal probability distribution of residuals, (c) internally studentized residuals vs. predicted values plot, (d) internally studentized residuals vs. run numbers, and (e) Box-Cox plot.
The effect of single factors
The variance analysis (ANOVA) for R195 removal is presented in Table 3. Among pH, exposure time, photocatalyst dosage, R195 concentration, and US power as a single variable, each factor with a high mean square and high F-value exerts the greatest influence on the sono-photodegradation of R195. Thus, the effect of variables on R195's degradation is43:
The concentration of R195 with a mean square and F-value of 230.08 and 29.33, respectively, was the most crucial factor in R195 removal5.
Three dimensional response surface schemes
Three-dimensional (3D) graphical schemes (Fig. 5) were implemented in order to assess the individual and combined effects of operational variables on the sonophotocatalytic degradation of R195. Figure 5a depicts the simultaneous effect of initial pH (three to seven) and dye concentration (fifty to two hundred mg/lit) on optimization under constant conditions (exposure time = 22 min, US power = 65W, and photocatalyst dosage = 62.50 mg). Maximum removal efficacy was observed in a medium with a pH of 5 after 15 min. This trend can be attributed to the following elements: (a) A test apparatus operating under identical conditions will produce analogous results (equal production of hydroxyl radicals at each initial R195 concentration)44; (b) the generation of hydroxyl radicals is proportional to the initial concentration of R19540. Therefore, an increase in the number of dye molecules can lead to the saturation of active sites on the surface of the photocatalyst and inadequate production of hydroxyl radicals42. (c) Produced intermediates of R195 during sonophotocatalytic degradation (at high concentrations of R195) reduce removal efficiency due to a competition reaction between the dye and intermediate with free radicals5. Dye molecules and photocatalyst nanorods are brought into favorable contact by increasing the number of accessible active sites. According to the scientific literature, the pka of R195 (3.6) and the pHpzc of TiO2 (6.8) remind us that electrostatic interaction between the negatively charged facet of R195 (at pH > 3.6) and the positively charged facet of nanorods (at pH 6.8) is the primary reason for the accelerated degradation of R1956,22. Additionally, by undertaking sonophotocatalytic reactions in an acidic medium and extending the duration of US irradiation, residual R195 in the cavitation bubbles containing more hydroxyl radicals can provide a greater potential for oxidation of the model pollutant44. Amri et al.45 and Nangia et al.46 also reported similar results with our findings45,46. 5b depicts the reciprocal effect of pH and photocatalyst concentration. By increasing the pH (from 3 to 7) and decreasing the amount of catalyst (from 100 to 25 mg), the removal efficiency was diminished. At a higher photocatalyst dosage, more cavitation bubbles may be produced in the region of ultrasound irradiation, resulting in sufficient free radical generation22.
Figure 5.

The three-dimensional interaction effects of pH and concentration of dye (a), pH and photocatalyst dosage (b), pH and US power (c), exposure time and photocatalyst dosage for (d), photocatalyst dosage and US power (e), exposure time and US power (f).
Figure 5c investigates the effects of pH and US power on the elimination of R195 by varying the US power from 30 to 100 W and the pH from 3 to 7. As the US power increased from 30 to 100 W, the percentage of removal rose from 55 to 85%.The increase in dye degradation can be attributed to a number of factors, including the disintegration of dye molecules, the destruction of dye structures as a result of an increase in energy pressure, and the total decomposition of dye5,40,47. Figure 5d depicts the interaction effect of contact time and photocatalyst dose. The duration ranged from 5 to 40 min, and the photocatalyst dose ranged from 25 to 100 mg. The removal percentage rose from 65 to 98% as the photocatalyst dosage increased. The optimal dose for reducing photocatalyst consumption was determined to be 62 mg. In relation to the time variable, the photocatalytic removal rate increased from 5 to 83% between 5 and 22 min, and then decreased from 83 to 75% between 22 and 40 min. Increasing the photocatalyst's contact time with US and UVA lamps initially accelerated the oxidation processes. After 22 to 40 min, the removal rate decreased due to increased competition between the dye molecule and the photocatalyst and the saturation of the active sites5. Thus, 22 min was considered the optimal duration. Figure 5e examines the effect of the US power parameter in the range of 30 to 100 W and the photocatalyst dose in the range of 25 to 100 mg. Both parameters increased directly in proportion to the amount of dye removed. Figure 5f depicts the interaction effect of photocatalyst dose and US power. Both parameters increased directly in proportion to the amount of dye removed. The dye removal percentage increased from 64 to 95% when the photocatalyst dose was increased from 25 to 100 mg, and when the US power was increased from 30 to 100W. It is due to the high availability of active reaction sites, OH radicals, and electron–hole pairs8,43,46.
Mechanism of sonophotocatalytic degradation
To identify reactive active species in the degradation of R195 by the Scendesmus/Fe3O4/TiO2 UV/US process, radical trapping experiments with a variety of scavengers were conducted. 100 percent (reactor without scavenger) to 86.9 percent (reaction solution with TiO2 present). This event demonstrates that O2 molecules were converted into an O2•-reaction solution, decreasing the effectiveness from one hundred percent to 66.7%48. These findings indicate that the sonophotocatalytic process generates •OH, h+, and O2•- in the reaction solution49. A potential degradation mechanism for the sonophotocatalytic process has been postulated based on the results of the entrapment test and previous research6. Using adsorption and photolysis, certain contaminants can be eliminated. Sonolysis and sonophotocatalytic processes can also be utilized to eliminate R195 dye in solution and on a catalyst's surface. During these processes, the heated spot event (resulting from the cavitation effect) can separate water molecules into •OH and H• (Eq. (25))6,22,48. US radiation, via the sonoluminescence mechanism, produces visible light radiation for the generation of electron/hole pairs in the valence and conduction bands of particles along the same pathway28. Under UV radiation, however, Scendesmus/Fe3O4/TiO2 nanoparticles generate electron–hole pairs by absorbing light (Eq. (26))50. In addition to directly degrading the contaminant, the holes in the valence band can decompose H2O molecules and hydroxyl ions (OH-) to generate •OH (Eqs. (27) and (28))6. All species generated in the solution and solid phases are capable of transforming pollutants into CO2, H2O, and biodegradable products (Eq. (29))22.
| 25 |
| 26 |
| 27 |
| 28 |
| 29 |
Isotherm, kinetcs and thermodinamics model
As depicted in Fig. 6, the Langmuir, Freundlich, Temkin, and Harkins–Jura isotherm adsorption models were implemented. The Freundlich (R2 = 0.9782), Harkins Jura (R2 = 0.9438), Temkin (R2 = 0.9687), and Langmuir (R2 = 0.9584) models (Table 5) provided a more accurate description of the equilibrium adsorption data. Freundlich's isotherm is an empirical model that depicts photocatalyst-pollutant interactions on heterogeneous surfaces and in multilayer adsorption5. With 1/n and KF values of 0.4036 and 12.68 mg1-n g-1 L-n, respectively, the adsorption process and reaction's intensity were favorable. In addition, the Harkins–Jura model confirmed the adsorption of R195 molecules onto the heterogeneous surface33. In contrast, the presence of exothermic and physical adsorption between R195 molecules and Scendesmus, Fe3O4, and TiO2 was indicated by the positive value of bT (43.266 J/mol) in the Temkin isotherm32. The optimal adsorption capacity (qm) predicted by the Langmuir isotherm was close to the experimental value, indicating that the photocatalyst had a uniform surface with the same activation energy31. In addition, the RL value between 0 and 1 (RL = 0.0269) indicated that the adsorption procedure was successful. Using pseudo-first-order, pseudo-second-order, Elovich, and intra-particle diffusion kinetic models, the R195 removal mechanism was predicted5. According to Fig. 7 and Table 5, the equilibrium condition for R195 removal was stabilized after 60 min for all concentrations tested, ranging from 50 to 500 mg/l, as shown in Fig. 7 and in Table 5. At 300 mg/l of R195, the empirical data were best described by the pseudo-first-order (PFO) model with R2 = 0.9925. These findings reveal a correlation between the quantity of physical R195 adsorption and the increased driving force responsible for the efficient diffusion of R195 molecules to the surface of Scendesmus/Fe3O4/TiO2 and their occupation of the remaining active sites33. The pseudo-second-order (PSO) model best described the adsorption process of 100, 200, and 400 mg/l of initial R195 concentrations, with R2 values of 0.9983, 0.9731, and 0.9722, respectively, when considering chemisorption as the predominant adsorption process with electron donor–acceptor and dispersal interactions51. The Elovich model also demonstrated the chemical adsorption of R195 molecules on the solid surfaces of exceedingly heterogeneous adsorbents (R2 > 0.9871)5. The intra-particle diffusion model provided the best fit to the adsorption data (Table 5, R2 = 0.9857 for 50 mg/l R195 and R2 = 0.9398 for 500 mg/l R195, respectively). Since the relationship between qt and t0.5 is linear, intra-particle diffusion should be the rate-regulating process 35,36.
Figure 6.

Langmuir (a), Freundlich (b), Temkin (c), and Harkins–Jura (d) isotherm models for R195 removal.
Table 5.
Parameters of isotherm, kinetics and thermodynamics model.
| Kinetic | Parameters/Value | |||
|---|---|---|---|---|
| Pseudo-first-order | K1 (min-1) | qe (mg/g) | R2 | |
| 50 | − 0.0251 | 241.815 | 0.9812 | |
| 100 | − 0.0263 | 153.394 | 0.9925 | |
| 200 | − 0.0289 | 664.230 | 0.9731 | |
| 300 | − 0.0338 | 1738.095 | 0.9752 | |
| 400 | − 0.0374 | 3385.488 | 0.9352 | |
| 500 | − 0.0295 | 1487.73 | 0.9324 |
| Pseudo-second-order | K2 (g.mg-1 min-1) | qe (mg/g) | R2 | |
|---|---|---|---|---|
| 50 | 4604.777 | 90.29 | 0.9557 | |
| 100 | 44,976.76 | 107.29 | 0.9983 | |
| 200 | 53,273.72 | 323.52 | 0.9731 | |
| 300 | 33,598.76 | 276.26 | 0.9589 | |
| 400 | 18,786.43 | 537.32 | 0.9722 | |
| 500 | 26,125.04 | 600.01 | 0.9424 |
| Elovich | α (mg g-1 min-1) | β (g/mg) | R2 | |
|---|---|---|---|---|
| 50 | 1.396 | 0.056 | 0.9652 | |
| 100 | 12.976 | 0.052 | 0.9871 | |
| 200 | 22.922 | 0.019 | 0.9573 | |
| 300 | 11.121 | 0.008 | 0.9384 | |
| 400 | 14.004 | 0.007 | 0.9091 | |
| 500 | 273.723 | 0.005 | 0.9347 |
| Intra particle diffusion | C (mg/g) | Kint (mg.g- 1.min-0.5) | R2 | |
|---|---|---|---|---|
| 50 | − 8.8121 | 4.3797 | 0.9857 | |
| 100 | − 32.921 | 4.7259 | 0.9623 | |
| 200 | − 33.598 | 13.942 | 0.8869 | |
| 300 | − 44.076 | 28.138 | 0.9583 | |
| 400 | − 23.943 | 29.758 | 0.9494 | |
| 500 | − 31.195 | 40.165 | 0.9398 |
| Isotherm | Parameters | Value | ||
|---|---|---|---|---|
| Langmuir | qm (mg/g) | 1.42 | ||
| b (l/mg) | 36.09 | |||
| R2 | 0.9584 | |||
| RL | 0.0269 | |||
| Freundlich | KF (mg1-n g-1 L-n) | 12.68 | ||
| 1/n | 0.4036 | |||
| R2 | 0.9782 | |||
| Harkins–Jura | A | + 3.368 | ||
| B | 2.338 | |||
| R2 | 0.9438 | |||
| Temkin | bT (J/mol) | 43.26 | ||
| AT (l/g) | 0.1308 | |||
| R2 | 0.9687 |
| T, K | Kapp(*10–3), min-1 | Ln(Kaaph/KBT) | ΔGo, KJ mol-1 | |
|---|---|---|---|---|
| Transition theory | ||||
| 288.15 | 0.3293 | − 48.4941 | − 105.69 | |
| 293.15 | 0.4300 | − 48.2445 | − 457.192 | |
| 298.15 | 0.5546 | − 48.0069 | − 1287.11 | |
| 303.15 | 0.6066 | − 47.9340 | − 2099.44 | |
| 308.15 | 0.7799 | − 47.6990 | − 3241.03 | |
| 313.15 | 0.8146 | − 47.6716 | − 3852.97 | |
| 318.15 | 0.8666 | − 47.6256 | − 4948.46 | |
| ΔHo, KJ mol-1 | ΔSo, KJ mol-1 k | Ea, kJ mol-1 | A, s-1 | R2 |
|---|---|---|---|---|
| Transition theory | ||||
| − 25.368 | + 21.167 | − 69.121 | 7.151 | 0.9810 |
| Ea, kJ mol-1 | A, s-1 | R2 | ||
|---|---|---|---|---|
| Arrhenius theory | ||||
| + 72.414 | 37.326 | 0.9844 | ||
Figure 7.

Pseudo-first-order (a), pseudo-second-order (b), and Elovich (c) and Intra particle diffusion (d) kinetic models for the R195 concentrations of 50 (
 ), 100 (
 ), 200 (
 ), 300 (
 ), 400 (
 ), and 500 (
 ) mg/100 ml. Enthalpy and entropy change for the photocatalytic decomposition of R195, (e) Arrhenius plot and (f) Henry Eyring plot.
As shown in Table 5, the activation energy was calculated to be 69.12 kJ mol-1. The exothermic adsorption mechanism was revealed by the negative standard enthalpy of activation (ΔHo = −23.368)5. Moreover, the increasing value of the standard Gibbs free energy of activation (ΔGo) with increasing temperature demonstrated that the process was not spontaneous22. The positive value of standard entropy of activation (ΔSo = + 21.167) was related to the transient molecular configuration at the summit of the energy barrier, indicating an increase in the degree of loss of freedom when the activated complex is formed from the reactants6,33.
Potential scendesmus/Fe3O4/TiO2 recycle
Under constant conditions (pH = 5, photocatalyst dosage = 100 mg, initial R195 concentration = 100 mg/l, ultrasound power = 38W, and exposure time = 20 min), the reusability of the synthesized Scendesmus/Fe3O4/TiO2 photocatalyst was evaluated (Fig. 8). After five cycles, the photocatalytic efficiency of Scendesmus/Fe3O4/TiO2 remained above 95% without any discernible decline. Due to its stability, the synthesized Scendesmus/Fe3O4/TiO2 composite is economically viable for use in the effluent treatment process22. Future product development and convincing investors and stakeholders could increase the renewability and cost-effectiveness of the final photocatalyst6 .
Figure 8.
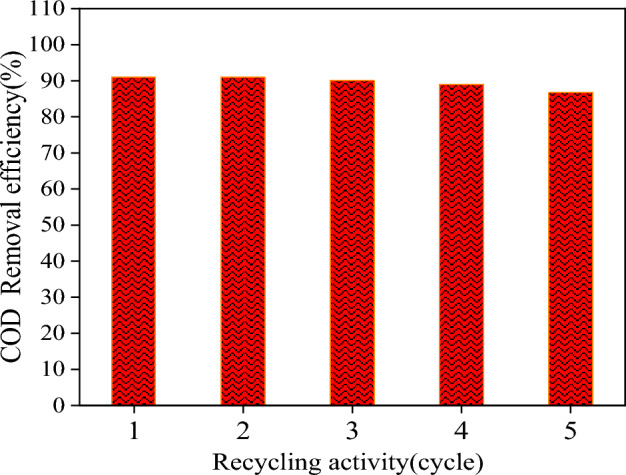
The reusability of the Scendesmus/Fe3O4/TiO2 within five cycles.
Comparison of sonophotocatalytic degradation with other methods
Numerous techniques for degrading textile dyes have been investigated. Table 6 compares these techniques for the degradation of R195. The comparison demonstrates that sonophotocatalysis of R195 using Scendesmus/Fe3O4/TiO2 as a photocatalyst yields superior results in comparison to other techniques. According to the obtained data, the present photocatalyst (Scendesmus/Fe3O4/TiO2) is novel, relatively effective, cost-effective, and broadly accessible. Scendesmus was used as a precursor for the first time in this study to produce a magnetic photocatalyst and eliminate R195 dye. In this investigation, garbage was used as a photocatalyst to remove pollutants from farm effluent. From an ecological standpoint, this matter is of the utmost importance.
Table 6.
Comparison with various Methods for the Removal of R195 Dyes.
| Dye | Method | Time(min) | Degredation(%) | Refrencess |
|---|---|---|---|---|
| Rhodamine B (RhB) | photocatalytic removal | 35 | 84.5 | 52 |
| Methyl red (MR) | Adsorption | 60 | 85 | 53 |
| Rhodamine B (RhB) | photocatalytic removal | 30 | 73 | 54 |
| black 5 | membrane | 40 | 70.7 | 55 |
| Red195 | adsorption- photodegradation | 35 | 89.5 | 56 |
| Red195 | ultrafiltration membranes | 40 | 88 | 57 |
| yellow dyes | photodegration | 60 | 91 | 58 |
| Methylene blue | Biodegration | 60 | 85 | 59 |
| Methylene blue | photodegration | 75 | 85 | 60 |
| Methylene blue | Photodegration–visible light | 120 | 90 | 61 |
| Organic dye | Sonophotocatalyst | 20 | 98 | 13 |
| Red195 | Sonophotocatalyst | 20 | 92 | 20 |
| Rhodamine b | Sonophotocatalyst | 240 | 92 | 19 |
| Acid red 14 | Sonophotocatalyst | 21 | 100 | 49 |
| Victoria blue | Sonophotocatalyst | 60 | 71.97 | 18 |
| Yellow AB and Remazol brilliant Violet-5R | Sonophotocatalyst | 30 | 95.5–88.9 | 17 |
Conclusion
In the present investigation, Scendesmus/Fe3O4/TiO2 was synthesized as a novel sonophotocatalyst for degrading R195 dye. Diagnostic analyses such as SEM, mapping, FTIR, and VSM confirmed the efficacy of the TiO2 coating on Scendesmus/Fe3O4 and the resulting photocatalyst. Scendesmus/Fe3O4/TiO2 nanoparticles are effective against sonolysis, photolysis, adsorption, and photocatalytic processes when exposed to ultraviolet light and ultrasonic waves. The R195 removal efficiency increases as operating parameters such as photocatalyst dosage, ultrasound power, radiation power, and exposure time are increased, but decreases as initial pH and initial R195 concentration are increased. Under optimal conditions, such as a pH of 5, a photocatalyst dosage of 62.5 mg/l, an exposure duration of 22 min, an initial R195 concentration of 125 mg/m3, and a US power of 65W, the maximum R195 removal was 100%. According to the proposed quadratic model, the concentration of R195 was the most significant variable because of its high F-value. The Freundlich isotherm model and the intra-particle diffusion model best fit the experimental data when taking into account the heterogeneous surface of the photocatalyst and multilayer adsorption. Thermodynamic analysis has confirmed that endothermic and nonspontaneous adsorption processes occur. Under repeated irradiation from the United States, the recycled Scendesmus/Fe3O4/TiO2 demonstrates exceptional activity and regular stability for pesticide removal. The addition of different scavengers to evaluate the active species of the sonophotocatalytic process revealed that all three species, O2, •OH, and h+, were produced during the process and that h+ is the active species in the degradation of R195 into CO2 and H2O. The Scendesmus/Fe3O4/TiO2 photocatalyst was deemed a novel sonophotocatalyst for the mineralization of R195 based on analyses of various parameters and stability experiments. In conclusion, the transformation of scendesmus into a photocatalyst can not only eliminate the need for additional R195 degradation and reduce the cost of wastewater treatment, but also provide a valuable and efficient photocatalyst at a lower cost than commercial Microalgae that contributes to environmental preservation.
Acknowledgements
This research was carried out with the financial support of the Iran National Science Foundation (INSF Grant No. 99030163). Also the authors give special thanks to the Gorgan and Kurdistan University of Agricultural Sciences and Natural Resources.
Author contributions
W.Z. and S. R. Generated the idea, Methodology, Data curation, Investigation Writing- Original draft preparation, A.H.: Conceptualization, Validation, Investigation, Writing – review & editing. All authors have read and agreed to the published version of the manuscript.
Data availability
The data and materials from the current study are available from the corresponding author on reasonable request.
Competing interests
The authors declare no competing interests.
Footnotes
Publisher's note
Springer Nature remains neutral with regard to jurisdictional claims in published maps and institutional affiliations.
Contributor Information
Wahid Zamani, Email: w.zamani@uok.ac.ir.
Saeedeh Rastgar, Email: saeedehrastgar@yahoo.com.
References
- 1.Bichave MS, Kature AY, Koranne SV, Shinde RS, Gongle AS, Choudhari VP, Topare NS, Raut-Jadhav S, Bokil SA. Nano-metal oxides-activated carbons for dyes removal: A review. Mater. Today: Proc. 2023;77:19–30. [Google Scholar]
- 2.Vaiano V, De Marco I. Removal of azo dyes from wastewater through heterogeneous photocatalysis and supercritical water oxidation. Separations. 2023;10(4):230. [Google Scholar]
- 3.Chen H, Liu K, Yang E, Chen J, Gu Y, Wu S, Yang M, Wang H, Wang D, Li H. A critical review on microbial ecology in the novel biological nitrogen removal process: Dynamic balance of complex functional microbes for nitrogen removal. Sci. Total Environ. 2023;857:159462. doi: 10.1016/j.scitotenv.2022.159462. [DOI] [PubMed] [Google Scholar]
- 4.Solayman, H. M., Hossen, M. A., Abd Aziz, A., Yahya, N. Y., Hon, L. K., Ching, S. L., Monir, M. U., & Zoh, K.-D. Performance evaluation of dye wastewater treatment technologies: A review. J. Environ. Chem. Eng., 109610, (2023).
- 5.Rastgar, S., Rezaei, H., Younesi, H., Abyar, H., & Kordrostami, A. (2023). Photocatalytic degradation of methylene blue (MB) dye under UV light irradiation by magnetic diesel tank sludge (MDTS). Biomass Conversion and Biorefinery, 1–12.
- 6.Mousavi SE, Younesi H, Bahramifar N, Tamunaidu P, Karimi-Maleh H. A novel route to the synthesis of α-Fe2O3@ C@ SiO2/TiO2 nanocomposite from the metal-organic framework as a photocatalyst for water treatment. Chemosphere. 2022;297:133992. doi: 10.1016/j.chemosphere.2022.133992. [DOI] [PubMed] [Google Scholar]
- 7.Manna M, Sen S. Advanced oxidation process: A sustainable technology for treating refractory organic compounds present in industrial wastewater. Environ. Sci. Pollut. Res. 2023;30(10):25477–25505. doi: 10.1007/s11356-022-19435-0. [DOI] [PubMed] [Google Scholar]
- 8.Rastgar, S., Rezaei, H., Younesi, H., & Abyar, H. (2022). Low-cost magnetic char derived from oily sludge for Methylene Blue dye removal: optimization, isotherm, and kinetic approach. Adv. Environ. Technol.
- 9.Ren G, Li R, Zhao M, Hou Q, Rao T, Zhou M, Ma X. Membrane electrodes for electrochemical advanced oxidation processes: Preparation, self-cleaning mechanisms and prospects. Chem. Eng. J. 2023;451:138907. [Google Scholar]
- 10.Khoo KS, Ahmad I, Chew KW, Iwamoto K, Bhatnagar A, Show PL. Enhanced microalgal lipid production for biofuel using different strategies including genetic modification of microalgae: A review. Progress Energy Combust. Sci. 2023;96:101071. [Google Scholar]
- 11.Ritu JR, Ambati RR, Ravishankar GA, Shahjahan M, Khan S. Utilization of astaxanthin from microalgae and carotenoid rich algal biomass as a feed supplement in aquaculture and poultry industry: An overview. J. Appl. Phycol. 2023;35(1):145–171. [Google Scholar]
- 12.Das P, Nisa S, Debnath A, Saha B. Enhanced adsorptive removal of toxic anionic dye by novel magnetic polymeric nanocomposite: Optimization of process parameters. J. Dispersion Sci. Technol. 2022;43(6):880–895. [Google Scholar]
- 13.Wang G, Cheng H. Application of photocatalysis and sonocatalysis for treatment of organic dye wastewater and the synergistic effect of ultrasound and light. Molecules. 2023;28(9):3706. doi: 10.3390/molecules28093706. [DOI] [PMC free article] [PubMed] [Google Scholar]
- 14.Wang G, Cheng H. Facile synthesis of a novel recyclable dual Z-scheme WO3/NiFe2O4/BiOBr composite with broad-spectrum response and enhanced sonocatalytic performance for levofloxacin removal in aqueous solution. Chem. Eng. J. 2023;461:141941. [Google Scholar]
- 15.Naderi A, Firooz MH, Gharibzadeh F, Giannakis S, Ahmadi M, Kalantary RR, Kakavandi B. Anchoring ZnO on spinel cobalt ferrite for highly synergic sono-photo-catalytic, surfactant-assisted PAH degradation from soil washing solutions. J. Environ. Manag. 2023;326:116584. doi: 10.1016/j.jenvman.2022.116584. [DOI] [PubMed] [Google Scholar]
- 16.Esmaeili A, Kiadeh SPH, Pirbazari AE, Saraei FEK, Pirbazari AE, Derakhshesh A, Tabatabai-Yazdi F-S. CdS nanocrystallites sensitized ZnO nanosheets for visible light induced sonophotocatalytic/photocatalytic degradation of tetracycline: From experimental results to a generalized model based on machine learning methods. Chemosphere. 2023;332:138852. doi: 10.1016/j.chemosphere.2023.138852. [DOI] [PubMed] [Google Scholar]
- 17.Aziz, N., Rasool, S., Ullah, T., Khitab, F., Halim, S. A., Bawazeer, S., Khan, A., & Al-Harrasi, A.. Sonophotocatalytic Degradation of Fast Yellow AB and Remazol Brilliant Violet-5R by Using Ag-Impregnated ZnO as a Photocatalyst. ACS Omega, (2023) [DOI] [PMC free article] [PubMed]
- 18.Dey, A., & Gogate, P. R. Ultrasound assisted synthesis of Fe‐TiO2 and Ce‐TiO2 catalysts and subsequent application for photocatalytic, sonocatalytic, and sonophotocatalytic decolorization of basic Victoria blue dye. Environ. Quality Manage., (2023)
- 19.Vieira, V. E. M., Lopes, F. H. P., Noleto, L. F. G., Costa, M. J. S., Silva, R. M. P., Gusmão, G. O. M., Cruz-Filho, J. F., Santos, F. E. P., Cavalcante, L. S., & Luz Jr, G. E. Sonophotocatalytic degradation of Rhodamine b dye on MgWO4 crystals modified with AgNPs. J. Photochem. Photobiol. A Chem., 114943 (2023).
- 20.Kucukcongar S, Alwindawi AGJ, Turkyilmaz M, Ozaytekin I. Reactive dye removal by photocatalysis and sonophotocatalysis processes using Ag/TiO2/Fe3O4 nanocomposite. Water, Air, Soil Pollut. 2023;234(2):103. [Google Scholar]
- 21.Zazouli, M. A., Asghari, S., Tarrahi, R., Lisar, S. Y. S., Babanezhad, E., & Dashtban, N. (2023). The potential of common duckweed (Lemna minor) in phytoremediation of phenanthrene and pyrene. Environ. Eng. Res., 28(1).
- 22.Esania Z, Younesi H, Nowrouzi M, Karimi-Maleh H. Characterization and assessment of the photocatalytic activity of ZnO-Fe3O4/TiO2 nanocomposite based on MIL-125 (Ti) synthesized by mixed solvo-hydrothermal and sol-gel methods. J. Water Process Eng. 2022;47:102750. [Google Scholar]
- 23.Alswat, A. A., Ashmali, A. M., Alqasmi, T. M., Alhassani, H. R., & Alshorifi, F. T. Role of nanohybrid NiO–Fe3O4 in enhancing the adsorptive performance of activated carbon synthesized from Yemeni-Khat leave in removal of Pb (II) and Hg (II) from aquatic systems. Heliyon, 9(3), (2023).. [DOI] [PMC free article] [PubMed]
- 24.Verma, K., & Moholkar, V. S. Mineralization of industrial wastewater by a hybrid technique of adsorption (Fe3O4@ AC nanocomposite)+ heterogeneous fenton+ sonication and discernment of synergistic effects. Industrial & Eng. Chem. Res, (2023).
- 25.Voisin F, Lelong G, Guigner JM, Bizien T, Mallet JM, Carn F. Charge-driven arrested phase-separation of polyelectrolyte-gold nanoparticle assemblies leading to plasmonic oligomers. J. Colloid Interface Sci. 2023;630:355–364. doi: 10.1016/j.jcis.2022.08.076. [DOI] [PubMed] [Google Scholar]
- 26.Santos, E., & Schmickler, W. The potential of zero charge of a metal electrode and the surface potential of water from simulations. Current Opinion Electrochem., 101208 (2023).
- 27.Dhull, P., Sudhaik, A., Raizada, P., Thakur, S., Nguyen, V.-H., Van Le, Q., Kumar, N., Khan, A. A. P., Marwani, H. M., & Selvasembian, R. (2023). An overview on ZnO-based sonophotocatalytic mitigation of aqueous phase pollutants. Chemosphere, 138873. [DOI] [PubMed]
- 28.Yun K, Saravanakumar K, Jagan G, Yea Y, Yoon Y, Park CM. Fabrication of highly effective Ag6Si2O7/SmFeO3 heterojunction with synergistically enhanced sonophotocatalytic degradation of ciprofloxacin and production of H2O2: Influencing factors and degradation mechanism. Chem. Eng. J. 2023;468:143491. [Google Scholar]
- 29.Ding H, Tong G, Sun J, Ouyang J, Zhu F, Zhou Z, Zhou N. Regeneration of methylene blue-saturated biochar by synergistic effect of H2O2 desorption and peroxymonosulfate degradation. Chemosphere. 2023;316:137766. doi: 10.1016/j.chemosphere.2023.137766. [DOI] [PubMed] [Google Scholar]
- 30.Bayuo, J., Rwiza, M. J., & Mtei, K. M. (2023). Non-competitive and competitive detoxification of As (III) ions from single and binary biosorption systems and biosorbent regeneration. Biomass Convers. and Biorefinery, 1–28 (2023).
- 31.Fouad M. Physical characteristics and Freundlich model of adsorption and desorption isotherm for fipronil in six types of Egyptian soil. Current Chem. Lett. 2023;12(1):207–216. [Google Scholar]
- 32.Adedeji OM, Jahan K. Removal of pollutants from aqueous product of Co-hydrothermal liquefaction: Adsorption and isotherm studies. Chemosphere. 2023;321:138165. doi: 10.1016/j.chemosphere.2023.138165. [DOI] [PubMed] [Google Scholar]
- 33.Javed I, Hanif MA, Rashid U, Nadeem F, Alharthi FA, Kazerooni EA. Enhancing functionalities in nanocomposites for effective dye removal from wastewater: Isothermal, Kinetic thermodynamic aspects. Water. 2022;14(17):2600. [Google Scholar]
- 34.Kostoglou M, Karapantsios TD. Why is the linearized form of pseudo-second order adsorption kinetic model so successful in fitting batch adsorption experimental data? Colloids Interfaces. 2022;6(4):55. [Google Scholar]
- 35.Liu B, Finkel M, Grathwohl P. First order approximation for coupled film and intraparticle pore diffusion to model sorption/desorption batch experiments. J. Hazard. Mater. 2022;429:128314. doi: 10.1016/j.jhazmat.2022.128314. [DOI] [PubMed] [Google Scholar]
- 36.Liu W, Song X, Na Z, Li G, Luo W. Strategies to enhance micropollutant removal from wastewater by membrane bioreactors: Recent advances and future perspectives. Bioresource Technol. 2022;344:126322. doi: 10.1016/j.biortech.2021.126322. [DOI] [PubMed] [Google Scholar]
- 37.Yaacob, N. A., Khasri, A., Ridzuan, M. J. M., Salleh, N. H. M., & Chaijak, P. (2023). Synergistic Adsorption/Photodegradation of Ciprofloxacin by UV light-driven Nanocomposite Photocatalyst of Cu doped AC/TiO2: Experimental design via RSM-CCD.
- 38.Pestana CJ, Hui J, Camacho-Muñoz D, Edwards C, Robertson PKJ, Irvine JTS, Lawton LA. Solar-driven semi-conductor photocatalytic water treatment (TiO2, g-C3N4, and TiO2+ g-C3N4) of cyanotoxins: Proof-of-concept study with microcystin-LR. Chemosphere. 2023;310:136828. doi: 10.1016/j.chemosphere.2022.136828. [DOI] [PubMed] [Google Scholar]
- 39.Escamilla, J. C., Hidalgo-Carrillo, J., Martín-Gómez, J., López Tenllado, F. J., Estévez, R., Marinas, A., & Urbano, F. J. Biochars from olive stones as Carbonaceous support in Pt/TiO2-Carbon Photocatalysts and application in hydrogen production from aqueous glycerol photoreforming. (2023). [DOI] [PMC free article] [PubMed]
- 40.Vasiraja N, Prabhahar RSS, Joshua A. Preparation and Physio-Chemical characterisation of activated carbon derived from prosopis juliflora stem for the removal of methylene blue dye and heavy metal containing textile industry effluent. J. Cleaner Prod. 2023;397:136579. [Google Scholar]
- 41.Tahir H, Saad M, Attala OA, El-Saoud WA, Attia KA, Jabeen S, Zeb J. Sustainable synthesis of iron-zinc nanocomposites by azadirachta indica leaves extract for RSM-optimized sono-adsorptive removal of crystal violet dye. Materials. 2023;16(3):1023. doi: 10.3390/ma16031023. [DOI] [PMC free article] [PubMed] [Google Scholar]
- 42.Buelvas DDA, Camargo LP, Salgado IKI, Vicentin BLS, Valezi DF, Dall’Antonia LH, Tarley CRT, Di Mauro E. Study and optimization of the adsorption process of methylene blue dye in reusable polyaniline-magnetite composites. Synthetic Metals. 2023;292:117232. [Google Scholar]
- 43.Gohari RM, Safarnia M, Koohi AD, Salehi MB. Adsorptive removal of cationic dye by synthesized sustainable xanthan gum-g p (AMPS-co-AAm) hydrogel from aqueous media: Optimization by RSM-CCD model. Chemi. Eng. Res. Design. 2022;188:714–728. [Google Scholar]
- 44.El Khomri M, El Messaoudi N, Dbik A, Bentahar S, Fernine Y, Lacherai A, Jada A. Optimization based on response surface methodology of anionic dye desorption from two agricultural solid wastes. Chem Africa. 2022;5(4):1083–1095. [Google Scholar]
- 45.El Amri, A., Kadiri, L., Hsissou, R., Lebkiri, A., Wardighi, Z., & Lebkiri, A. (2023). Investigation of Typha Latifolia (TL) as potential biosorbent for removal of the methyl orange anionic dye in the aqueous solution. Kinetic and DFT approaches. Journal of Molecular Structure, 1272, 134098.
- 46.Nangia S, Katyal D, Warkar SG. Thermodynamics, kinetics and isotherm studies on the removal of anionic Azo-dye (Congo red) using synthesized Chitosan/Moringa oleifera gum hydrogel composites. Sep. Sci. Technol. 2023;58(1):13–28. [Google Scholar]
- 47.Amin MT, Alazba AA, Shafiq M. Successful application of eucalyptus camdulensis biochar in the batch adsorption of crystal violet and methylene blue dyes from aqueous solution. Sustainability. 2021;13(7):3600. [Google Scholar]
- 48.Motlagh, P. Y., Vahid, B., Akay, S., Kayan, B., Yoon, Y., & Khataee, A. US-assisted photocatalytic degradation of various organic contaminants using ZnO supported on a natural polymer of sporopollenin. USs Sonochem., 106486, (2023). [DOI] [PMC free article] [PubMed]
- 49.Al-Hawary SIS, Rahimpoor R, Rahmani A, Romero-Parra RM, Ramírez-Coronel AA, Alhachami FR, Mengelizadeh N, Balarak D. Enhanced sonophotocatalytic degradation of acid red 14 using Fe3O4@ SiO2/PAEDTC@ MIL-101 (Fe) based on metal-organic framework. Catalysts. 2023;13(2):411. [Google Scholar]
- 50.Preeyanghaa M, Erakulan ES, Thapa R, Ashokkumar M, Neppolian B. Scrutinizing the role of tunable carbon vacancies in g-C3N4 nanosheets for efficient sonophotocatalytic degradation of Tetracycline in diverse water matrices: Experimental study and theoretical calculation. Chem. Eng. J. 2023;452:139437. [Google Scholar]
- 51.Debnath S, Das R. Strong adsorption of CV dye by Ni ferrite nanoparticles for waste water purification: Fits well the pseudo second order kinetic and Freundlich isotherm model. Ceram. Int. 2023;49(10):16199–16215. [Google Scholar]
- 52.Li H, Xian T, Di L, Sun X, Sun C, Ma K, Ma X, Dai J, Yang H. Constructing Z-scheme AuAg@ δ-Bi2O3/BiOBr multi-heterojunction for efficient photocatalytic removal of dye, antibiotic and heavy metal ions: Performance and mechanism investigation. Opt. Mater. 2023;136:113487. [Google Scholar]
- 53.Zhao B, Zhao Y, Liu P, Men Y-L, Pan Y-X. Boosting the adsorption and removal of dye from water by COOH-functionalized carbon nanotubes. Green Chem. Eng. 2023;4(1):88–98. [Google Scholar]
- 54.Haounati R, Ighnih H, Malekshah RE, Alahiane S, Alakhras F, Alabbad E, Alghamdi H, Ouachtak H, Addi AA, Jada A. Exploring ZnO/Montmorillonite photocatalysts for the removal of hazardous RhB Dye: A combined study using molecular dynamics simulations and experiments. Mater. Today Commun. 2023;35:105915. [Google Scholar]
- 55.Keskin B, Mehrabani SAN, Arefi-Oskoui S, Vatanpour V, Teber OO, Khataee A, Orooji Y, Koyuncu I. Development of Ti2AlN MAX phase/cellulose acetate nanocomposite membrane for removal of dye, protein and lead ions. Carbohydr. Polym. 2022;296:119913. doi: 10.1016/j.carbpol.2022.119913. [DOI] [PubMed] [Google Scholar]
- 56.Arshia MH, Sheshmani S, Shahvelayati AS, Hajiaghababaei L, Ghasri MRA. Intercalated chitosan-ionic liquid ionogel in SnO nanoplate: band gap narrow and adsorption-photodegradation process. Int. J. Biol. Macromol. 2023;234:123660. doi: 10.1016/j.ijbiomac.2023.123660. [DOI] [PubMed] [Google Scholar]
- 57.Safarpour M, Najjarizad-Peyvasti S, Khataee A, Karimi A. Polyethersulfone ultrafiltration membranes incorporated with CeO2/GO nanocomposite for enhanced fouling resistance and dye separation. J. Environ. Chem. Eng. 2022;10(3):107533. [Google Scholar]
- 58.Yasin M, Saeed M, Muneer M, Usman M, Ul Haq A, Sadia M, Altaf M. Development of Bi2O3-ZnO heterostructure for enhanced photodegradation of rhodamine B and reactive yellow dyes. Surf. Interfaces. 2022;30:101846. [Google Scholar]
- 59.Karaghool HAK, Hashim K, Kot P, Muradov M. Preliminary studies of methylene blue remotion from aqueous solutions by ocimum basilicum. Environments. 2022;9(2):17. [Google Scholar]
- 60.Ruchi N, Bamne J, Singh N, Sharma PK, Singh P, Umar A, Haque FZ. Synthesis of titania/silica nanocomposite for enhanced photodegradation of methylene blue and methyl orange dyes under uv and mercury lights. ES Mater. Manuf. 2022;16:78–88. [Google Scholar]
- 61.Elanthamilan E, Elizabeth IB, Wang S-F, Lydia IS. Strontium hexaferrite microspheres: Synthesis, characterization and visible-light-driven photocatalytic activity towards the degradation of methylene blue dye. Optical Materials. 2023;137:113565. [Google Scholar]
Associated Data
This section collects any data citations, data availability statements, or supplementary materials included in this article.
Data Availability Statement
The data and materials from the current study are available from the corresponding author on reasonable request.