

Abstract
Pseudomonas aeruginosa is an opportunistic human pathogen capable of causing a wide range of diseases in immunocompromised patients. In order to better understand P. aeruginosa behavior and virulence and to advance drug therapies to combat infection, it would be beneficial to understand how P. aeruginosa cells survive stressful conditions, especially environmental stressors. Here, we report on a strategy that measures potential-dependent fluorescence of individual P. aeruginosa cells, as a sentinel, for cellular response to starvation, hunger, and oxidative stress. This is accomplished using a micropore electrode array capable of trapping large numbers of isolated, vertically oriented cells at well-defined spatial positions in order to study large arrays of single cells in parallel. We find that conditions promoting either starvation or oxidative stress produce discernible changes in the fluorescence response, demonstrated by an increase in the prevalence of fluorescence transients, one of three canonical spectroelectrochemical behaviors exhibited by single P. aeruginosa cells. In contrast, more modest nutrient limitations have little to no effect on the spectroelectrochemical response when compared to healthy cells in the stationary phase. These findings demonstrate the capabilities of micropore electrode arrays for studying the behavior of single microbial cells under conditions where the intercellular spacing, orientation, and chemical environment of the cells are controlled. Realizing single-cell studies under such well-defined conditions makes it possible to study fundamental stress responses with unprecedented control.
Keywords: Pseudomonas aeruginosa, single cell, spectroelectrochemistry, stress, micropore array
Introduction
Pseudomonas aeruginosa is a rod-shaped Gram-negative bacterium and opportunistic pathogen found in freshwater and soils. Although healthy humans rarely develop infections, P. aeruginosa can produce serious illnesses in patients with weak or nonfunctioning immune systems, as commonly encountered within hospital settings.1−6 In addition, many pathogenic strains of P. aeruginosa present the additional challenge of antibiotic resistance (AR)—the 2019 AR report from the Centers for Disease Control and Prevention reported that P. aeruginosa infections have a high rate of morbidity and mortality with 13% of strains exhibiting some form of multidrug resistance.7P. aeruginosa utilizes a number of regulatory mechanisms that ultimately affect virulence, cell communication, and signaling. These mechanisms can up- or down-regulate genetic factors and proteins and include efflux pumps that can expel antibiotics of different sizes and scavenging mechanisms that enhance acquisition of nutrients from the host environment. Because these mechanisms are important to virulence, they have been topics of intensive research.8−11
The link between environmental stressors and cell response is closely related to the connections between signaling behaviors that are activated in times of stress, such as cell population-dependent quorum sensing (QS) and the bacterial stringent response (SR), a stress response triggered by environmental conditions such as limited availability of nutrients, heat shock, or oxidative stress.12 For example, Nguyen and co-workers studied the effects of SR on biological functions such as the biosynthesis of alkyl quinolones (AQ)s necessary to create the Pseudomonas Quinolone Signal (PQS) QS signal of P. aeruginosa,13 as well as resistance to antibiotics and reactive oxygen species14 and starvation responses15 important in bacterial pathogenesis.16 The sensitivity of these mechanisms to environmental perturbations was demonstrated by Cao et al., who used confocal Raman microspectroscopy to track the distribution of AQs secreted by P. aeruginosa, detailing the differences in the appearance of PQSs and other AQs under varying metabolic and competitive stress conditions.17 A number of recent reviews describe how phenotypic heterogeneities and mutagenesis result from nutritional stress, oxidative stress, and cell signaling activated by SR.18−21
Clearly, the ability to study genetic or phenotypic heterogeneities that arise in response to external factors, such as stress or antibiotic treatment, is a crucial step toward furthering our understanding of bacterial behavior. Typically, these studies are conducted on bacterial biofilms or planktonic cultures, in which the spatial and orientational relationships among different bacterial cells are not controlled. In addition, because bacterial behavior is most often studied at the level of colonies or other large assemblies, unique cellular behaviors can be masked by ensemble averaging over many individual bacterial cells. To address these challenges, methods of interrogating individual bacterial cells are being developed.22−26 For example, optical27,28 and electrochemical29,30 approaches have been combined to characterize microbial behavior at the single-cell level through the use of electrochemical zero-mode waveguides, nanogap sensors, and single nanoparticles.31−34 Furthermore, work from our laboratories has produced a micropore electrode array (MEA) device consisting of parallel micropores, each capable of trapping a single P. aeruginosa cell in a vertical orientation and probing them spectroelectrochemically. Demonstrating the utility of this approach to studying large arrays of single cells under rigorous spatial and orientational control, initial studies showed the existence of three characteristic fluorescence responses from single cells—responses that are hidden, as a result of bulk averaging, when the entire array is interrogated at once.35
Here, we exploit the capabilities of the MEA architecture for studies of large parallel arrays of single cells by applying them to characterize how the potential-dependent fluorescence of single P. aeruginosa cells varies in the presence of environmental and metabolic stressors. Three different stress conditions are explored: (1) limitation of nutrients during initial culture and growth to induce a carbon-limited response, (2) restriction of nutrients after cell collection in the stationary phase to induce starvation, and (3) the addition of exogenous reactive oxygen species (ROS), such as H2O2, to produce an oxidative stress response. The results reported here show that both starvation and oxidative stress produce changes in the fluorescence behavior in the form of an increase in the fraction of cells exhibiting fluorescence transients, while cells exposed to carbon-limited conditions do not display any significant changes in fluorescence response. The work reported here—using the MEA to regulate the environment of individual cells, to obviate the effects of ensemble averaging, and to examine large numbers of single cells in parallel—demonstrates that external stresses experienced by a cell population can be monitored at the single-cell level as a function of environmental perturbations. These capabilities enable experiments that promise to further our understanding of fundamental microbial behaviors as a result of different environmental conditions or stressors.
Results and Discussion
Micropore Electrode Arrays
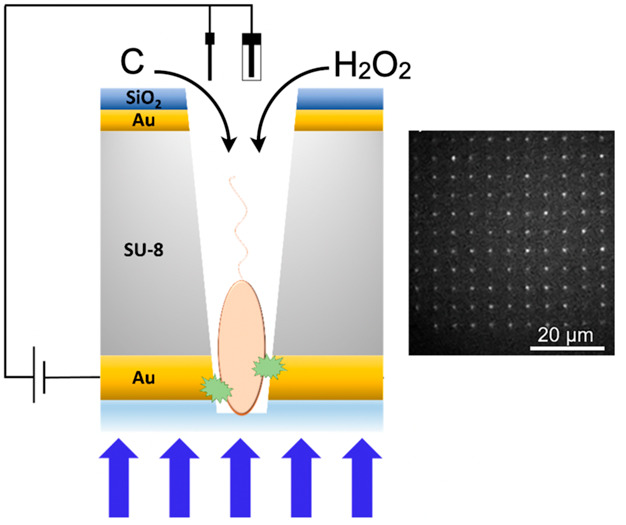
Work described here was carried out in a specially designed device, the MEA, that enables the study of large arrays of single bacteria—here rod-shaped P. aeruginosa cells—with well-defined translational and orientational order. The MEA is designed (see the Supporting Information) to be geometrically complementary to single mature P. aeruginosa cells, so that once captured within the micropores, single cells are trapped by their propensity to secrete extracellular polymeric substances, effectively fixing them to the interior of the pore. Furthermore, each pore in the array is equipped with an annular Au working electrode placed at the silica interface to perturb the cell medium electrochemically, and the MEA is constructed so that microspectroscopy can be carried out by collecting the emitted bacterial luminescence through the epi-illumination objective, so that the emission from a single pore originates from a single bacterial cell.
Previously, we described the use of the MEA to characterize arrays of single P. aeruginosa and Escherichia coli cells spectroelectrochemically.35 By illuminating the loaded MEA device with 458 nm incident light and applying a potential to the bottom gold layer, optically active redox active biomolecules, such as flavoenzymes within the bacterial cells, can be imaged by exploiting the 2e–/2H+ reaction:
where the flavin exhibits bright fluorescence in the oxidized state and is nonfluorescent in the reduced state. Applied potential was found to cause three characteristic bacterial fluorescence behaviors: (a) potential-modulated fluorescence where the fluorescence intensity modulates with the applied electrochemical potential, (b) sporadic fluorescence transients where the signal maximum exceeds the local average by >3σ, and (c) potential-independent fluorescence. Examples of behaviors (a) and (b) can be found in Figures 1c and 1e, respectively, where the associated histogram for each single-pore time-trace is defined by two distinct Gaussian peaks or by a tailed histogram. Importantly, these single-cell fluorescence behaviors are completely masked by averaging across the subpopulations in ensemble measurements. This unique MEA approach to characterizing arrays of single bacterial cells was used to unearth significant differences in the potential-dependent fluorescence behavior between metabolically active and inactive cells and in the presence and absence of a redox mediator.
Figure 1.

Potential-step fluorescence responses from MEA-captured arrays of single PAO1c P. aeruginosa cells. Each condition shows an example single fluorescence movie frame, corresponding intensity–time trace for one micropore, and associated intensity histograms. Images display the fluorescence behavior of PAO1c P. aeruginosa cells grown with the specified carbon source with the applied potential stepped between Eappl = −0.4 V and Eappl = +0.6 V vs Ag/AgCl in 10 s increments. Initial potential, Eappl = −0.4 V, and the pore from which the time trace is obtained is labeled by a red square for each condition. Black histograms represent the number of occurrences where flavin luminescence is weak, while red histograms represent the number of occurrences where the flavin fluorescence is intense. (a) and (b) PAO1c cells grown in 7.5 and 30 mM glucose, respectively; (c) and (d) 7.5 and 30 mM succinate; (e) and (f) 7.5 and 30 mM glutamate; (g) and (h) 7.5 and 30 mM citrate.
Carbon-Limited Conditions and Starvation
Carbon-limited conditions and starvation are differentiated in cell populations because they invoke different responses. Foster summarized and defined the differences between mutagenic phenomena,18 including carbon-limited conditions, sometimes denoted hunger, and starvation, by defining carbon-limited conditions as the state of a cell population while growing in suboptimal nutrient availability, while starvation is defined by the complete lack of carbon necessary for growth, obtained, for example, by harvesting cells and resuspending them in carbon-free media.
In order to differentiate between cells prepared under carbon-limited and starvation growth conditions, batches of P. aeruginosa cells were prepared separately in each set of conditions, Figure S1, Supporting Information. To compare carbon-limited to carbon-rich conditions, cells were grown in defined medium supplemented with either 7.5 mM (carbon-limited) or 30 mM (carbon-rich) of the relevant carbon source—glucose, succinate, glutamate, or citrate. These cells were then collected and introduced to the MEA device following procedures described in the Supporting Information.35 Starved cells were grown in conditions similar to those used for carbon-limited cells, except that after collection and washing in 1× PBS, the cells were kept at room temperature and humidity levels absent an extraneous carbon source for 24 h, before being introduced to the MEA device for study.
Effect of Carbon Source and Amount
First, the effects of carbon source and amount during growth on the fluorescence responses of single P. aeruginosa cells were examined. Previously, Shrout and co-workers showed that the source of carbon can impact specific behaviors of P. aeruginosa, such as surface motility and biofilm development, in cellular communities.36,37 In order to investigate the effect of carbon source and amount at the single-cell level, P. aeruginosa cultures were grown in a medium supplied with a single carbon source chosen from among glucose, succinate, glutamate, and citrate, at either 7.5 or 30 mM, i.e., carbon-limited or carbon-rich conditions, respectively. Subsequently, step-potential-mediated fluorescence of MEA-captured arrays of single P. aeruginosa cells was studied, as shown in Figure 1. The left, Figures 1a, c, e, and g, and right, Figures 1b, d, f, and h, columns show potential-mediated fluorescence characteristics for cells grown under carbon-limited and carbon-rich conditions, respectively. The rows show images obtained from cells grown on a specific carbon source, along with a representative intensity time trace for three periods of a square potential waveform −0.4 V ≤ Eappl ≤ + 0.6 V vs Ag/AgCl and the intensity histogram associated with the intensity–time trace. Several specific features are clear in the data. First, all eight intensity–time traces exhibit potential-dependent fluorescence—either potential-modulated fluorescence or fluorescence transients—two of the characteristic potential-dependent behaviors described in the original characterization of the single-cell MEA device.35 Second, the polarity of the potential modulation agrees with that observed previously for single cells of both P. aeruginosa and E. coli, i.e., fluorescence is more intense at negative potentials, Eappl = −0.4 V, and less intense at positive potentials, Eappl = +0.6 V vs. Ag/AgCl. Interestingly, even though the observed luminescence largely arises from flavin-containing species, this polarity is opposite that observed for freely diffusing flavins, which are more highly fluorescent at oxidizing potentials than at reducing potentials. It is important to note that intensity–time traces shown in Figure 1 are specific, not average, responses, i.e., different pores, corresponding to different single cells, can exhibit distinct intensity–time traces. For comparison, additional single-pore intensity–time traces are displayed in Figure S4.
Figure 2 illustrates the frequency of the three canonical fluorescence behaviors—potential-independent, potential-modulated, and fluorescence transients—as a function of metabolic stress as represented by the source and level of available carbon. Cells grown in carbon-rich media employing any of the four carbon sources display more potential-dependent fluorescence behaviors overall compared to cells grown in carbon-limited media. In carbon-rich conditions, potential-modulated fluorescence dominates both of the other behaviors for all four carbon sources. In addition, cells grown under carbon-limited conditions (7.5 mM carbon source) exhibit potential-independent fluorescence more frequently than cells grown in 30 mM carbon source, as much as ca. 25–33% as often as potential-modulated fluorescence. In addition, relatively few fluorescence transients are observed independent of metabolic conditions. Because these trends are relatively consistent across all four carbon sources, we conclude that the amount of available carbon is more important than its source in determining the propensity of cells to exhibit potential-dependent fluorescence and the specific types of fluorescence behaviors observed. This agrees with prior work that acknowledges carbon to be a limiting factor in bacterial growth and function, where sufficient carbon is necessary for survival, and is consistent with the appearance of fluorescence transients at higher nutrient concentrations, especially for glucose.22−24
Figure 2.
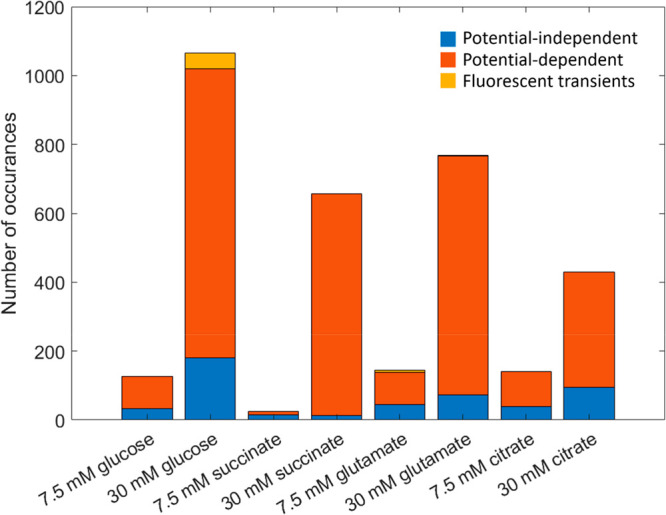
Frequency of the three canonical potential-dependent fluorescence behaviors of single P. aeruginosa cells as a function of metabolic condition. Stacked bar plot comparing the number of occurrences of the three behaviors as a function of growth conditions, comparing nutrient-limited (7.5 mM carbon source) to nutrient-rich conditions (30 mM) for PAO1c P. aeruginosa cells: potential-independent fluorescence (blue), potential-modulated fluorescence (red), and fluorescence transients (yellow). In total, 1192 cells were probed with glucose, 681 with succinate, 912 with glutamate, and 571 with citrate.
Carbon Restriction after Cell Collection
Previously, we reported that P. aeruginosa cells display increased potential-dependent fluorescence intensity modulation when kept in suboptimal conditions.35 These effects were especially noticeable when electron transport from the working electrode to the cell within the pore was supplemented with a redox mediator. The results just presented address the effects of carbon restriction during initial growth on potential-dependent fluorescence. Next, carbon restriction was extended to starvation levels by storing P. aeruginosa cells under carbon-free conditions for 24 h after growth and prior to being added to the MEA device for analysis.
Figures 3a and 3b show single-pore intensity–time traces for representative movies taken of freshly collected cells grown in 7.5 and 30 mM glucose respectively, while Figures 3c and 3d represent the corresponding single-pore intensity–time traces for movies taken of cells grown under the same conditions but subjected to starvation conditions after growth. Additional single-pore intensity–time traces can be found in Figure S5. Potential-modulated fluorescence is still the dominant behavior for most combinations of carbon source and concentration. However, there is a significant increase in the frequency of potential-independent behavior in starved cells, regardless of carbon source used during culturing. One clear contributor to this observation is that more metabolically inactive and/or dead cells are encountered under starvation conditions.
Figure 3.

Fluorescence response to starvation conditions in single PAO1c cells. Each panel contains a single frame taken from the recorded movie, the potential–time trace for the experiment, a single-pore intensity–time trace, and the histogram associated with the time trace. Red boxes indicate the pore from which the time trace was recorded. Black histograms represent the number of occurrences where flavin luminescence is weak, while red histograms represent the number of occurrences where the flavin fluorescence is intense. (a) and (b) Freshly collected cells; (c) and (d) cells starved by suspension for 24 h in nutrient-free 1× PBS buffer. Additionally, the amount of carbon source during growth was varied: (a) and (c) cells grown in 7.5 mM glucose; (b) and (d) cells grown in 30 mM glucose.
It is also clear from the fluorescence intensity–time data that the depth of potential modulation is much greater for cells grown in 30 mM glucose, but then subjected to starvation conditions, than in any of the other three conditions. This observation is consistent with 30 mM glucose being sufficient to establish a fully functional metabolism, after which starvation depletes the store of electrons. As observed in our previous spectroelectrochemical investigation of MEA-captured P. aeruginosa, the application of negative potentials supplies electrons to the redox chain supporting bacterial metabolism at the most negative redox couple available, after which they are transferred to successively more positive redox couples and, ultimately, to molecular O2, the terminal electron acceptor. The result of electron injection is that membrane-proximal flavin-containing species, which are responsible for the observed potential-dependent fluorescence, end up in the oxidized (more highly fluorescent) state. Under starvation conditions, normally available electron sources are depleted, so the electrons come predominantly from the exogenous source, i.e., the cathode, and a large depth of modulation results.
Interestingly, fluorescence transients are observed more frequently under starvation conditions. The presence of fluorescence transients has not previously been ascribed to a specific mechanism, although they are generally observed more frequently at oxidizing potentials, consistent with an association of increased fluorescence transients with an increase in stress at the single-cell level. Numerous bacterial responses to stress are well documented. For example, one general stress response in starved cells of E. coli is controlled by the σ-factor RpoS, which increases when cells enter the stationary phase.18 Such a general stress response could explain the increased frequency of fluorescence transient behavior seen in the present experiments. The increased frequency of transients in starved cells compared to cells grown under carbon-limited conditions suggests a mechanism in which the stress response is mediated by severe stress conditions, rather than growth conditions that are merely suboptimal.
Oxidative Stress and Exogenous ROS
Another bacterial stressor that may be encountered in aerobic growth conditions is oxidative stress as a result of exposure to endogenous or exogenous reactive oxygen species.38 Endogenous ROS such as superoxide (O2–•), hydrogen peroxide (H2O2), and hydroxyl radical (OH•) may be generated, for example, from conditions as anodyne as aerobic respiration. Additionally, O2 is the terminal electron acceptor in the aerobic respiration cycle, and if it comes in contact with reduced FAD cofactors within flavoproteins, like monooxygenases or oxidases, it can undergo incomplete reduction to form superoxide and H2O2.39P. aeruginosa, like many microbes, uses catalases to detoxify endogenous ROS and maintain a balanced redox environment within the cell. However, if ROS species build up within the cell faster than catalases can clear them, or if exogenous ROS generated from the host environment as a defense mechanism overwhelm the cell, the bacterial cell can experience oxidative stress at a level sufficient to damage DNA, lipids, and proteins, increase rates of mutagenesis, and ultimately lead to cell death.
In order to explore how potential-induced fluorescence responds to nonmetabolic stress, exogenous ROS was introduced to the MEA micropores in the form of different concentrations of H2O2 added to the cell culture at three different stages: (1) during initial culture in defined medium + 30 mM glucose, (2) during the process of loading the washed and collected cells to the MEA micropores, and (3) after the cells had been loaded into the MEA device. When H2O2 was added during the initial culture, no cells grew after 18 h, most likely indicating that large concentrations of H2O2 result in cell death. Therefore, no data are shown for this condition.
Figure 4 depicts representative single-pore intensity–time traces of MEA single-cell arrays when 0.01%, 0.1%, and 1.0% H2O2 solutions were added either during (condition 2) or after (condition 3) loading. The representative intensity–time traces shown in Figure 4 display clear potential-modulated fluorescence for cells at all three H2O2 concentrations as well as an increase in the frequency that fluorescence transients are observed at the highest concentration, as shown in Figure 5. Furthermore, the data acquired upon exposure to 0.1% and 1.0% make it clear that the fluorescence transients increase in frequency in cells exposed after loading. Similar to starved cells, cells exposed to exogenous H2O2 display an increase in the frequency of fluorescence transients, strengthening the correlation between oxidative stress and fluorescence transients. Furthermore, at both 0.1% and 1.0% concentrations, fluorescence transients increase in cells exposed to H2O2 after loading compared to during loading.
Figure 4.

Fluorescence response upon exposure to exogenous H2O2. Each panel contains a single frame taken from the recorded movie, a single-pore intensity–time trace, and the associated intensity histogram. Example intensity–time traces for PAO1c P. aeruginosa cells exposed either during (left column) or after (right column) cell loading. Black histograms represent the number of occurrences where flavin luminescence is weak, while red histograms represent the number of occurrences where the flavin fluorescence is intense. (a) and (b) cells exposed to 0.01% H2O2; (c) and (d) cells exposed to 0.1% H2O2; (e) and (f) cells exposed to 1.0% H2O2. In each intensity–time plot, the applied potential was stepped between Eappl = −0.4 V and Eappl = +0.6 V vs Ag/AgCl in 10 s increments for 60 s. Initial potential, Eappl = −0.4 V.
Figure 5.
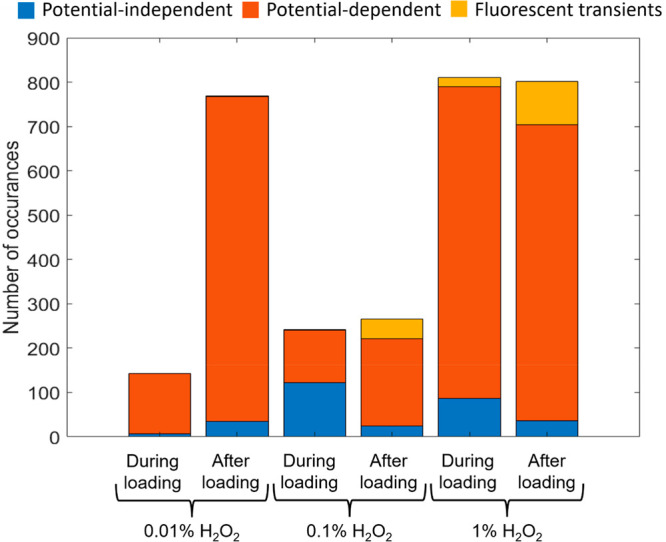
Frequency of the three canonical potential-dependent fluorescence behaviors of single P. aeruginosa cells upon exposure to exogenous ROS. Stacked bar histogram showing potential-independent fluorescence (blue), potential-modulated fluorescence (red), and fluorescence transients (yellow) for each exposure condition.
Control experiments were performed with H2O2, but no cells, loaded into the MEA micropores at 0.01%, 0.1%, and 1.0% concentrations (v:v), Figure S6. H2O2 is not excited by the λ = 458 nm laser used in the fluorescence experiments, so the observed signals arise entirely due to scattering, as shown for the 0.01% and 0.1% (not shown) H2O2 cases. However, 1.0% H2O2 in the absence of cells produces large oscillations in the optical signal as well as fluctuations in the electrochemical signal, which is accentuated by adjusting the sweeping potential window to more oxidizing potentials. This behavior is attributed to bubble nucleation on the gold working electrode. At high enough concentrations, the presence of bubbles destabilizes the system to form an electrochemical oscillator.40,41 These oscillations in signal are not observed when cells are present in the MEA device, likely because the presence of cells disrupts bubble formation.
Conclusions
The impact of carbon source, amount of carbon available, and exogenously introduced H2O2 on the fluorescence response of large arrays of single P. aeruginosa cells captured in MEA devices has been investigated. These studies demonstrate that it is possible to expose a population of cells to an external stimulus and observe their response across large arrays of single cells using MEA devices. Importantly, the magnitude of the fluorescence response to a particular perturbation can be obtained by counting the fraction of cells exhibiting each of the three canonical potential-induced fluorescence behaviors, rather than by an analog response. This suggests a potential application of single-cell arrays as digital sentinels, in which the strength of cellular response to a perturbation is obtained by counting the relative frequency of a particular behavior, such as fluorescence transients. Quantifying responses in this way, by counting rather than assigning an analog intensity, is similar to the use of single-molecule sentinels in approaches, such as SIMOA.42
P. aeruginosa cells grown in carbon-deficient medium exhibit an overall reduction in fluorescence activity across all three canonical single-cell potential-dependent fluorescence behaviors, while starved cells, as well as cells exposed to H2O2, show an increase in fluorescent transients. We hypothesize that the increase in transients results, in part, from general cellular stress responses, such as the stringent response and RpoS, which regulate both starvation and oxidative stress responses. In cells that have not been exposed to exogenous oxidants, like H2O2, it is possible that a natural buildup of ROS as byproducts of aerobic respiration can act as a source of naturally induced oxidative stress, also resulting in an increase in fluorescence transients. Many of these response mechanisms have multiple overlapping functions that will require further study to differentiate. A number of the pathways identified in this study also play a role in multidrug resistance and tolerance, biofilm formation, cell signaling, and virulence, with implications for studies of these effects in microbes. These conclusions are enabled by the unique characteristics of the MEA device, which, because it can simultaneously assess the responses of large numbers of single cells, possesses the ability to assess the effects of treatments at the single-cell level. It may thus enable new avenues for the study of drug therapy and delivery mechanisms as well as research into the formation of drug evasion mechanisms.
Acknowledgments
This work was supported by the National Institute of Allergies and Infectious Diseases through grant R01AI113219 and by the National Science Foundation through grant 2303574. The authors gratefully acknowledge the Notre Dame Nanofabrication Facility and the Notre Dame Integrated Imaging Facility for support in fabrication, characterization, and imaging.
Supporting Information Available
The Supporting Information is available free of charge at https://pubs.acs.org/doi/10.1021/cbmi.3c00083.
Chemicals and materials; bacteria preparation; device fabrication; experimental setup; additional single-pore intensity–time traces for hunger, starvation, and oxidative stress experiments; hydrogen peroxide control experiment (PDF)
The authors declare no competing financial interest.
Supplementary Material
References
- Phillips I. Identification Of Pseudomonas aeruginosa In The Clinical Laboratory. J. Med. Microbiol. 1969, 2 (1), 9–16. 10.1099/00222615-2-1-9. [DOI] [PubMed] [Google Scholar]
- Drenkard E. Antimicrobial resistance of Pseudomonas aeruginosa biofilms. Microb. Infect. 2003, 5, 1213–1219. 10.1016/j.micinf.2003.08.009. [DOI] [PubMed] [Google Scholar]
- Strateva T.; Yordanov D. Pseudomonas aeruginosa-a phenomenon of bacterial resistance. J. Med. Microbiol. 2009, 58 (9), 1133–1148. 10.1099/jmm.0.009142-0. [DOI] [PubMed] [Google Scholar]
- Kerr K. G.; Snelling A. M. Pseudomonas aeruginosa: a formidable and ever-present adversary. J. Hosp. Infect. 2009, 73 (4), 338–344. 10.1016/j.jhin.2009.04.020. [DOI] [PubMed] [Google Scholar]
- Michael C. A.; Dominey-Howes D.; Labbate M. The Antimicrobial Resistance Crisis: Causes, Consequences, and Management. Front. Pub. Health 2014, 2, 145. 10.3389/fpubh.2014.00145. [DOI] [PMC free article] [PubMed] [Google Scholar]
- Christaki E.; Marcou M.; Tofarides A. Antimicrobial Resistance in Bacteria: Mechanisms, Evolution, and Persistence. J. Mol. Evol. 2020, 88 (1), 26–40. 10.1007/s00239-019-09914-3. [DOI] [PubMed] [Google Scholar]
- CDC. Antibitotic Resistance Threats in the United States, 2019; U.S. Department of Health and Human Services, CDC: Atlanta, GA, 2019. [Google Scholar]
- Miriagou V.; Cornaglia G.; Edelstein M.; Galani I.; Giske C. G.; Gniadkowski M.; Malamou-Lada E.; Martinez-Martinez L.; Navarro F.; Nordmann P.; Peixe L.; Pournaras S.; Rossolini G. M.; Tsakris A.; Vatopoulos A.; Cantón R. Acquired carbapenemases in Gram-negative bacterial pathogens: detection and surveillance issues. Clin. Microbiol. Infect. 2010, 16 (2), 112–122. 10.1111/j.1469-0691.2009.03116.x. [DOI] [PubMed] [Google Scholar]
- Nallathamby P. D.; Lee K. J.; Desai T.; Xu X. H. N. Study of the multidrug membrane transporter of single living Pseudomonas aeruginosa cells using size-dependent plasmonic nanoparticle optical probes. Biochemistry 2010, 49, 5942–5953. 10.1021/bi100268k. [DOI] [PMC free article] [PubMed] [Google Scholar]
- Diggle S. P.; Matthijs S.; Wright V. J.; Fletcher M. P.; Chhabra S. R.; Lamont I. L.; Kong X.; Hider R. C.; Cornelis P.; Cámara M.; Williams P. The Pseudomonas aeruginosa 4-Quinolone Signal Molecules HHQ and PQS Play Multifunctional Roles in Quorum Sensing and Iron Entrapment. Chem. Biol. 2007, 14, 87–96. 10.1016/j.chembiol.2006.11.014. [DOI] [PubMed] [Google Scholar]
- Yang L.; Nilsson M.; Gjermansen M.; Givskov M.; Tolker-Nielsen T. Pyoverdine and PQS mediated subpopulation interactions involved in Pseudomonas aeruginosa biofilm formation. Mol. Microbiol. 2009, 74, 1380–1392. 10.1111/j.1365-2958.2009.06934.x. [DOI] [PubMed] [Google Scholar]
- van Delden C.; Comte R.; Bally M. Stringent Response Activates Quorum Sensing and Modulates Cell Density-Dependent Gene Expression in Pseudomonas aeruginosa. J. Bacteriol. 2001, 183 (18), 5376–5384. 10.1128/JB.183.18.5376-5384.2001. [DOI] [PMC free article] [PubMed] [Google Scholar]
- Schafhauser J.; Lepine F.; McKay G.; Ahlgren H. G.; Khakimova M.; Nguyen D. The Stringent Response Modulates 4-Hydroxy-2-Alkylquinoline Biosynthesis and Quorum-Sensing Hierarchy in Pseudomonas aeruginosa. J. Bacteriol. 2014, 196 (9), 1641–1650. 10.1128/JB.01086-13. [DOI] [PMC free article] [PubMed] [Google Scholar]
- Khakimova M.; Ahlgren H. G.; Harrison J. J.; English A. M.; Nguyen D. The Stringent Response Controls Catalases in Pseudomonas aeruginosa and Is Required for Hydrogen Peroxide and Antibiotic Tolerance. J. Bacteriol. 2013, 195 (9), 2011–2020. 10.1128/JB.02061-12. [DOI] [PMC free article] [PubMed] [Google Scholar]
- Nguyen D.; Joshi-Datar A.; Lepine F.; Bauerle E.; Olakanmi O.; Beer K.; McKay G.; Siehnel R.; Schafhauser J.; Wang Y.; Britigan B. E.; Singh P. K. Active Starvation Responses Mediate Antibiotic Tolerance in Biofilms and Nutrient-Limited Bacteria. Science 2011, 334 (6058), 982–986. 10.1126/science.1211037. [DOI] [PMC free article] [PubMed] [Google Scholar]
- Irving S. E.; Choudhury N. R.; Corrigan R. M. The stringent response and physiological roles of (pp)pGpp in bacteria. Nat. Rev. Microbiol. 2021, 19 (4), 256–271. 10.1038/s41579-020-00470-y. [DOI] [PubMed] [Google Scholar]
- Cao T.; Sweedler J. V.; Bohn P. W.; Shrout J. D. Spatiotemporal Distribution of Pseudomonas aeruginosa Alkyl Quinolones under Metabolic and Competitive Stress. mSphere 2020, 5 (4), e00426-20 10.1128/mSphere.00426-20. [DOI] [PMC free article] [PubMed] [Google Scholar]
- Foster P. L. Stress-Induced Mutagenesis in Bacteria. Crit. Rev. Biochem. Mol. Biol. 2007, 42 (5), 373–397. 10.1080/10409230701648494. [DOI] [PMC free article] [PubMed] [Google Scholar]
- Rohmer L.; Hocquet D.; Miller S. I. Are pathogenic bacteria just looking for food? Metabolism and microbial pathogenesis. Trends Microbiol. 2011, 19 (7), 341–348. 10.1016/j.tim.2011.04.003. [DOI] [PMC free article] [PubMed] [Google Scholar]
- Weigel W. A.; Dersch P. Phenotypic heterogeneity: a bacterial virulence strategy. Microb. Infect. 2018, 20 (9–10), 570–577. 10.1016/j.micinf.2018.01.008. [DOI] [PubMed] [Google Scholar]
- Moradali M. F.; Ghods S.; Rehm B. H. A. Pseudomonas aeruginosa Lifestyle: A Paradigm for Adaptation, Survival, and Persistence. Front. Cell. Infect. Microbiol. 2017, 7, 39. 10.3389/fcimb.2017.00039. [DOI] [PMC free article] [PubMed] [Google Scholar]
- Banaeiyan A. A.; Ahmadpour D.; Adiels C. B.; Goksör M. Hydrodynamic Cell Trapping for High Throughput Single-Cell Applications. Micromachines 2013, 4 (4), 414–430. 10.3390/mi4040414. [DOI] [Google Scholar]
- Connell J. L.; Wessel A. K.; Parsek M. R.; Ellington A. D.; Whiteley M.; Shear J. B.. Probing Prokaryotic Social Behaviors with Bacterial “Lobster Traps. mBio 2010, 1( (4), ). 10.1128/mBio.00202-10. [DOI] [PMC free article] [PubMed] [Google Scholar]
- Kim M.-C.; Isenberg B. C.; Sutin J.; Meller A.; Wong J. Y.; Klapperich C. M. Programmed trapping of individual bacteria using micrometre-size sieves. Lab Chip 2011, 11 (6), 1089–1095. 10.1039/c0lc00362j. [DOI] [PubMed] [Google Scholar]
- Kumar N.; Wang W.; Ortiz-Marquez J. C.; Catalano M.; Gray M.; Biglari N.; Hikari K.; Ling X.; Gao J.; van Opijnen T.; Burch K. S. Dielectrophoresis assisted rapid, selective and single cell detection of antibiotic resistant bacteria with G-FETs. Biosens. Bioelectron. 2020, 156, 112123. 10.1016/j.bios.2020.112123. [DOI] [PMC free article] [PubMed] [Google Scholar]
- Santra T. S.; Tseng F. G. Micro/Nanofluidic Devices for Single Cell Analysis. Micromachines 2014, 5 (2), 154–157. 10.3390/mi5020154. [DOI] [Google Scholar]
- Andoy N. M.; Sarkar S. K.; Wang Q.; Panda D.; Benitez J. J.; Kalininskiy A.; Chen P. Single-Molecule Study of Metalloregulator CueR-DNA Interactions Using Engineered Holliday Junctions. Biophys. J. 2009, 97 (3), 844–852. 10.1016/j.bpj.2009.05.027. [DOI] [PMC free article] [PubMed] [Google Scholar]
- Yang F.; Chen T. Y.; Krzeminski L.; Santiago A. G.; Jung W.; Chen P. Single-molecule dynamics of the molecular chaperone trigger factor in living cells. Mol. Microbiol. 2016, 102 (6), 992–1003. 10.1111/mmi.13529. [DOI] [PMC free article] [PubMed] [Google Scholar]
- Franco J. H.; Minteer S. D.; de Andrade A. R. Product Analysis of Operating an Ethanol/O-2 Biofuel Cell Shows the Synergy between Enzymes within an Enzymatic Cascade. J. Electrochem. Soc. 2018, 165 (9), H575–H579. 10.1149/2.0931809jes. [DOI] [Google Scholar]
- Schofield Z.; Meloni G. N.; Tran P.; Zerfass C.; Sena G.; Hayashi Y.; Grant M.; Contera S. A.; Minteer S. D.; Kim M.; Prindle A.; Rocha P.; Djamgoz M. B. A.; Pilizota T.; Unwin P. R.; Asally M.; Soyer O. S. Bioelectrical understanding and engineering of cell biology. J. R. Soc. Interface 2020, 17 (166), 20200013. 10.1098/rsif.2020.0013. [DOI] [PMC free article] [PubMed] [Google Scholar]
- Gooding J. J.; Gaus K. Single-Molecule Sensors: Challenges and Opportunities for Quantitative Analysis. Angew. Chem., Int. Ed. 2016, 55 (38), 11354–11366. 10.1002/anie.201600495. [DOI] [PubMed] [Google Scholar]
- Han D.; Crouch G. M.; Fu K.; Zaino L. P.; Bohn P. W. Single-molecule spectroelectrochemical cross-correlation during redox cycling in recessed dual ring electrode zero-mode waveguides. Chem. Sci. 2017, 8, 5345–5355. 10.1039/C7SC02250F. [DOI] [PMC free article] [PubMed] [Google Scholar]
- Lemay S. G.; Moazzenzade T. Single-Entity Electrochemistry for Digital Biosensing at Ultralow Concentrations. Analyt. Chem. 2021, 93 (26), 9023–9031. 10.1021/acs.analchem.1c00510. [DOI] [PMC free article] [PubMed] [Google Scholar]
- Leung K.; Zahn H.; Leaver T.; Konwar K. M.; Hanson N. W.; Page A. P.; Lo C. C.; Chain P. S.; Hallam S. J.; Hansen C. L. A programmable droplet-based microfluidic device applied to multiparameter analysis of single microbes and microbial communities. Proc. Natl. Acad. Sci. U.S.A. 2012, 109 (20), 7665–7670. 10.1073/pnas.1106752109. [DOI] [PMC free article] [PubMed] [Google Scholar]
- Cutri A. R.; Sundaresan V.; Shrout J. D.; Bohn P. W. Spectroelectrochemical behavior of parallel arrays of single vertically oriented Pseudomonas aeruginosa cells. Cell Reports Physical Science 2023, 4 (4), 101368. 10.1016/j.xcrp.2023.101368. [DOI] [PMC free article] [PubMed] [Google Scholar]
- Shrout J. D.; Chopp D. L.; Just C. L.; Hentzer M.; Givskov M.; Parsek M. R. The impact of quorum sensing and swarming motility on Pseudomonas aeruginosa biofilm formation is nutritionally conditional. Mol. Microbiol. 2006, 62 (5), 1264–1277. 10.1111/j.1365-2958.2006.05421.x. [DOI] [PubMed] [Google Scholar]
- Morris J. D.; Hewitt J. L.; Wolfe L. G.; Kamatkar N. G.; Chapman S. M.; Diener J. M.; Courtney A. J.; Leevy W. M.; Shrout J. D. Imaging and analysis of Pseudomonas aeruginosa swarming and rhamnolipid production. Appl. Environ. Microbiol. 2011, 77, 8310–8317. 10.1128/AEM.06644-11. [DOI] [PMC free article] [PubMed] [Google Scholar]
- Gambino M.; Cappitelli F. Mini-review: Biofilm responses to oxidative stress. Biofouling 2016, 32 (2), 167–178. 10.1080/08927014.2015.1134515. [DOI] [PubMed] [Google Scholar]
- Vaishampayan A.; Grohmann E. Antimicrobials Functioning through ROS-Mediated Mechanisms: Current Insights. Microorganisms 2022, 10 (1), 61. 10.3390/microorganisms10010061. [DOI] [PMC free article] [PubMed] [Google Scholar]
- Kube M. C.; Pride S. T.; Hudson J. L. Local analysis of time series from the oscillatory electrocatalytic reduction of hydrogen peroxide. Chaos, Solitons & Fractals 1993, 3 (5), 495–507. 10.1016/0960-0779(93)90001-H. [DOI] [Google Scholar]
- Koper M. T. M. Non-linear phenomena in electrochemical systems. J. Chem. Soc. Faraday Trans. 1998, 94 (10), 1369–1378. 10.1039/a708897c. [DOI] [Google Scholar]
- Cohen L.; Cui N. W.; Cai Y. M.; Garden P. M.; Li X.; Weitz D. A.; Walt D. R. Single Molecule Protein Detection with Attomolar Sensitivity Using Droplet Digital Enzyme-Linked Immunosorbent Assay. ACS Nano 2020, 14 (8), 9491–9501. 10.1021/acsnano.0c02378. [DOI] [PubMed] [Google Scholar]
Associated Data
This section collects any data citations, data availability statements, or supplementary materials included in this article.