

Abstract
Background
The evolution of protein residues depends on the mutation rates of their encoding nucleotides, but it may also be affected by co-evolution with other residues. Chloroplasts function as environmental sensors, transforming fluctuating environmental signals into different physiological responses. We reasoned that habitat diversity may affect their rate and mode of evolution, which might be evidenced in the chloroplast genome. The Pteridaceae family of ferns occupy an unusually broad range of ecological niches, which provides an ideal system for analysis.
Results
We conducted adaptive evolution and intra-molecular co-evolution analyses of Pteridaceae chloroplast DNAs (cpDNAs). The results indicate that the residues undergoing adaptive evolution and co-evolution were mostly independent, with only a few residues being simultaneously involved in both processes, and these overlapping residues tend to exhibit high mutations. Additionally, our data showed that Pteridaceae chloroplast genes are under purifying selection. Regardless of whether we grouped species by lineage (which corresponded with ecological niches), we determined that positively selected residues mainly target photosynthetic genes.
Conclusions
Our work provides evidence for the adaptive evolution of Pteridaceae cpDNAs, especially photosynthetic genes, to different habitats and sheds light on the adaptive evolution and co-evolution of proteins.
Supplementary Information
The online version contains supplementary material available at 10.1186/s12870-023-04523-1.
Keywords: Chloroplast, Pteridaceae, Molecular evolution, Intra-molecular co-evolution, Protein tertiary structure
Background
The chloroplast genome of eukaryotes has been substantially reduced due to gene transfer to the host genome and simple gene loss [1]. Therefore, fewer than 5% of genes from the ancestral cyanobacteria remain in chloroplast DNA (cpDNA), mainly those encoding housekeeping and photosynthesis-associated proteins [2]. Nonetheless, chloroplasts are the sites of many important cellular processes, including photosynthesis and lipid, amino acid, chlorophyll, and carotenoid biosynthesis [3, 4]. Moreover, chloroplasts play important roles in plant adaptation to environmental stress, such as drought [5], salinity [6], extreme temperature [7], high light [8], and heavy metal stress [9]. Because chloroplasts act as the energy hubs of plant cells, their homeostasis is readily affected by environmental stress [3, 10]. Chloroplasts function as environmental sensors, transforming fluctuating environmental signals into physiological responses [11–13]. For instance, excessive reactive oxygen species (ROS) in plants can trigger retrograde signaling to subcellular compartments to readjust whole-cell metabolism in order to repair or turn over damaged macromolecules [7, 14]. In addition, the timely expression of chloroplast genes can promote adaptation to environmental fluctuations [15].
Genes encoding proteins with important functions are usually subject to strong evolutionary selection pressure. To measure selection pressure at the molecular level, the nucleotide substitution rate can be used to reflect the changes in protein-coding sequences: non-synonymous substitutions (dN) cause amino acid changes, while synonymous substitutions (dS) do not [16, 17]. dN/dS (ω) is a measure of natural selection that is widely used to detect genes related to environmental adaptation; a ω value greater than 1 is commonly believed to represent positive selection acting on a gene or gene lineage; a ω equal to 1 represents neutral selection, and a ω less than 1 represents purifying selection [18–20]. Many amino acids in functional proteins are conserved due to strong structural and functional constraints; thus, the average dN rate is rarely higher than the average dS rate [21, 22]. However, some genes may be positively selected under certain environmental conditions, resulting in higher ω values [23].
There may be an evolutionary association between amino acid residues of a given protein: co-evolution may occur between sequences within a protein that physically interact or are functionally relevant, so a change in residues at one site in the molecule may lead to a change in selection pressure at another site. However, amino acid residues located in crucial functional/structural regions will be subject to stronger selection restrictions because these sites may have a huge influence on the protein’s function [24]. Harmful mutations at such sites will be immediately eliminated from the population, but for a mutation that is actively selected for, compensation and substitution may occur to restore any fitness loss due to the mutation [25]. In other words, amino acid co-evolution or correlated mutation is a phenomenon whereby a deleterious substitution at one position is compensated for by another substitution elsewhere in the protein, so that the structure and function of the protein remain stable [26–29]. Notably, if the adaptive positively selected sites of a protein map to positions important for protein structure or function [30–33], and these sites show co-evolutionary relationships, this may indicate their functional/structural dependence [34]. Therefore, identifying the strategies employed by plants for adapting to different environments at the molecular level, along with their co-evolutionary dynamics, can shed light on the evolutionary pattern of species as well as the complex co-adaptation between residues in proteins.
Photosynthesis is particularly sensitive to environmental conditions and plays an important role in the unique niche occupied by land plants [35, 36]. Despite the wide variations in plant morphology and habitat throughout the plant kingdom, the structure and function of most cpDNA-encoded proteins are relatively well conserved. This conservation is largely believed to be driven by strong selection pressure related to the functional requirements of the proteins involved in photosynthesis [37]. Some functional genes with key roles in photosynthesis have undergone adaptive evolution with the “radiation”-type differentiation of species. For instance, genes encoding Rubisco components evolved under positive selection in most terrestrial plant lineages [38], and adaptive evolution of rbcL has also been observed in some aquatic plant lineages [39, 40], suggesting that RbcL subunits may have undergone continuous “fine-tuning” in different ecosystems. Similarly, atpB, psaB, and rbcL in Chlamydomonas sp. ICE-L show conserved adaptive evolution in extreme environments, which supports the notion that the adaptation of algae to extreme environments is related to the mode of selection of plastid proteins [41].
The Pteridaceae family of ferns contains five subfamilies, 53 genera, and an estimated 1,211 species, contributing to ~ 10% of extant leptosporangiate fern diversity [42, 43]. Pteridaceae have a diverse habitat distribution, ranging from wet tropical to arid regions, and they occupy an unusually broad range of ecological niches [44–46]. Most Pteridaceae species are terrestrial and inhabit open, often rocky environments, but representatives of some Adiantum and Pteris species are frequent in forests [47]. The Parkerioideae subfamily, represented by Ceratopteris, thrives in aquatic habitats, and Acrostichum is often associated with mangroves in the intertidal zone [48]. Species in the Cheilanthoideae subfamily are significant components of arid terrestrial habitats [49]. Vitarioid ferns, as sisters to the genus Adiantum L., are highly simplified and predominantly epiphytic species [50]. This provides an ideal system for studying the adaptive evolution and intra-molecular co-evolution of cpDNA in a wide range of niches. Previous studies on Pteridaceae have mainly focused on exploring their phylogenetic relationships based on their DNA sequences; however, few studies have focused on the molecular evolution of this family, especially between species inhabiting different environments. In this study, we divided 41 species of Pteridaceae into the terrestrial clade, the epiphytic clade, and the aquatic clade and analyzed the evolutionary dynamics of cpDNA of different habitat groups using common protein-coding sequence data sets to analyze (1) the molecular mechanism of adaptive evolution of Pteridaceae cpDNAs in different groups and (2) the intra-molecular co-evolution patterns of genes involved in this adaptive evolution.
Results
Construction of a phylogenetic tree for adaptive evolution and co-evolution analyses
We constructed a phylogenetic tree using protein sequences inferred from cpDNAs of 41 Pteridaceae species (Table S1). The topologies and support values from maximum likelihood (ML) and Bayesian inference (BI) analyses were similar, and the 41 species were resolved into five highly supported “subfamily clades”: Parkerioideae, Pteridoideae, Cryptogrammoideae, Cheilanthoideae, and Vittarioideae. Pteris and Adiantum were each resolved as monophyletic in this analysis, consistent with previous reports [43, 51–53]. We categorized this system into three clades based on their respective habitats: the aquatic clade belonging to the Parkerioideae subfamily, the epiphytic clade consisting of vittarioid ferns, while the terrestrial clade composing of the others (Fig. 1).
Fig. 1.

Phylogenetic frame of 41 Pteridaceae species constructed for adaptive evolution and co-evolution analysis. Out.: Outgroup; Park.: Parkerioideae; Pter.: Pteridoideae; Cryp.: Cryptogrammoideae; Chei.: Cheilanthoideae; Vitt.: Vittarioideae. + represents newly added cpDNA samples
Analysis of selection pressure
We used the basic model to detect the selection pressure range in 41 Pteridaceae species. The ω values of Pteridaceae chloroplast protein-coding genes ranged from 0.0046 to 0.4432 (Table S2), and all 76 common protein-coding genes had ω less than 0.5, indicating that the protein-coding genes of Pteridaceae chloroplasts are dominated by purifying selection.
To test whether the evolutionary pattern of the chloroplast protein-coding genes in the Pteridaceae family is related to adaptability to different habitats, we set the terrestrial, aquatic, or epiphytic ancestral clade as the foreground clade successively when using the branch model and the other two non-target clades as background clade (Specific methods are detailed in Materials and Methods). The branch model will detect positive selection in a lineage only when the average dN of all sites is higher than the average dS [21]. We discarded five genes with extremely low dS values to avoid misestimating the ω value (999): accordingly, we eliminated infA from the terrestrial clade, psbJ from the epiphytic clade, and psaI, psaJ, and psbT from the aquatic clade. Using the remaining data sets, only when the terrestrial ancestral clade was used as the foreground clade did rbcL accept the M2 model, and the ω values became significant after p-value correction (ω = 0.0047, q-value = 0.0154). When the aquatic ancestral clade or the epiphytic ancestral clade was used as the foreground clade, we observed no significant positive selection after p-value correction. No matter which habitat was used as the foreground clade, the test results were mainly ω < 0.5 (Table S3), which also indicates that the Pteridaceae chloroplasts are dominated by purifying selection.
RELAX analysis
We identified a few genes with high but not statistically significant ω values in the above data. For instance, the ω values of psbL in the epiphytic ancestral clade and rps12 and rpl32 in the aquatic ancestral clade were greater than 1 and far higher than their respective background clades (Fig. 2). A higher ω value may be caused by the positive selection of specific genes or the relaxation of natural selection. Based on this result, we tested the selection intensity of Pteridaceae species from different habitats. We determined that the higher ω value of psbL in the epiphytic clade may be caused by the relaxation of selection pressure, while those of rps12 and rpl32 in the aquatic clade were caused by the intensification of selective pressure. In addition, rbcL with significant purifying selection in the terrestrial clade showed significant relaxation of selective pressure (Table S3).
Fig. 2.

The ω value of each retained protein-coding gene in different foreground clades under the branch model. Purple, blue, and green backgrounds represent genes related to the photosynthetic system, genetic system, and other functions respectively. * marked gene represents significance after p-value correction. Back.: Background clade; Ter.: Terrestrial clade; Aqu.: Aquatic clade; Epi.: Epiphytic clade
Analysis of residues under positive selection
As most amino acids in a functional protein are under structural and functional constraints, and adaptive evolution likely affects only a few sites at a few time points [21], we used the site model, which ignores the variation in the ω value between branches, to determine whether any residues have undergone positive selection. Using the Bayes empirical Bayes (BEB) method in the site model with residue reference sites based on Pteris arisanensis, we detected positively selected residues within 20 chloroplast protein-coding genes that were statistically significant (Table 1).
Table 1.
Parameter estimates for different model selection tests
| Gene name | Model | d.f. | 2ΔL | LRT P-value | Positive selection sites (BEB) |
|---|---|---|---|---|---|
| Site Model | |||||
| atpA | M2a vs. M1a | 2 | 21.874 | 0 | L308** |
| M8 vs. M7 | 2 | 113.077 | 0 | Dismiss | |
| M8 vs. M8a | 1 | 1.5231 | 0.2172 | Not allowed | |
| atpB | M2a vs. M1a | 2 | 11.6161 | 0.0029 | H123*, S252**, S474* |
| M8 vs. M7 | 2 | 111.2862 | 0 | Dismiss | |
| M8 vs. M8a | 1 | 0.5467 | 0.4597 | Not allowed | |
| atpE | M2a vs. M1a | 2 | 0 | 1 | Dismiss |
| M8 vs. M7 | 2 | 14.7578 | 0.0006 | W20*, L62** | |
| M8 vs. M8a | 1 | 7.7754 | 0.0053 | Not allowed | |
| atpH | M2a vs. M1a | 2 | 6.786 | 0.0336 | L80* |
| M8 vs. M7 | 2 | 26.0509 | 0 | L57*, P74*, L80** | |
| M8 vs. M8a | 1 | 5.5447 | 0.0185 | Not allowed | |
| cemA | M2a vs. M1a | 2 | 19.1067 | 0.0001 | G152*, R154*, V158* |
| M8 vs. M7 | 2 | 25.0987 | 0 | G152*, R154**, R155*, V158*, V159* | |
| M8 vs. M8a | 1 | 14.358 | 0.0002 | Not allowed | |
| matK | M2a vs. M1a | 2 | 0 | 1 | Dismiss |
| M8 vs. M7 | 2 | 37.4691 | 0 | E118*, A346* | |
| M8 vs. M8a | 1 | 11.667 | 0.0006 | Not allowed | |
| ndhB | M2a vs. M1a | 2 | 32.8718 | 0 | P9*, Q68*, T78**, L180*, R209* |
| M8 vs. M7 | 2 | 58.0883 | 0 | I6*, P9**, T56*, M60*, Q68**, T78**, L180**, L206*, R209** | |
| M8 vs. M8a | 1 | 17.7176 | 0 | Not allowed | |
| ndhF | M2a vs. M1a | 2 | 0 | 1 | Dismiss |
| M8 vs. M7 | 2 | 51.2991 | 0 | T473*, G516*, L624**, L629* | |
| M8 vs. M8a | 1 | 11.8531 | 0.0006 | Not allowed | |
| ndhG | M2a vs. M1a | 2 | 11.7994 | 0.0077 | K139* |
| M8 vs. M7 | 2 | 32.2417 | 0 | K139* | |
| M8 vs. M8a | 1 | 6.2642 | 0.0091 | Not allowed | |
| ndhK | M2a vs. M1a | 2 | 15.1025 | 0.0005 | K221** |
| M8 vs. M7 | 2 | 54.8315 | 0 | Dismiss | |
| M8 vs. M8a | 1 | 5.3409 | 0.0919 | Not allowed | |
| petB | M2a vs. M1a | 2 | 63.9595 | 0 | S2** |
| M8 vs. M7 | 2 | 81.0342 | 0 | S2**, R118* | |
| M8 vs. M8a | 1 | 6.6194 | 0.0101 | Not allowed | |
| psbF | M2a vs. M1a | 2 | 7.2313 | 0.0269 | S27* |
| M8 vs. M7 | 2 | 14.4889 | 0.0007 | S27**, S28* | |
| M8 vs. M8a | 1 | 8.3591 | 0.0038 | Not allowed | |
| psbL | M2a vs. M1a | 2 | 18.1735 | 0.0001 | W20**, L24**, S31* |
| M8 vs. M7 | 2 | 23.78 | 0 | L13*, W20**, L24**, S31** | |
| M8 vs. M8a | 1 | 18.1734 | 0 | Not allowed | |
| psbZ | M2a vs. M1a | 2 | 6.885 | 0.032 | S35* |
| M8 vs. M7 | 2 | 23.5259 | 0 | S35** | |
| M8 vs. M8a | 1 | 8.7711 | 0.0031 | Not allowed | |
| rpl16 | M2a vs. M1a | 2 | 60.897 | 0 | I2** |
| M8 vs. M7 | 2 | 102.3139 | 0 | I2** | |
| M8 vs. M8a | 1 | 43.9429 | 0 | Not allowed | |
| rpoA | M2a vs. M1a | 2 | 66.9924 | 0 | Q106*, R128*, S173**, D233**, C236*, P241*, Q245*, P249*, F272* |
| M8 vs. M7 | 2 | 92.6536 | 0 | Q106*, R128*, S147*, S173**, D233**, C236*, P241**, Q245*, P249*, F272* | |
| M8 vs. M8a | 1 | 61.6783 | 0 | Not allowed | |
| rpoB | M2a vs. M1a | 2 | 0 | 1 | Dismiss |
| M8 vs. M7 | 2 | 93.4487 | 0 | R575*, V597*, E598*, R604**, S606**, P628* | |
| M8 vs. M8a | 1 | 13.6511 | 0.0002 | Not allowed | |
| rpoC2 | M2a vs. M1a | 2 | 28.6437 | 0 | F1020*, P1074** |
| M8 vs. M7 | 2 | 67.1979 | 0 | F1020*, P1074** | |
| M8 vs. M8a | 1 | 29.8592 | 0 | Not allowed | |
| rps7 | M2a vs. M1a | 2 | 14.8195 | 0.0006 | S94**, S115* |
| M8 vs. M7 | 2 | 25.8359 | 0 | S94**, S115* | |
| M8 vs. M8a | 1 | 15.2237 | 0.0001 | Not allowed | |
| ycf3 | M2a vs. M1a | 2 | 12.2851 | 0.0021 | P55** |
| M8 vs. M7 | 2 | 29.1111 | 0 | L75*, Q125*, P55** | |
| M8 vs. M8a | 1 | 10.7695 | 0.001 | Not allowed | |
| Branch-site Model | |||||
| Epiphytic clade | |||||
| ndhI | Model A vs. Model A null | 1 | 5.1717 | 0.023 | S50** |
| psaB | Model A vs. Model A null | 1 | 8.405 | 0.0037 | T511* |
| rps19 | Model A vs. Model A null | 1 | 5.5583 | 0.0184 | R17** |
| Aquatic clade | |||||
| ndhG | Model A vs. Model A null | 1 | 10.0159 | 0.0016 | W121* |
| rpl33 | Model A vs. Model A null | 1 | 4.2567 | 0.0391 | T16* |
d.f.: difference in the number of parameters in the ω distribution; LnL: log-likelihood value; LRT: likelihood ratio test; BEB: Bayes empirical Bayes analysis; * P > 95%; ** P > 99%.
Among these genes, atpE, matK, ndhF and rpoB rejected the M2a model in the M2a vs. M1a nested model, so we dismissed the results for these genes. Accordingly, 36 positively selected residues were retained in the M2a model (P > 95%), which are encoded within 16 genes. Of these genes, 10 are photosynthetic genes (atpA, atpB, atpH, ndhB, ndhK, ndhG, petB, psbF, psbL, and psbZ), four are genetic system genes (rpl16, rpoA, rpoC2, and rps7), and two are other functional genes (cemA and ycf3). Furthermore, atpA atpB and ndhK rejected the M8 model in the M8 vs. M8a nested model, so we dismissed the results for these genes. Accordingly, 59 positively selected residues were retained in the M8 model (P > 95%), which are encoded by 17 genes. Among these, nine are photosynthetic genes (atpE, atpH, ndhB, ndhF, ndhG, petB, psbF, psbL, and psbZ), five genetic system genes (rpl16, rpoA, rpoB, rpoC2, and rps7), and three are other functional genes (cemA, matK, and ycf3). Together, the results of the M2a and M8 models show that most of the positively selected residues are encoded in photosynthetic genes of Pteridaceae.
The branch-site model provided evidence of positive selection on different habitat groups of Pteridaceae. Using the BEB method, we did not detect positively selected residues in the terrestrial ancestral clade. Instead, we identified 3 positively selected residues in the epiphytic ancestral clade and 2 in the aquatic ancestral clade (P > 95%, with residue reference sites based on P. arisanensis) (Table 1). These residues are encoded by ndhI (S50), psaB (T511), and rps19 (R17) in the epiphytic ancestral clade. In the aquatic ancestral clade, they are encoded by ndhG (W121) and rpl33 (T16). These residues showed strong positive selection in the branch-site model, suggesting they may be critical for adaptive evolution in the epiphytic and aquatic ancestral clades of Pteridaceae.
Intra-molecular co-evolution analysis
The evolution of residues depends on their intrinsic nucleotide mutation rates and the effects imposed by their complex co-evolutionary networks [24]. Co-evolution dynamics can highlight the intricate co-adaptive relationships between residues in a protein under an estimated timescale [34]. Using the protein sequences of P. arisanensis as a reference, we conducted co-evolution analysis of the genes encoding positively selected residues (i.e., adaptively evolving sites) identified using the site model (17 of the 20 protein sequences tested, except for PsbF, PsbL, and PsbZ). The 17 remaining protein sequences (AtpA, AtpB, AtpE, AtpH, CemA, MatK, NdhB, NdhF, NdhG, NdhK, PetB, Rpl16, RpoA, RpoB, RpoC2, Rps7, and Ycf3) contained co-evolved residue pairs (Table 2 displays proteins containing overlapping residues in the co-evolution and adaptive evolution analyses; other co-evolved residue pairs are shown in Table S4). Among these, RpoC2 had the most co-evolved residue pairs (363 pairs), followed by NdhB (90 pairs), AtpB (74), RpoB (50), NdhF (45), CemA (43), AtpA (38), RpoA (37), MatK (33), PetB (20), NdhG (6), NdhK (5), Rpl16 (5), AtpE (4), Ycf3 (4), AtpH (1), and Rps7 (1).
Table 2.
Information about intra-molecular co-evolved residue pairs for protein sequences containing overlapping residues in co-evolution and adaptive evolution analyses
| Co-evolution pairs | Distance (Å) | Co-evolution pairs | Distance (Å) | Co-evolution pairs | Distance (Å) |
|---|---|---|---|---|---|
| AtpA | |||||
| S57 & E58 | 3.7 | S104 & L247 | 11.0 | L186 & S338 | 27.8 |
| L68 & S130 | 20.6 | S104 & T258 | 18.9 | N192 & M220 | 13.9 |
| L68 & N192 | 44.4 | S104 & M315 | 18.9 | E216 & L308 | 36.0 |
| L68 & M220 | 41.7 | S130 & P134 | 9.5 | M220 & L279 | 38.5 |
| P77 & D103 | 28.8 | S130 & E216 | 32.4 | M220 & R280 | 41.4 |
| L82 & L186 | 40.1 | S130 & Y294 | 17.8 | L247 & T258 | 9.6 |
| L82 & M220 | 35.4 | P134 & M220 | 28.8 | L247 & M315 | 10.9 |
| T83 & K255 | 43.8 | P134 & L279 | 24.8 | K255 & T258 | 9.6 |
| T83 & T258 | 38.8 | L186 & K189 | 6.6 | K255 & M315 | 10.0 |
| T83 & M315 | 39.4 | L186 & M220 | 8.8 | T258 & M315 | 4.5 |
| K95 & L186 | 36.2 | L186 & K255 | 21.2 | L265 & S338 | 13.7 |
| K95 & L265 | 26.7 | L186 & Q256 | 17.5 | L279 & Y294 | 17.5 |
| K95 & S338 | 33.3 | L186 & L265 | 21.1 | ||
| AtpB | |||||
| K16 & M214 | 45.5 | K50 & H123 | 27.7 | S125 & S252 | 17.4 |
| K16 & F472 | 70.2 | K50 & S249 | 25.8 | S125 & P450 | 44.9 |
| N17 & P35 | 11.1 | E56 & S97 | 18.5 | S125 & Y473 | 51.8 |
| N17 & E56 | 18.5 | E56 & N124 | 22.3 | S125 & S474 | 48.7 |
| N17 & G88 | 11.4 | E56 & S125 | 24.7 | T126 & S249 | 16.7 |
| N17 & N124 | 26.3 | E56 & T126 | 23.9 | S183 & M214 | 12.7 |
| N17 & S197 | 35.0 | E56 & I220 | 30.8 | S183 & S249 | 21.6 |
| N17 & G301 | 32.2 | E56 & G301 | 35.6 | S183 & P450 | 18.5 |
| N17 & S474 | 62.6 | E56 & N466 | 71.5 | S183 & T490 | 25.4 |
| N17 & T490 | 69.0 | E56 & S474 | 53.8 | S197 & S252 | 9.3 |
| V18 & H123 | 29.3 | T77 & S474 | 44.8 | S197 & S474 | 28.8 |
| V18 & G492 | 71.5 | T77 & S487 | 55.3 | M214 & S249 | 22.6 |
| Y20 & A136 | 39.4 | G88 & T490 | 67.3 | M214 & Y473 | 29.4 |
| F33 & M214 | 46.5 | S97 & L157 | 41.0 | I225 & S249 | 28.0 |
| F33 & S249 | 27.2 | E102 & S103 | 3.8 | I225 & S252 | 24.8 |
| P35 & E56 | 27.7 | E102 & F109 | 13.2 | S249 & P450 | 37.5 |
| P35 & N124 | 36.3 | F109 & K263 | 22.5 | S252 & P461 | 46.4 |
| P35 & G301 | 32.6 | H123 & S183 | 29.9 | G301 & S474 | 40.2 |
| P35 & S474 | 68.0 | H123 & K224 | 13.0 | L373 & L406 | 35.7 |
| N40 & M214 | 40.2 | H123 & S252 | 19.1 | L406 & S474 | 30.6 |
| N40 & Y473 | 58.4 | H123 & G492 | 54.8 | P450 & S474 | 18.4 |
| V46 & E56 | 10.5 | N124 & G301 | 33.6 | Y473 & S474 | 3.8 |
| V47 & E56 | 8.8 | N124 & S474 | 46.5 | S474 & A486 | 10.2 |
| V47 & S133 | 27.6 | S125 & I225 | 18.3 | T490 & G492 | 5.3 |
| V47 & N466 | 72.2 | S125 & S249 | 19.1 | ||
| AtpH | |||||
| I11 & L80 | 12.8 | ||||
| MatK | |||||
| E118 & P321 | 32.2 | D204 & S326 | 25.2 | I281 & F359 | 27.7 |
| Q127 & V146 | 26.8 | I215 & I271 | 20.7 | V291 & K303 | 19.4 |
| Q127 & L151 | 28.1 | Y252 & E318 | 16.5 | V291 & R383 | 42.7 |
| Q127 & C433 | 36.7 | Y252 & R482 | 62.4 | R292 & I484 | 62.0 |
| V146 & C433 | 38.1 | I261 & Y289 | 21.0 | F302 & H305 | 5.4 |
| V146 & R482 | 51.4 | D262 & Q267 | 6.9 | E318 & R482 | 54.4 |
| K148 & V337 | 19.7 | Y264 & H307 | 40.8 | P321 & N465 | 30.8 |
| Y150 & H421 | 27.2 | G274 & K362 | 35.4 | K370 & R449 | 31.2 |
| L151 & C433 | 37.8 | Y276 & L480 | 43.8 | A403 & T479 | 12.1 |
| L151 & R449 | 52.4 | K279 & R424 | 29.0 | R424 & T479 | 23.9 |
| F187 & V337 | 46.1 | K279 & T479 | 42.8 | Y427 & I431 | 6.5 |
| NdhF | |||||
| V221 & L235 | 21.4 | R340 & L433 | 21.7 | S479 & T541 | 48.0 |
| I224 & L441 | 37.3 | V347 & I609 | 23.7 | S488 & S693 | 88.0 |
| F225 & V687 | 44.2 | V347 & S676 | 50.1 | V504 & T636 | 39.2 |
| A226 & V293 | 13.9 | V363 & G608 | 24.4 | S519 & Y659 | 46.6 |
| L233 & E528 | 60.5 | V363 & F686 | 65.2 | A551 & L604 | 21.6 |
| L233 & L556 | 33.8 | S366 & L556 | 33.4 | L556 & G608 | 25.0 |
| L233 & G608 | 36.4 | S366 & I609 | 26.5 | L556 & I609 | 23.9 |
| L233 & I609 | 38.3 | S366 & T648 | 30.6 | L556 & S676 | 62.2 |
| A239 & F382 | 31.2 | R377 & F508 | 42.4 | D560 & F678 | 65.8 |
| F244 & L343 | 20.2 | L403 & V545 | 15.4 | G608 & I609 | 3.8 |
| I277 & Y351 | 20.6 | E419 & H512 | 70.5 | G608 & F686 | 69.3 |
| I286 & S693 | 65.2 | E423 & V709 | 104.6 | I609 & S676 | 57.4 |
| M291 & F678 | 43.7 | G437 & D560 | 23.5 | L629 & F655 | 33.1 |
| I310 & S710 | 95.1 | G437 & F678 | 53.1 | L642 & G704 | 83.3 |
| G318 & F447 | 11.7 | I449 & G685 | 61.9 | Y658 & V683 | 36.0 |
| PetB | |||||
| M1 & R43 | 47.5 | H58 & I161 | 31.7 | L95 & S164 | 32.3 |
| S2 & H58 | 60.3 | H58 & P200 | 30.1 | R118 & M199 | 11.4 |
| R43 & I161 | 35.3 | H58 & L204 | 35.9 | G125 & P163 | 25.1 |
| L45 & L95 | 15.2 | T63 & L95 | 33.3 | L160 & S164 | 8.5 |
| L45 & I161 | 35.4 | T63 & L204 | 43.1 | P163 & M199 | 31.0 |
| H58 & T63 | 8.7 | L95 & M96 | 3.8 | L165 & L204 | 32.5 |
| H58 & L95 | 28.5 | L95 & I161 | 32.4 | ||
| RpoB | |||||
| R575 & K609 | 19.9 | L651 & M1049 | 60.4 | R771 & D934 | 67.9 |
| Y581 & K609 | 17.3 | K653 & S723 | 44.8 | L775 & 4 E105 | 48.2 |
| E583 & G937 | 55.4 | K653 & N920 | 29.9 | K776 & P939 | 56.0 |
| G584 & R771 | 45.1 | N674 & T1058 | 64.4 | I779 & Q837 | 35.4 |
| G584 & D934 | 50.4 | F686 & L728 | 17.5 | T797 & I820 | 44.1 |
| E594 & T1034 | 89.6 | F686 & T797 | 31.9 | V803 & 7 I106 | 69.2 |
| V595 & D796 | 45.7 | Q708 & K813 | 36.4 | Y807 & 4 T103 | 48.3 |
| L631 & G937 | 56.4 | Q708 & E876 | 62.3 | K813 & E876 | 27.6 |
| L631 & P1020 | 74.1 | Q708 & I1070 | 72.5 | K813 & 0 I107 | 75.1 |
| F632 & N674 | 41.1 | L728 & T797 | 24.1 | R836 & 7 I106 | 82.5 |
| E636 & A642 | 17.5 | L728 & P1020 | 43.8 | Q837 & T880 | 28.6 |
| E636 & Y807 | 33.2 | Q745 & L759 | 20.3 | Q837 & 9 M104 | 72.5 |
| I637 & D934 | 50.1 | A748 & D800 | 26.9 | E876 & 0 I107 | 92.9 |
| A642 & V803 | 30.3 | S749 & F1057 | 36.9 | T880 & 9 M104 | 79.5 |
| A645 & A697 | 50.0 | L758 & R782 | 40.0 | A909 & P914 | 11.7 |
| L651 & Q837 | 28.6 | R771 & D800 | 20.3 | L993 & 1 E106 | 31.1 |
| L651 & T880 | 19.9 | R771 & V885 | 70.9 |
Distance: distance between the two alpha carbon atoms. Bold font represents overlapping residues identified by co-evolution and adaptive evolution analyses.
In complex co-evolution networks, some residues frequently appear in different co-evolved pairs. In particular, evolutionary dependence is identified between sites belonging to different domains, which plays an important role in the formation of residue co-evolution networks. For instance, based on the co-evolved pairs (S125 & S252 and S252 & P461) in the AtpB protein sequence, although S125 and P461 do not show direct co-evolution, there may be some indirect co-evolution pressure.
Relationship between adaptive evolution and co-evolution
Having more positively selected residues makes it easier to observe the relationship between positively selected residues and co-evolved residues. Therefore, we used the union of the M2a and M8 model results in the following analyses. We analyzed the relationship between positively selected residues and co-evolved residues by predicting the tertiary structures of protein sequences. The co-evolved residues were scattered throughout the protein sequences (Fig. 3), and some sites were not in a direct co-evolutionary relationship even if they had a relatively close linear distance in the primary structure. For example, in the AtpA protein sequence, the co-evolved residues L82 and T83 were both predicted to interact with the distal sites in the tertiary structure (L82 & M220, distance: 35.4 Å; T83 & K255, distance: 43.8 Å) (Table 2). In addition, the positively selected residues and co-evolved residues within the protein sequence were mostly independent of each other, with only a few overlapping sites: AtpA (L308), AtpB (H123, S252, and S474), AtpH (L80), MatK (E118), NdhF (L629), PetB (S2 and R118), and RpoB (R575) (Fig. 3). After visualizing the co-evolved residues using Jalview [54], we determined that the co-evolved residues that overlapped with positively selected residues tended to be highly mutated, while the non-overlapping co-evolved residues had fewer mutations (Fig. 4). In this study, we defined a residue site as a high mutation site when the same residue was present in less than half (The results of multiple sequence alignment for specific co-evolved and positively selected residues can be found in Figure S1 and Figure S2, respectively). We employed a chi-square test to assess the conservativeness of residues in overlapping positions. The results indicated a statistical preference for overlapping residues to be located in positions with a low conservation ( χ2: 52.30, p-value: 0).
Fig. 3.
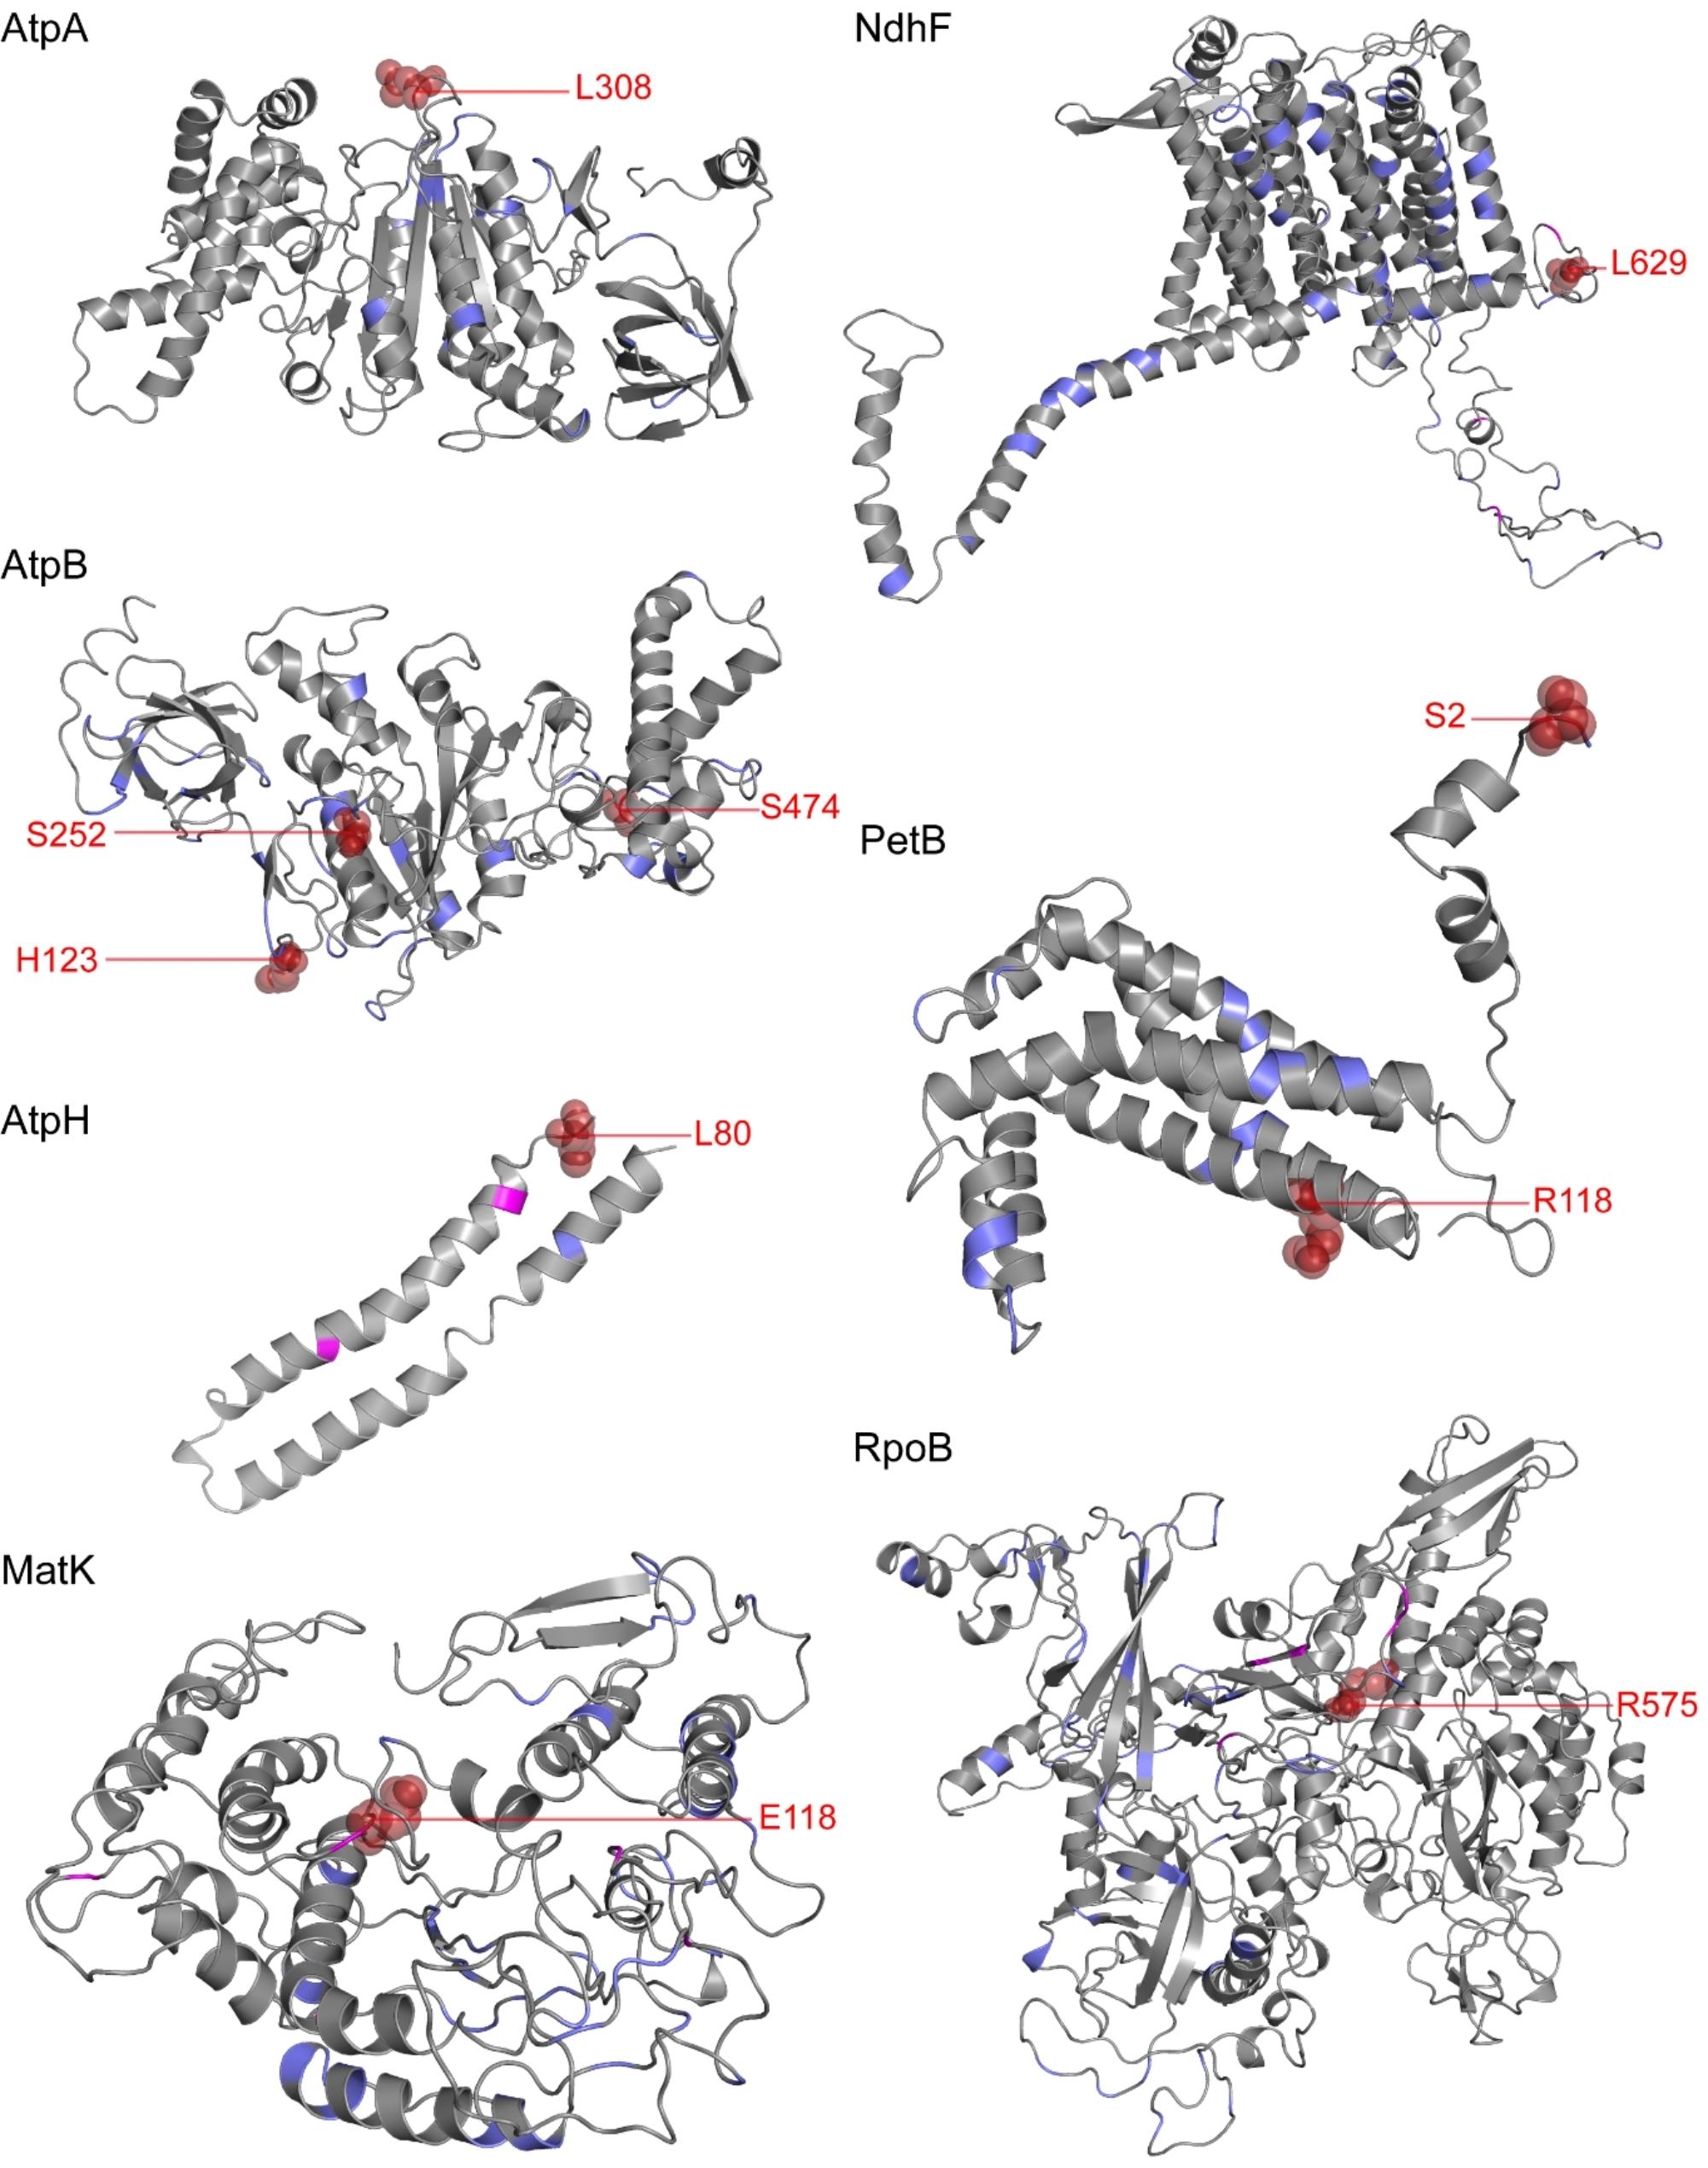
Distribution of positively selected residues and co-evolved residues in the AtpA, AtpB, AtpH, MatK, NdhF, PetB, and RpoB proteins of Pteridaceae. All protein tertiary structures were predicted by homology based on P. arisanensis. Purple represents co-evolution residues, magenta represents adaptive evolution residues, and firebrick red represents both and is labeled accordingly
Fig. 4.

The proportion of differential residues in multiple sequence alignment of co-evolved sites, positively selected sites, and overlapping sites between the two
Discussion
Adaptive evolutionary responses to changing environmental conditions result in accelerated evolution and the functional evolution of specific stress-response proteins that favor improved fitness in the new environment [55–57]. In this study, we observed that all protein-coding genes in the Pteridaceae chloroplast genome had ω < 0.5, indicating that Pteridaceae cpDNA has mainly undergone purifying selection. However, only rbcL showed a ω value (0.0047) in the terrestrial ancestral clade significantly different from that in the background clade, indicating that this gene has experienced significant purifying selection. Rubisco is crucial for photosynthesis, as it not only fixes CO2 [58, 59] but also improves plant growth performance under stress [60]. Truncations and mutations of the conserved N terminus of RbcL can substantially affect Rubisco activity [61]. RbcL has evolved adaptively in different environments and is thought to have undergone “continuous fine-tuning” in different ecosystems [38–40]. However, in the terrestrial clade of the Pteridaceae, rbcL is under significant purifying selection and is in a state of relaxed selection. On the other hand, the branch-site model did not detect any positively selected residues in the terrestrial ancestral clade. Therefore, we speculate that the ancestors of Pteridaceae likely grew on land and had completed adaptive evolution, so the terrestrial clade of Pteridaceae is now under purifying selection. Under purifying selection, most non-synonymous substitutions will be purified, so rbcL exhibits significant purifying selection.
When we applied the likelihood ratio test (LRT) and BEB test without distinguishing between lineages, 20 genes showed residues under positive selection (significant at the 95% level) (Table 1). These residues were mainly encoded within photosynthetic genes, including genes encoding subunits of ATP synthase (atpA, atpB, atpE, and atpH), the predominant site of photosynthetic flux control [62]; NADH dehydrogenase (ndhB, ndhF, ndhG, and ndhK), which is important for adaptation of the photosynthetic mechanism to abiotic stress [63]; the cytochrome b6f complex (petB); and photosystem II (psbF, psbL, and psbZ). These genes encode indispensable components of photosynthesis, and the finding that they are under positive selection indicates that photosynthetic genes play key roles in the adaptive evolution of Pteridaceae. The results of the site model also revealed positively selected genes related to plastid-encoded RNA polymerase (rpoA, rpoB, and rpoC2), which are involved in the transcription of photosynthesis-related genes [64, 65]; and small and large ribosome subunits (rpl16 and rps7). The other functional genes showing positive selection were cemA, matK, and ycf3.
To further elucidate the evolutionary pattern of Pteridaceae chloroplast-encoded proteins, we conducted a co-evolution analysis of the protein sequences encoded by 20 genes including positively selected residues, finding that 17 showed intra-molecular co-evolution. Among these, AtpB, NdhB, RpoB, and RpoC2 encoded abundant co-evolved residues (over 50 co-evolved pairs) and formed a complex co-evolution network (Figure S3); this complexity may be due to their large size, as larger proteins have more residue interactions and more possibilities for co-evolution [25]. The co-evolution approach emphasizes the role of spatial structure information in the study of protein evolution and provides strong evidence to reveal the structural and functional correlation of residue sites [66]. Co-evolved residue pairs often correspond to spatially proximal residues in protein structures [67]. In this study, in addition to the co-evolved pairs with relatively close linear and structural distances, we also observed many co-evolutionary relationships between distal residues at the tertiary structure level, which far outnumbered those of proximal residues (Table 2), suggesting that these co-evolved pairs may be more prone to functional co-evolution [68].
When a species is faced with an extreme environment, some residues within proteins undergo adaptive changes [30–33]. To maintain protein stability, this effect may be mitigated by compensatory changes in other amino acid residues [25]. Therefore, the adaptive evolution of residues in a protein and the intra-molecular co-evolution will tend to be linked. However, our results were contrary to this expectation: residues undergoing adaptive evolution and co-evolution are scattered in the three-dimensional structure of proteins, and their overlap is limited (overlapping residues/adaptively evolving residues: 10/64; overlapping residues/co-evolved residues: 10/741), indicating that the positions of these two categories of sites in the protein sequence are nearly independent. After visualizing multiple amino acid sequences, whereas adaptively evolving residues generally exhibit lower conservation (Figure S2), co-evolved residues tend to display relatively higher conservation (Figure S1). Interestingly, the co-evolved residues that overlap with adaptively evolving residues generally show low conservation: that is, the sequences of the overlapping sites were always highly mutated. On the one hand, non-synonymous substitutions are more strongly affected by natural selection than are synonymous substitutions [69]. If adaptive evolution leads to an increase in the non-synonymous substitution rates, it may indicate that the species is actively adapting to the new environment. Therefore, adaptive evolution is expected to increase the rate of non-synonymous substitutions. Notably, functionally/structurally important residues are often subject to strong selection constraints and thus tend to be conserved, even these are subject to mutation under extreme environmental stress. On the other hand, because the structure and function of a macromolecule depend on complex interactions between residues, such changes can alter crucial interactions with other residues. Thus, the fitness effect of a mutation at a given location may depend on the state of interacting residues, resulting in non-independent evolution (co-evolution) [70]. This co-evolution should generally be quite slow, with these residues showing greater conservation [25]. Moreover, the geometry of interactions in the tertiary structures of proteins may vary in time and sequence, with the residues involved potentially changing over time during the evolutionary history of a molecule [25]. Thus, co-evolved residue pairs and adaptively evolved residue sites may vary in time and space. Therefore, one possible explanation for the presence of these overlapping residues is that adaptive evolution and intra-molecular co-evolution in species may be driven by distinct mechanisms, and they happen to overlap. Notably, these overlapping residues tend to exhibit lower conservation.
We also detected genes encoding positively selected residues in the epiphytic and the aquatic clades (95% level, BEB method): ndhG (W121) and rpl33 (T16) in the aquatic ancestral clade and ndhI (S50), psaB (T511), and rps19 (R17) in the epiphytic ancestral clade. The habitats of epiphytic species in a tree canopy are diverse, with some limited to smaller branches and others to larger branches or trunks [71]. The aquatic A. speciosum usually grows in the shady understory of a mangrove forest and is frequently flooded by tides [72], while Ceratopteris species are often restricted to aquatic habitats, such as those near ponds and streams [73]. Such shade-living species are especially vulnerable to damage to the photosynthetic machinery due to excessive light. The genes that were positively selected in these clades encode proteins crucial to this machinery: NdhG, NdhI, and PsaB are involved in photosystem I (PSI) cyclic electron transport [74–76], and the NDH complex appears to be particularly important for enabling the photosynthetic machinery to adapt to stress conditions [63] and/or alleviating stress [75]. Rpl33 and Rps19 are ribosomal proteins, with Rpl33 being necessary to maintain sufficient cpDNA translation under cold conditions [77]. However, we did not detect positively selected residues in the terrestrial ancestral clade, possibly because the Pteridaceae are descended from a terrestrial ancestor that was previously adapted to such environments. In summary, some residues encoded within Pteridaceae chloroplast genes showed positive selection, indicating that they play an important role in the adaptive evolution to different habitats.
Conclusion
Pteridaceae cpDNAs have mainly undergone purifying selection. Only rbcL in the terrestrial clade showed significant purification selection and is in a state of relaxed selection. Regardless of whether the lineage was distinguished, the positively selected residues were mostly encoded by photosynthetic genes, indicating that photosynthetic genes play an important role in the adaptive evolution of Pteridaceae species. We carried out a co-evolution analysis of 20 genes encoding adaptively evolved residues to explore the complex evolutionary pattern of proteins. These adaptively evolved sites and co-evolved sites were mostly independent, with only a few overlapping sites, and the amino acid sequences of these overlapping sites were always highly mutated. These overlapping sites may be due to the different mechanisms between adaptive evolution and co-evolution, and they may overlap in different spaces and times. Obtaining more structural/functional information for these overlapping sites will be crucial for a deeper understanding of the relationship between adaptive evolution and co-evolution. Here, we present evidence at the molecular level about the adaptive evolution of Pteridaceae cpDNAs to different habitats and provide insight into the adaptive evolution and co-evolution of proteins.
Materials and methods
Sample collection
Fresh leaves of Pteris ensiformis, P. arisanensis, and Taenitis blechnoides were sampled from the campus of Shenzhen Fairy Lake Botanical Garden (location: E114°09′, N22°34′; altitude: 944 m), quickly frozen in liquid nitrogen, and stored at − 80 °C until use. The plant materials used in the study were identified by Ting Wang, and specimens were stored in the Herbarium of the College of Life Sciences, South China Agricultural University (Specimen numbers of P. ensiformis, P. arisanensis, and T. blechnoides are GXL20210903, GXL20210904 and GXL20210905, respectively).
Library preparation, sequencing and genome assembly
DNA was extracted from the samples using a Tiangen Plant Genome DNA Kit (Tiangen Biotech Co., Ltd., Beijing, China) according to the manufacturer’s instructions. The Illumina NovaSeq6000 platform was used for sequencing. The complete chloroplast genomes of P. arisanensis and T. blechnoides were assembled using GetOrganelle [78]. However, the complete chloroplast genome of P. ensiformis failed to assemble into a circle using GetOrganelle and was instead assembled using Novoplasty [79]. The sequences were submitted to the National Center for Biotechnology Information (NCBI) under GenBank accession numbers OP441371 (P. arisanensis), OP743918 (P. ensiformis), and OP743919 (T. blechnoides).
DNA sequence alignment and phylogenetic analysis
The complete chloroplast genomes of 38 Pteridaceae species and Alsophila denticulata (outgroup) were downloaded from GenBank (Table S1). Combining our three newly sequenced species, a total of 41 Pteridaceae species were examined, covering all subfamilies. Seventy-six common but different protein-coding sequences of these species were retained (Table S1), MAFFT [80] was used to perform sequence alignment, and the gap area was deleted to exclude poorly aligned positions. PhyloSuite [81] was used to concatenate these sequences into a dataset for phylogenetic analysis. The maximum likelihood (ML) tree was inferred using RAxML [82], GTRGAMMAI was selected as the nucleotide substitution model, and bootstrap values for each branch were obtained by performing 1,000 bootstrap replicates. The Bayesian inference (BI) tree was established by MrBayes [83] and was estimated by running 2,000,000 generations (Nst = 6, rates = invgamma).
Analysis of selection pressure and adaptive evolution
The 76 common non-repeating protein-coding sequences were used to build independent data sets (Table S1). The 41 Pteridaceae species were classified into three clades based on their habitat: the terrestrial, aquatic, and epiphyte clades. Before performing sequence alignment, the stop codon caused by RNA editing inside the sequences was modified, and the tail stop codon was removed. Alignment gaps and uncertainties were deleted to avoid false positives.
Selection pressure was analyzed using the CODEML [16] program. The ω values of each common protein-coding gene were calculated under the basic model (model = 0, Nsites = 0, which assumes no site-wise or branch-wise dN/dS variation). The branch model was applied by comparing the single-ratio model (M0) and two-ratio model (M2) (using the likelihood ratio test (LRT) with a χ2 distribution); the M0 hypothesis was rejected if P < 0.05. The M0 model assumes that all Pteridaceae clades have the same ratio of non-synonymous to synonymous substitution rates; the M2 model assumes different ω between the foreground clade and background clade. The false discovery rate (FDR) correction was applied to the P values calculated above [84].
Positive selection models (M2a and M8) and null hypothesis models (M1a, M7, and M8a) provided by PAML [16] were used to perform site adaptive evolutionary analyses on a dataset of shared genes from 41 Pteridaceae species. Three sets of nested models (M2a vs. M1a, M8 vs. M7, and M8a vs. M8) were used to infer the genes experiencing positive selection. If the positive selection model significantly outperformed the null hypothesis model (p < 0.05), the genes were assumed to be under positive selection, where M8a vs. M8 resulted in lower false positive results.
The branch-site model allows different site-encoding genes to have different values of ω in different branches of the phylogenetic tree in order to test whether positive selection acts on certain sites in the foreground clade. Model A (model = 2, Nsites = 2, fixed omega = 0, omega = 2) assumes that only the foreground clade undergoes positive selection; Model A null (model = 2, Nsites = 2, fixed omega = 1, omega = 1) fixes the ω of the foreground clade in model A to 1. If Model A is significantly better than Model A null (p < 0.05), then the gene has undergone positive selection in the foreground clade.
In the above models, the LRT was compared to a χ2 null distribution with the corresponding degrees of freedom. All sites under positive selection were retrieved using the Bayes empirical Bayes (BEB) method.
Natural selection pressure analyses
Parameter K was calculated for the data by running RELAX (implemented in HYPHY v2.5.42) [85] to test the relaxation of natural selection, the selection pressure in this context includes both purifying selection and positive selection. The K parameter is related to the value of ω as (ω background)K = (ω foreground) [85]. K < 1 is indicative of relaxed natural selection and K > 1 suggests intensification in the test compared to the background. RELAX was used for LRT analysis by comparing the model with K = 1 to the model with K < 1 (or K > 1). If K < 1, P < 0.05 indicates that the test clade was under significantly relaxed selection, and if K > 1, P < 0.05 indicates that the test clade was under significantly intensified selection.
Co-evolution analysis
To further explore adaptive evolution at the molecular level, co-evolution analysis was conducted on the protein sequences encoded by genes that have undergone adaptive evolution in a specific lineage, and the structures of proteins with co-evolved residue pairs were predicted in order to understand their co-evolutionary mechanism. Co-evolution analysis was performed using the program CAPS [24], which reveals structural and functional correlations between sites by detecting whether amino acid site variants are associated. The alpha-value in the program was set to 0.01; the random sampling value was set to 1000. Protein 3D structure was predicted using Phyre2 [86] online in INTENSIVE mode and visualized using PyMOL (http://www.pymol.org). Multiple sequences of co-evolved residues were checked using Jalview [54].
Electronic supplementary material
Below is the link to the electronic supplementary material.
Acknowledgements
We would like to thank Shenzhen Fairy Lake Botanical Garden for their support in providing the plant materials.
Authors’ contributions
Data analyses, visualization and curation were conducted by X.G. Sample collection were conducted by X.G., L.L and S.L. Funding and supervision were contributed by Y.S. and T.W. X.G., Y.S., T.W., L.L., S.L., W.S. and X.Z. all contributed towards investigation and manuscript complete. X.G. wrote the manuscript together with Y.S. and T.W. The study was conceptualized by X.G. and T.W. All authors read and approved the final manuscript.
Funding
This work was supported by the National Natural Science Foundation of China (31872670 and 32071781), Guangdong Basic and Applied Basic Research Foundation (2021A1515010911), Science and Technology Projects in Guangzhou (202206010107), and Project of Department of Science and Technology of Shenzhen City, Guangdong, China (JCYJ20190813172001780 and JCYJ20210324141000001).
Data availability
These sequence data have been submitted to the GenBank databases under accession numbers OP441371, OP743918 and OP743919. The data underlying this article are available in the article and in its online supplementary material.
Declarations
Ethics approval and consent to participate
Not applicable.
Consent for publication
Not applicable.
Competing interests
The authors declare no competing interests.
Footnotes
Publisher’s Note
Springer Nature remains neutral with regard to jurisdictional claims in published maps and institutional affiliations.
Contributor Information
Yingjuan Su, Email: suyj@mail.sysu.edu.cn.
Ting Wang, Email: tingwang@scau.edu.cn.
References
- 1.Timmis JN, Ayliffe MA, Huang CY, Martin W. Endosymbiotic gene transfer: organelle genomes forge eukaryotic chromosomes. NAT REV GENET. 2004;5(2):123–35. doi: 10.1038/nrg1271. [DOI] [PubMed] [Google Scholar]
- 2.Li M, Kim C. Chloroplast ROS and stress signaling. Plant Commun. 2022;3(1):100264. doi: 10.1016/j.xplc.2021.100264. [DOI] [PMC free article] [PubMed] [Google Scholar]
- 3.Chan KX, Crisp PA, Estavillo GM, Pogson BJ. Chloroplast-to-nucleus communication: current knowledge, experimental strategies and relationship to drought stress signaling. Plant Signal Behav. 2010;5(12):1575–82. doi: 10.4161/psb.5.12.13758. [DOI] [PMC free article] [PubMed] [Google Scholar]
- 4.Gu X, Zhu M, Su Y, Wang T. A large intergenic spacer leads to the increase in genome size and sequential gene movement around IR/SC boundaries in the chloroplast genome of Adiantum malesianum (Pteridaceae) INT J MOL SCI. 2022;23(24):15616. doi: 10.3390/ijms232415616. [DOI] [PMC free article] [PubMed] [Google Scholar]
- 5.Zhao C, Haigh AM, Holford P, Chen ZH. Roles of chloroplast retrograde signals and ion transport in plant drought tolerance. INT J MOL SCI. 2018;19(4):963. doi: 10.3390/ijms19040963. [DOI] [PMC free article] [PubMed] [Google Scholar]
- 6.Krasensky J, Broyart C, Rabanal FA, Jonak C. The redox-sensitive chloroplast trehalose-6-phosphate phosphatase AtTPPD regulates salt stress tolerance. Antioxid Redox Signal. 2014;21(9):1289–304. doi: 10.1089/ars.2013.5693. [DOI] [PMC free article] [PubMed] [Google Scholar]
- 7.Luo S, Kim C. Current understanding of temperature stress-responsive chloroplast FtsH metalloproteases. INT J MOL SCI. 2021;22(22):12106. doi: 10.3390/ijms222212106. [DOI] [PMC free article] [PubMed] [Google Scholar]
- 8.Phee BK, Cho JH, Park S, Jung JH, Lee YH, Jeon JS, Bhoo SH, Hahn TR. Proteomic analysis of the response of Arabidopsis chloroplast proteins to high light stress. Proteomics. 2004;4(11):3560–8. doi: 10.1002/pmic.200400982. [DOI] [PubMed] [Google Scholar]
- 9.Khan M, Nawaz N, Ali I, Azam M, Rizwan M, Ahmad P, Ali S. Regulation of photosynthesis under metal stress. Photosynthesis Productivity and Environmental Stress 2019:95–105.
- 10.Zhu JK. Abiotic stress signaling and responses in plants. Cell. 2016;167(2):313–24. doi: 10.1016/j.cell.2016.08.029. [DOI] [PMC free article] [PubMed] [Google Scholar]
- 11.Chan KX, Phua SY, Crisp P, McQuinn R, Pogson BJ. Learning the languages of the chloroplast: retrograde signaling and beyond. ANNU REV PLANT BIOL. 2016;67:25–53. doi: 10.1146/annurev-arplant-043015-111854. [DOI] [PubMed] [Google Scholar]
- 12.Woodson JD. Chloroplast quality control - balancing energy production and stress. NEW PHYTOL. 2016;212(1):36–41. doi: 10.1111/nph.14134. [DOI] [PubMed] [Google Scholar]
- 13.Zhao C, Wang Y, Chan KX, Marchant DB, Franks PJ, Randall D, Tee EE, Chen G, Ramesh S, Phua SY, et al. Evolution of chloroplast retrograde signaling facilitates green plant adaptation to land. Proc Natl Acad Sci. 2019;116(11):5015–20. doi: 10.1073/pnas.1812092116. [DOI] [PMC free article] [PubMed] [Google Scholar]
- 14.Mamaeva A, Taliansky M, Filippova A, Love AJ, Golub N, Fesenko I. The role of chloroplast protein remodeling in stress responses and shaping of the plant peptidome. NEW PHYTOL. 2020;227(5):1326–34. doi: 10.1111/nph.16620. [DOI] [PubMed] [Google Scholar]
- 15.Zhang Y, Zhang A, Li X, Lu C. The role of chloroplast gene expression in plant responses to environmental stress. INT J MOL SCI. 2020;21(17):6082. doi: 10.3390/ijms21176082. [DOI] [PMC free article] [PubMed] [Google Scholar]
- 16.Yang Z. PAML 4: phylogenetic analysis by maximum likelihood. MOL BIOL EVOL. 2007;24(8):1586–91. doi: 10.1093/molbev/msm088. [DOI] [PubMed] [Google Scholar]
- 17.Garud NR, Pollard KS. Population genetics in the human microbiome. TRENDS GENET. 2020;36(1):53–67. doi: 10.1016/j.tig.2019.10.010. [DOI] [PubMed] [Google Scholar]
- 18.Scobeyeva VA, Artyushin IV, Krinitsina AA, Nikitin PA, Antipin MI, Kuptsov SV, Belenikin MS, Omelchenko DO, Logacheva MD, Konorov EA, et al. Gene loss, pseudogenization in plastomes of genus Allium (Amaryllidaceae), and putative selection for adaptation to environmental conditions. FRONT GENET. 2021;12:674783. doi: 10.3389/fgene.2021.674783. [DOI] [PMC free article] [PubMed] [Google Scholar]
- 19.Zhang L, Yan HF, Wu W, Yu H, Ge XJ. Comparative transcriptome analysis and marker development of two closely related primrose species (Primula Poissonii and Primula wilsonii) BMC Genomics. 2013;14:329. doi: 10.1186/1471-2164-14-329. [DOI] [PMC free article] [PubMed] [Google Scholar]
- 20.Wang B, Jiang B, Zhou Y, Su Y, Wang T. Higher substitution rates and lower dN/dS for the plastid genes in Gnetales than other gymnosperms. BIOCHEM SYST ECOL. 2015;59:278–87. [Google Scholar]
- 21.Yang Z, Nielsen R. Codon-substitution models for detecting molecular adaptation at individual sites along specific lineages. MOL BIOL EVOL. 2002;19(6):908–17. doi: 10.1093/oxfordjournals.molbev.a004148. [DOI] [PubMed] [Google Scholar]
- 22.Smith DR. Mutation rates in plastid genomes: they are lower than you might think. GENOME BIOL EVOL. 2015;7(5):1227–34. doi: 10.1093/gbe/evv069. [DOI] [PMC free article] [PubMed] [Google Scholar]
- 23.Zhang ZR, Yang X, Li WY, Peng YQ, Gao J. Comparative chloroplast genome analysis of Ficus (Moraceae): insight into adaptive evolution and mutational hotspot regions. FRONT PLANT SCI. 2022;13:965335. doi: 10.3389/fpls.2022.965335. [DOI] [PMC free article] [PubMed] [Google Scholar]
- 24.Fares MA, McNally D. CAPS: coevolution analysis using protein sequences. Bioinformatics. 2006;22(22):2821–2. doi: 10.1093/bioinformatics/btl493. [DOI] [PubMed] [Google Scholar]
- 25.Chaurasia S, Dutheil JY. The structural determinants of intra-protein compensatory substitutions. MOL BIOL EVOL 2022, 39(4). [DOI] [PMC free article] [PubMed]
- 26.Jacob E, Unger R, Horovitz A. Codon-level information improves predictions of inter-residue contacts in proteins by correlated mutation analysis. ELIFE. 2015;4:e8932. doi: 10.7554/eLife.08932. [DOI] [PMC free article] [PubMed] [Google Scholar]
- 27.Basu S, Bahadur RP. Conservation and coevolution determine evolvability of different classes of disordered residues in human intrinsically disordered proteins. Proteins. 2022;90(3):632–44. doi: 10.1002/prot.26261. [DOI] [PubMed] [Google Scholar]
- 28.Dos SR, Jiang X, Martinez L, Morcos F. Coevolutionary signals and structure-based models for the prediction of protein native conformations. Methods Mol Biol. 2019;1851:83–103. doi: 10.1007/978-1-4939-8736-8_5. [DOI] [PubMed] [Google Scholar]
- 29.Codoner FM, Fares MA, Elena SF. Adaptive covariation between the coat and movement proteins of prunus necrotic ringspot virus. J VIROL. 2006;80(12):5833–40. doi: 10.1128/JVI.00122-06. [DOI] [PMC free article] [PubMed] [Google Scholar]
- 30.Song W, Qin Y, Zhu Y, Yin G, Wu N, Li Y, Hu Y. Delineation of plant caleosin residues critical for functional divergence, positive selection and coevolution. BMC EVOL BIOL. 2014;14:124. doi: 10.1186/1471-2148-14-124. [DOI] [PMC free article] [PubMed] [Google Scholar]
- 31.Lynch VJ. Inventing an arsenal: adaptive evolution and neofunctionalization of snake venom phospholipase A2 genes. BMC EVOL BIOL. 2007;7:2. doi: 10.1186/1471-2148-7-2. [DOI] [PMC free article] [PubMed] [Google Scholar]
- 32.Wang M, Zhang X, Zhao H, Wang Q, Pan Y. FoxO gene family evolution in vertebrates. BMC EVOL BIOL. 2009;9:222. doi: 10.1186/1471-2148-9-222. [DOI] [PMC free article] [PubMed] [Google Scholar]
- 33.Zhao F, Qin S. Evolutionary analysis of phycobiliproteins: implications for their structural and functional relationships. J MOL EVOL. 2006;63(3):330–40. doi: 10.1007/s00239-005-0026-2. [DOI] [PubMed] [Google Scholar]
- 34.Sen L, Fares MA, Liang B, Gao L, Wang B, Wang T, Su YJ. Molecular evolution of rbcL in three gymnosperm families: identifying adaptive and coevolutionary patterns. BIOL DIRECT. 2011;6:29. doi: 10.1186/1745-6150-6-29. [DOI] [PMC free article] [PubMed] [Google Scholar]
- 35.Kapoor B, Kumar P, Verma V, Irfan M, Sharma R, Bhargava B. How plants conquered land: evolution of terrestrial adaptation. J Evol Biol 2022. [DOI] [PubMed]
- 36.Wellman CH, Strother PK. The terrestrial biota prior to the origin of land plants (embryophytes): a review of the evidence. Palaeontology. 2015;58(4):601–27. [Google Scholar]
- 37.Bungard RA. Photosynthetic evolution in parasitic plants: insight from the chloroplast genome. BioEssays. 2004;26(3):235–47. doi: 10.1002/bies.10405. [DOI] [PubMed] [Google Scholar]
- 38.Kapralov MV, Filatov DA. Widespread positive selection in the photosynthetic rubisco enzyme. BMC EVOL BIOL. 2007;7:73. doi: 10.1186/1471-2148-7-73. [DOI] [PMC free article] [PubMed] [Google Scholar]
- 39.Iida S, Miyagi A, Aoki S, Ito M, Kadono Y, Kosuge K. Molecular adaptation of rbcL in the heterophyllous aquatic plant Potamogeton. PLoS ONE. 2009;4(2):e4633. doi: 10.1371/journal.pone.0004633. [DOI] [PMC free article] [PubMed] [Google Scholar]
- 40.Miwa H, Odrzykoski IJ, Matsui A, Hasegawa M, Akiyama H, Jia Y, Sabirov R, Takahashi H, Boufford DE, Murakami N. Adaptive evolution of rbcL in Conocephalum (Hepaticae, bryophytes) Gene. 2009;441(1–2):169–75. doi: 10.1016/j.gene.2008.11.020. [DOI] [PubMed] [Google Scholar]
- 41.Zhang Z, An M, Miao J, Gu Z, Liu C, Zhong B. The Antarctic Sea ice alga Chlamydomonas sp. ICE-L provides insights into adaptive patterns of chloroplast evolution. BMC PLANT BIOL. 2018;18(1):53. doi: 10.1186/s12870-018-1273-x. [DOI] [PMC free article] [PubMed] [Google Scholar]
- 42.Schuettpelz E, Schneider H, Smith AR, Hovenkamp P, Prado J, Rouhan G, Salino A, Sundue M, Almeida TIE, Parris B, et al. A community-derived classification for extant lycophytes and ferns. J SYST EVOL. 2016;54(6):563–603. [Google Scholar]
- 43.Zhang L, Zhou XM, Lu NT, Zhang LB. Phylogeny of the fern subfamily Pteridoideae (Pteridaceae; Pteridophyta), with the description of a new genus: Gastoniella. MOL PHYLOGENET EVOL. 2017;109:59–72. doi: 10.1016/j.ympev.2016.12.037. [DOI] [PubMed] [Google Scholar]
- 44.Schuettpelz E, Schneider H, Huiet L, Windham MD, Pryer KM. A molecular phylogeny of the fern family Pteridaceae: assessing overall relationships and the affinities of previously unsampled genera. MOL PHYLOGENET EVOL. 2007;44(3):1172–85. doi: 10.1016/j.ympev.2007.04.011. [DOI] [PubMed] [Google Scholar]
- 45.Rothfels CJ, Windham MD, Grusz AL, Gastony GJ, Pryer KM. Toward a monophyletic Notholaena (Pteridaceae): resolving patterns of evolutionary convergence in xeric-adapted ferns. Taxon. 2008;57(3):712–24. [Google Scholar]
- 46.Abotsi KE, Radji AR, Rouhan G, Dubuisson JY, Kokou K. The Pteridaceae family diversity in Togo. Biodivers Data J. 2015;3:e5078. doi: 10.3897/BDJ.3.e5078. [DOI] [PMC free article] [PubMed] [Google Scholar]
- 47.Prado J, Del Nero Rodrigues C, Salatino A, Salatino MLF. Phylogenetic relationships among Pteridaceae, including Brazilian species, inferred from rbcL sequences. Taxon. 2007;56(2):355–68. [Google Scholar]
- 48.Wei X, He M, Jin X. The first complete chloroplast genome of a mangrove fern, Acrostichum speciosum. Mitochondrial DNA. Part B. Resources 2020, 5(2):1413–1414.
- 49.Kirkpatrick RE. Investigating the monophyly of Pellaea (Pteridaceae) in the context of a phylogenetic analysis of cheilanthoid ferns. SYST BOT. 2007;32(3):504–18. [Google Scholar]
- 50.Schuettpelz E, Chen C, Kessler M, Pinson JB, Johnson G, Davila A, Cochran AT, Huiet L, Pryer KM. A revised generic classification of vittarioid ferns (Pteridaceae) based on molecular, micromorphological, and geographic data. Taxon. 2016;65(4):708–22. [Google Scholar]
- 51.Zhang L, Zhang LB. Phylogeny and systematics of the brake fern genus Pteris (Pteridaceae) based on molecular (plastid and nuclear) and morphological evidence. MOL PHYLOGENET EVOL. 2018;118:265–85. doi: 10.1016/j.ympev.2017.09.011. [DOI] [PubMed] [Google Scholar]
- 52.Schuettpelz E, Davila A, Prado J, Hirai RY, Yatskievych G. Molecular phylogenetic and morphological affinities of Adiantum senae (Pteridaceae). TAXON 2014, 63(2):258–264.
- 53.Lu JM, Wen J, Lutz S, Wang YP, Li DZ. Phylogenetic relationships of Chinese Adiantum based on five plastid markers. J PLANT RES. 2012;125(2):237–49. doi: 10.1007/s10265-011-0441-y. [DOI] [PubMed] [Google Scholar]
- 54.Waterhouse AM, Procter JB, Martin DM, Clamp M, Barton GJ. Jalview Version 2 - a multiple sequence alignment editor and analysis workbench. Bioinformatics. 2009;25(9):1189–91. doi: 10.1093/bioinformatics/btp033. [DOI] [PMC free article] [PubMed] [Google Scholar]
- 55.Nevo E. Evolution of genome-phenome diversity under environmental stress. Proc Natl Acad Sci U S A. 2001;98(11):6233–40. doi: 10.1073/pnas.101109298. [DOI] [PMC free article] [PubMed] [Google Scholar]
- 56.Wright BE. Does selective gene activation direct evolution? FEBS LETT. 1997;402(1):4–8. doi: 10.1016/s0014-5793(96)01479-2. [DOI] [PubMed] [Google Scholar]
- 57.Yang J, Wang ZL, Zhao XQ, Wang DP, Qi DL, Xu BH, Ren YH, Tian HF. Natural selection and adaptive evolution of leptin in the Ochotona family driven by the cold environmental stress. PLoS ONE. 2008;3(1):e1472. doi: 10.1371/journal.pone.0001472. [DOI] [PMC free article] [PubMed] [Google Scholar]
- 58.Iniguez C, Aguilo-Nicolau P, Galmes J. Improving photosynthesis through the enhancement of Rubisco carboxylation capacity. Biochem Soc Trans. 2021;49(5):2007–19. doi: 10.1042/BST20201056. [DOI] [PubMed] [Google Scholar]
- 59.Galmes J, Capo-Bauca S, Niinemets U, Iniguez C. Potential improvement of photosynthetic CO2 assimilation in crops by exploiting the natural variation in the temperature response of Rubisco catalytic traits. CURR OPIN PLANT BIOL. 2019;49:60–7. doi: 10.1016/j.pbi.2019.05.002. [DOI] [PubMed] [Google Scholar]
- 60.Qu Y, Sakoda K, Fukayama H, Kondo E, Suzuki Y, Makino A, Terashima I, Yamori W. Overexpression of both Rubisco and Rubisco activase rescues rice photosynthesis and biomass under heat stress. PLANT CELL ENVIRON. 2021;44(7):2308–20. doi: 10.1111/pce.14051. [DOI] [PubMed] [Google Scholar]
- 61.Ng J, Guo Z, Mueller-Cajar O. Rubisco activase requires residues in the large subunit N terminus to remodel inhibited plant Rubisco. J BIOL CHEM. 2020;295(48):16427–35. doi: 10.1074/jbc.RA120.015759. [DOI] [PMC free article] [PubMed] [Google Scholar]
- 62.Neupane P, Bhuju S, Thapa N, Bhattarai HK. ATP synthase: structure, function and inhibition. Biomol Concepts. 2019;10(1):1–10. doi: 10.1515/bmc-2019-0001. [DOI] [PubMed] [Google Scholar]
- 63.Rumeau D, Peltier G, Cournac L. Chlororespiration and cyclic electron flow around PSI during photosynthesis and plant stress response. PLANT CELL ENVIRON. 2007;30(9):1041–51. doi: 10.1111/j.1365-3040.2007.01675.x. [DOI] [PubMed] [Google Scholar]
- 64.Krause K, Maier RM, Kofer W, Krupinska K, Herrmann RG. Disruption of plastid-encoded RNA polymerase genes in Tobacco: expression of only a distinct set of genes is not based on selective transcription of the plastid chromosome. Mol Gen Genet. 2000;263(6):1022–30. doi: 10.1007/pl00008690. [DOI] [PubMed] [Google Scholar]
- 65.Hajdukiewicz PT, Allison LA, Maliga P. The two RNA polymerases encoded by the nuclear and the plastid compartments transcribe distinct groups of genes in Tobacco plastids. EMBO J. 1997;16(13):4041–8. doi: 10.1093/emboj/16.13.4041. [DOI] [PMC free article] [PubMed] [Google Scholar]
- 66.Oteri F, Sarti E, Nadalin F, Carbone A. iBIS2Analyzer: a web server for a phylogeny-driven coevolution analysis of protein families. NUCLEIC ACIDS RES 2022. [DOI] [PMC free article] [PubMed]
- 67.de Juan D, Pazos F, Valencia A. Emerging methods in protein co-evolution. NAT REV GENET. 2013;14(4):249–61. doi: 10.1038/nrg3414. [DOI] [PubMed] [Google Scholar]
- 68.Fares MA, Travers SA. A novel method for detecting intramolecular coevolution: adding a further dimension to selective constraints analyses. Genetics. 2006;173(1):9–23. doi: 10.1534/genetics.105.053249. [DOI] [PMC free article] [PubMed] [Google Scholar]
- 69.Shirai K, Inomata N, Mizoiri S, Aibara M, Terai Y, Okada N, Tachida H. High prevalence of non-synonymous substitutions in mtDNA of cichlid fishes from Lake Victoria. GENE 2014, 552(2):239–245. [DOI] [PubMed]
- 70.Starr TN, Thornton JW. Epistasis in protein evolution. PROTEIN SCI. 2016;25(7):1204–18. doi: 10.1002/pro.2897. [DOI] [PMC free article] [PubMed] [Google Scholar]
- 71.Rasmussen HN, Rasmussen FN. The epiphytic habitat on a living host: reflections on the orchid–tree relationship. BOT J LINN SOC. 2018;186(4):456–72. [Google Scholar]
- 72.Zhang Z, He Z, Xu S, Li X, Guo W, Yang Y, Zhong C, Zhou R, Shi S. Transcriptome analyses provide insights into the phylogeny and adaptive evolution of the mangrove fern genus Acrostichum. Sci Rep. 2016;6:35634. doi: 10.1038/srep35634. [DOI] [PMC free article] [PubMed] [Google Scholar]
- 73.Lloyd RM. Systematics of the genus Ceratopteris (Parkeriaceae), I. sexual and vegetative reproduction in hawaiian Ceratopteris thalictroides. AM FERN J. 1973;69(1):12–8. [Google Scholar]
- 74.Peng L, Yamamoto H, Shikanai T. Structure and biogenesis of the chloroplast NAD(P)H dehydrogenase complex. Biochim Biophys Acta. 2011;1807(8):945–53. doi: 10.1016/j.bbabio.2010.10.015. [DOI] [PubMed] [Google Scholar]
- 75.Wang P, Duan W, Takabayashi A, Endo T, Shikanai T, Ye JY, Mi H. Chloroplastic NAD(P)H dehydrogenase in Tobacco leaves functions in alleviation of oxidative damage caused by temperature stress. PLANT PHYSIOL. 2006;141(2):465–74. doi: 10.1104/pp.105.070490. [DOI] [PMC free article] [PubMed] [Google Scholar]
- 76.Sommer F, Drepper F, Haehnel W, Hippler M. The hydrophobic recognition site formed by residues PsaA-Trp651 and PsaB-Trp627 of photosystem I in Chlamydomonas reinhardtii confers distinct selectivity for binding of plastocyanin and cytochrome c6. J BIOL CHEM. 2004;279(19):20009–17. doi: 10.1074/jbc.M313986200. [DOI] [PubMed] [Google Scholar]
- 77.Rogalski M, Schöttler MA, Thiele W, Schulze WX, Bock R. Rpl33, a nonessential plastid-encoded ribosomal protein in Tobacco, is required under cold stress conditions. Plant Cell. 2008;20(8):2221–37. doi: 10.1105/tpc.108.060392. [DOI] [PMC free article] [PubMed] [Google Scholar]
- 78.Jin JJ, Yu WB, Yang JB, Song Y, DePamphilis CW, Yi TS, Li DZ. GetOrganelle: a fast and versatile toolkit for accurate de novo assembly of organelle genomes. GENOME BIOL. 2020;21(1):241. doi: 10.1186/s13059-020-02154-5. [DOI] [PMC free article] [PubMed] [Google Scholar]
- 79.Dierckxsens N, Mardulyn P, Smits G. NOVOPlasty: de novo assembly of organelle genomes from whole genome data. NUCLEIC ACIDS RES. 2017;45(4):e18. doi: 10.1093/nar/gkw955. [DOI] [PMC free article] [PubMed] [Google Scholar]
- 80.Katoh K, Standley DM. MAFFT multiple sequence alignment software version 7: improvements in performance and usability. MOL BIOL EVOL. 2013;30(4):772–80. doi: 10.1093/molbev/mst010. [DOI] [PMC free article] [PubMed] [Google Scholar]
- 81.Zhang D, Gao F, Jakovlic I, Zou H, Zhang J, Li WX, Wang GT. PhyloSuite: an integrated and scalable desktop platform for streamlined molecular sequence data management and evolutionary phylogenetics studies. MOL ECOL RESOUR. 2020;20(1):348–55. doi: 10.1111/1755-0998.13096. [DOI] [PubMed] [Google Scholar]
- 82.Stamatakis A. RAxML version 8: a tool for phylogenetic analysis and post-analysis of large phylogenies. Bioinformatics. 2014;30(9):1312–3. doi: 10.1093/bioinformatics/btu033. [DOI] [PMC free article] [PubMed] [Google Scholar]
- 83.Ronquist F, Teslenko M, van der Mark P, Ayres DL, Darling A, Hohna S, Larget B, Liu L, Suchard MA, Huelsenbeck JP. MrBayes 3.2: efficient bayesian phylogenetic inference and model choice across a large model space. SYST BIOL. 2012;61(3):539–42. doi: 10.1093/sysbio/sys029. [DOI] [PMC free article] [PubMed] [Google Scholar]
- 84.Storey JD, Tibshirani R. Statistical significance for genomewide studies. Proc Natl Acad Sci U S A. 2003;100(16):9440–5. doi: 10.1073/pnas.1530509100. [DOI] [PMC free article] [PubMed] [Google Scholar]
- 85.Wertheim JO, Murrell B, Smith MD, Kosakovsky Pond SL, Scheffler K. RELAX: detecting relaxed selection in a phylogenetic framework. MOL BIOL EVOL. 2015;32(3):820–32. doi: 10.1093/molbev/msu400. [DOI] [PMC free article] [PubMed] [Google Scholar]
- 86.Kelley LA, Mezulis S, Yates CM, Wass MN, Sternberg MJ. The Phyre2 web portal for protein modeling, prediction and analysis. NAT PROTOC. 2015;10(6):845–58. doi: 10.1038/nprot.2015.053. [DOI] [PMC free article] [PubMed] [Google Scholar]
Associated Data
This section collects any data citations, data availability statements, or supplementary materials included in this article.
Supplementary Materials
Data Availability Statement
These sequence data have been submitted to the GenBank databases under accession numbers OP441371, OP743918 and OP743919. The data underlying this article are available in the article and in its online supplementary material.