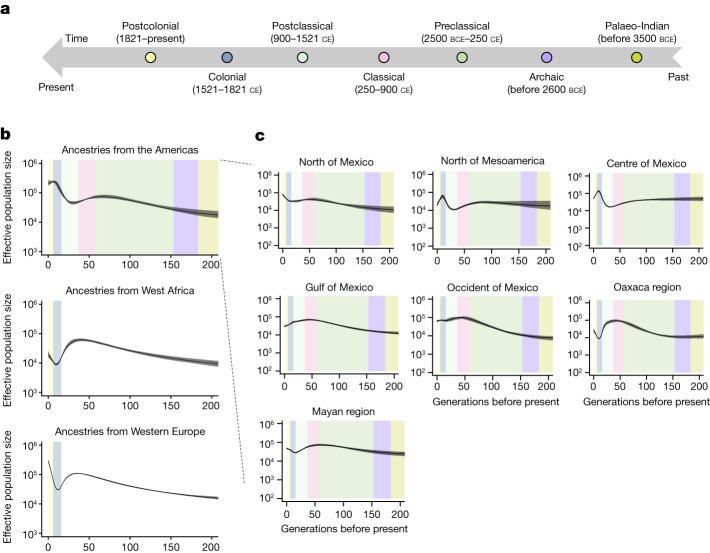
Fig. 2. Effective population size (Ne) values across ancestries and geographies reveal the histories present within Mexico.
a, Mesoamerican chronology colouring different periods in Mesoamerican history using an anthropological and archaeological context. b, Ancestry-specific effective population size (Ne) changes over the past 200 generations across Mexico (n = 5,436) inferred using IBD tracts, coloured by chronology from a assuming 30 years per generation. c, Ancestry-specific effective population size (Ne) changes over time for ancestries from the Americas in different regions of Mexico (see Supplementary Figs. 25–29 for other generation intervals and ancestries). n = 1,177, 640, 952, 590, 820, 315 and 938 for the north of Mexico, north of Mesoamerica, centre of Mexico, Gulf of Mexico, occident of Mexico, Oaxaca region and the Mayan region, respectively.

