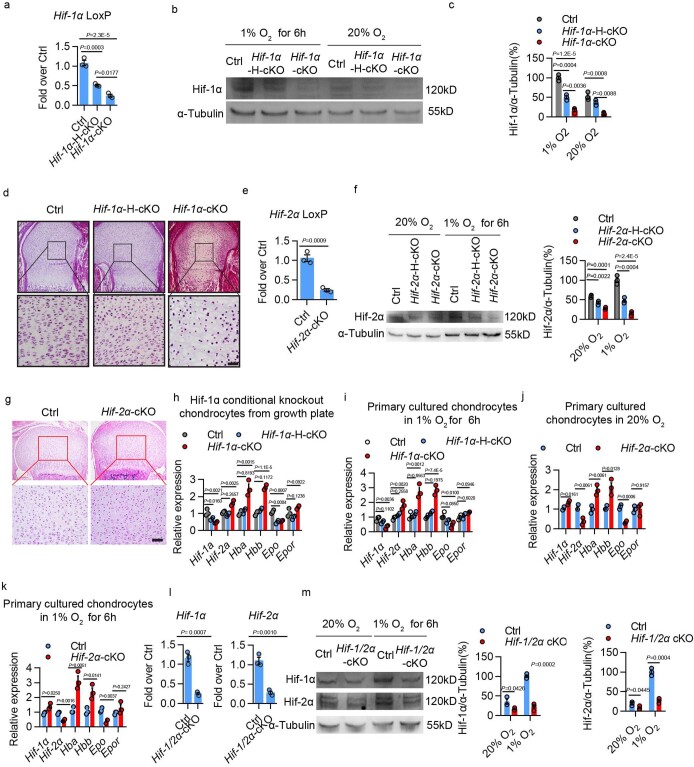
Extended Data Fig. 5. Expression of hemoglobin in chondrocytes with Hif-1α and/or Hif-2α deletion.
a, Detection of DNA recombinatrion by Hif-1α-LoxP qPCR of genomic DNA extracted from Hif-1αF/F (Ctrl), Hif-1αF/+/Col2a1-CreERT2 (heterozygous deletion, Hif-1α-H-cKO) or Hif-1αF/F/Col2a1-CreERT2 (Hif-1α-cKO) growth plates of P5 mice, which were treated by tamoxifen (100 mg/kg) for 4 days. Data were normalized to β2-microglobulin (n = 3 biologically independent samples). b, Western blot analysis of Hif-1α protein level in primary cultured chondrocytes in either 20% or 1% O2 for 6 h. For gel source data, see Supplementary Fig. 1c. c, Quantification of all biological replicates for Extended Data Fig. 6b. Data were normalized to α-tubulin (n = 3 biologically independent samples). d, Conditional knockout of Hif-1a resulted in massive cell death in the center of cartilaginous growth plate. Scale bar: 50 μm. n = 6 biologically independent samples. e, Hif-2α-LoxP qPCR of genomic DNA extracted from Hif-2αF/F (Ctrl) or Hif-2αF/F/Col2a1-CreERT2 (Hif-2α-cKO) growth plates of P5 mice, which were treated by tamoxifen (100 mg/kg) for 4 days. Data were normalized to β2-microglobulin (n = 3 biologically independent samples). f, Quantification of Hif-2α protein by Western blot analysis of total protein lysate extracted from Ctrl (Hif-2αF/F), Hif-2α-H-cKO (heterozygous deletion, Hif-2αF/+/Col2a1-CreERT2) or Hif-2α-cKO (Hif-2αF/F/Col2a1-CreERT2) primary cultured chondrocytes in either 20% or 1% O2 for 6 h. A representative Western blot is shown on the left, and quantification of all biological replicates is provided on the right. Data were normalized to α-tubulin (n = 3). For gel source data, see Supplementary Fig. 1d. g, Conditional knockout of Hif-2a resulted in no massive cell death in the center of P5 Hif-2α-cKO cartilaginous growth plate. Scale bar: 50 μm. n = 6 biologically independent samples. h, Expression of the indicated genes in chondrocytes of mouse fetal growth plates upon conditional knockout of Hif-1α. n = 3 biologically independent samples. i, Expression of the indicated genes in primary cultured chondrocytes of mouse fetal growth plates upon conditional knockout of Hif-1α in 1% O2 for 6 h. n = 3 biologically independent samples. j, k, Expression of the indicated genes in primary cultured chondrocytes of mouse fetal growth plates upon conditional knockout of Hif-2α in either 20% (j) or 1% O2 (k) for 6 h. n = 3 biologically independent samples. l, Hif-1α and Hif-2α (Hif-1/2α) LoxP qPCR of genomic DNA extracted from Hif-1αF/F/Hif-2αF/F (Ctrl) or Hif-1αF/F/Hif-2αF/F/Col2a1-CreERT2 (Hif-1/2α-cKO) growth plates of P5 mice, which were treated by tamoxifen (100 mg/kg) for 4 days. Data were normalized to β2-microglobulin (n = 3 biologically independent samples). m, Quantification of Hif-1α and Hif-2α protein by Western blot analysis of total protein lysate extracted from Ctrl or Hif-1/2α-cKO primary cultured chondrocytes in either 20% or 1% O2 for 6 h. A representative Western blot is shown on the left, and quantification of all biological replicates is provided on the right. Data were normalized to α-tubulin (n = 3 biologically independent samples). For gel source data, see Supplementary Fig. 1e. Error bars represent SEM. P values were calculated using one-way ANOVA tests (a, c, f, h, i) or two-tailed Student’s t-test (e, j, k, m, l). The exact P-values of comparison are presented in the figures, respectively.

