

Abstract
In recent years, water pollution has become one of the most dangerous problems facing the world. Pollution of water with heavy metals and different dyes has caused many harmful effects on human health, living organisms and our environment. In this study, iron oxide nanomagnetic composite from Pterocladia Capillacea red algae-derived activated carbon (PCAC-IO) was synthesized by co-precipitation method using different iron salts and different base solutions. The synthesized nanocomposite was investigated with various characterization techniques such as FTIR, BET, SEM-EDX, TEM, XRD, and VSM. The obtained PCAC-IO adsorbent was used for Cr6+ ions and Mordant Violet 40 (MV40) dye removal. The adsorption mechanism of Cr6+ ions and MV40 dye on PCAC-IO was examined using several adsorption and kinetic isotherm models. Langmuir and Freundlich models were investigated using experimental data. Pseudo-first-order (PFO), Pseudo-second-order (PSO) and intraparticle diffusion models (IPDM) were applied to identify the adsorption mechanism. It has shown that the PSO kinetic model fits better with the experimental data obtained from PCAC-IO. This result can be interpreted as the adsorption of the adsorbate on the nanocomposite as chemical adsorption. The optimum conditions for maximum Cr6+ ions removal (96.88%) with PCAC-IO adsorbent occur at room temperature, 5 g L−1 adsorbent concentration, 100 mg L−1 initial pollutant concentration, pH 1 and at the end of 180 min, while maximum MV40 dye removal (99.76%), other conditions being the same, unlikely it occurred at pH 2.06 and after 45 min. The most suitable model for Cr6+ ions removal under the conditions of 1 L−1 g adsorbent concentration and 400 mg L−1 adsorbate concentration was Langmuir (Qmax = 151.52 mg g−1), while for MV40 removal it was Freundlich (Qmax = 303.03 mg g−1). We propose the use of activated carbon-supported iron oxide prepared from bio-waste material, especially from Pterocladia Capillacea red algae, as a promising adsorbent with high efficiency in the removal of Cr6+ ions and MV40 dye from aqueous media.
Subject terms: Environmental chemistry, Pollution remediation, Chemical engineering
Introduction
Organic contaminants, poisonous chemicals, synthetic compounds, and different complex molecules have recently been discovered in water supplies as a result of population development, fast industrialization and global warming. This has become an important problem for humanity. Therefore, conserving water, utilizing it wisely, and reusing it after purification can affect a variety of factors. Industrial wastewater pollutes environmental waters. These environmental waters are very dangerous because they mix with the drinking and use water of humans and animals. The way to prevent this is to purify these waters and make them reusable1–3.
Toxic dyes, which cause significant water pollution and environmental problems by affecting human health, aquatic life and ecological balance, are frequently used in industries such as textile, paper, chemicals, food processing, fertilizers, metal coating, batteries, pesticides, refineries, cosmetics, plastics and pharmaceuticals1–6. Most textile dyes are water soluble and prevent light from penetrating the aquatic environment, so they can cause harmful and toxic effects on human health, such as cancer. Azo dyes are one of the dye classes that are widely used in textile dyes and many industries7,8. They contain (–N=N–) bonds in their chemical structure9. Mordant Violet dye (C.I. 14,745) is an example of a dye containing only one azo group10. This dye can be found in the aquatic environment, is toxic and mutagenic to the ecosystem. It may cause harmful effects on organisms. This effect depends on the exposure time and concentration of the azo dye in water11.
Industrial wastewater contains heavy metals such as lead, zinc, chromium, copper, mercury, arsenic, and nickel, which are very dangerous for all living things12–14. Even very small amounts of these metals threaten all living things in the ecosystem. These waters, which must be given to the environment in some way, must be purified and comply with certain standards.
Chromium is one of the heavy metals whose compounds are widely used in chemical industries15–17. Common usage areas; leather tanning, electroplating, wood preservation, textile, metal plating, and chromate preparation industries18,19. Additionally, it serves as an oxidizing agent in the production of several organic compounds. The two oxidation states of chromium that are most prevalent are Cr3+ and Cr6+ ions. In an atmosphere of aerated water, all other oxidation states are unstable. It has been discovered that Cr6+ ion is hazardous to stem cells and living things20. Additionally, it is extremely mutagenic and carcinogenic, harming human health. About 100 times more hazardous than Cr3+ is Cr6+ ions21. Both natural and man-made sources of Cr6+ ion exist. Compounds containing chromium are often utilized and built up in the environment. In general, the concentration of Cr6+ ions in drinking water should be lower than the WHO-predicted 50 μg/L. Chromate contamination in wastewater is a problem that has to be addressed immediately. Therefore, removing Cr6+ ions from the environment is crucial and required22,23.
It is very important to remove and/or recover heavy metals and dyestuffs, which are toxic and/or carcinogenic. This can cause serious problems in terms of living and environmental health, by appropriate methods. Different methods are used to effectively remove heavy metal ions and dyestuffs from water sources. Examples of these are ion exchange, photocatalysis, coagulation, photodegradation, biological treatment, chemical oxidation/reduction, reverse osmosis and ultrafiltration24–28. These methods have some disadvantages such as high cost, less efficiency, other waste products and so on. On the other hand, adsorption as an alternative method has advantages such as low cost, low energy requirement, simplicity of design, ease of use, high efficiency and reuse of adsorbents29. It is thought that it will be a suitable choice especially when using environmentally friendly, cheap and safe adsorbents with the potential to reduce dyestuffs and heavy metals. Because of its low cost, high adsorption capacity, and simple regeneration, the use of metal-based nanoparticles is a common approach in the removal of dyes and heavy metals30,31.
Titanium dioxide (TiO2), zinc oxide (ZnO), iron oxide (Fe3O4), copper oxide (CuO), nickel oxide (NiO), and aluminum oxide (Al2O3) nanomaterials are well-known metal-based nano adsorbents for dye and heavy metal removal32–34. By reducing the particle size, metal oxide nanoparticles were able to absorb more substances. In order to simultaneously remove metal and organic contaminants, metal hydroxide nanoparticles are adsorbed into the skeleton of activated carbon or other porous materials35. By altering the pH of the fluid, it is also possible to regenerate these metal-based nanoparticles, and after numerous regenerations, they are still functional. Iron oxides are of great importance because the first magnetic material used by human beings is natural magnetite. Iron oxides are composed of different magnetic properties and different chemical components. The most important of these iron oxides are; Fe3O4 (magnetite), α-Fe2O3 (hematite), γ-Fe2O3 (maghemite), and FexO (vustite)36. Iron oxides have different chemical components and magnetic properties. Oxides such as Fe3O4, γ-Fe2O3, MO.Fe2O3 (M=Co, Ni, Mn etc.), which show ferrimagnetism in bulk state, shows superparamagnetism at the nanoscale37,38. Magnetic separation is a renewable recycling technology that is widely applied in chemistry, physics and other separation processes such as drug delivery, catalysis, magnetic resonance imaging (MRI), tissue repair and molecular diagnostics due to its fast and non-contact magnetic response39,40. Fe3O4 nanoparticles can adsorb various dyes from the aquatic environment. The problem with the use of magnetite as an adsorbent is its aggregation in the aqueous medium. This causes a decrease in surface area, so the adsorption capacity is reduced6,41. It also contains many surface functional groups involved in adsorbing these pollutants from water42. Due to their simple phase separation and preparation, as well 9as their ability to treat a high volume of wastewater in a short amount of time, magnetic nano adsorbents have attracted a lot of attention for the treatment of wastewater43.
Activated Carbon (AC), is used for different purposes in many industries. It can be defined as substances whose inner surface area and pore volume are increased by physically or chemically activating substances whose composition mostly consists of carbon44–49. Since activated carbon can adsorb a wide variety of molecules on its inner surface, it is used for the adsorption of various substances in the solid or gas phase50. Activated carbon is used in a very wide area, especially in the health sector, purification of gases and drinking water, separation of mixtures, purification in the food industry, wastewater treatment, carbon additive in the metal industry, protective clothing in the defense industry, explosives in the weapons industry, bomb-making to silence electronic systems51,52. A variety of raw materials, including those derived from minerals, plants, and animals, can be used to make activated carbon53. There are many studies on the development of activated carbon adsorbents from low-cost natural materials and some agricultural waste materials using adsorbents such as fly ash, rice paddy, corn tassel, poplar leaf powders, orange peel, nutshell, tea leaf, apricot kernel, eggshell, sugar cane pulp, coconut shell, bamboo wood sawdust and algae54–57. Utilizing activated carbon made from agricultural wastes has a number of benefits, including a large surface area, a microporous structure, high adsorption capacity, and high reactivity58. The investigations confirm that adsorbent surface area, surface shape, and pore size distribution also affect adsorption effectiveness59.
This study is about the preparation of activated carbon-iron oxide nanocomposites prepared from Pterocladia Capillacea red algae for the removal of Cr6+ ions and Mordant Violet 40 dye from aqueous media. No studies have been reported in the literature using iron oxide nanocomposite synthesized from Pterocladia Capillacea red algae for the removal of MV40 dye (C.I. 14745).
Materials and methods
Materials
Activated charcoal powder was purchased from Fisher Scientific, UK. Pterocladia Capillacea red algae were collected from Abou quir Coast, Alexandria, Egypt. Iron (III) Nitrate Nona hydrate (98%), and Iron (II) chloride hydrate were obtained from LOBA Chemie Company. Ferrous Sulphate Heptahydrate (FeSO4.7H2O), Ferric chloride (FeCl3), Ammonia solution (25%), Sodium hydroxide, Sodium carbonate and Ethanol were obtained from El Nasr Company. Hydrogen peroxide (50%) was purchased from Gateway Company, Hydrochloric acid solution (37%) and Sulfuric acids (98%) were purchased from Merck Company; Potassium dichromate was purchased from Sigma Aldrich Company. MV40 dye salt (C.I. 14745) was purchased from ISMA dye Company, Kafer El dwar, Egypt.
Preparation and activation of Pterocladia Capillacea red algae (PC)
Several quantities of Pterocladia Capillacea red algae were collected from Abu Quir Coast, Alexandria, Egypt. The algae were cleaned and washed with tap water followed by distilled water to remove dirt and sand, and then dried well in an oven (105 °C). The dried algae were cut and ground by a kitchen grinder to obtain a powder form then the chemical activation for algae powder was done by pouring 600 ml of sodium carbonate solution (0.471 mol L−1) (10 w/w %) into 300 g from Pterocladia Capillacea powder and the mixture was mixed well to be homogenous, After that the mixture was dried at oven at 105 °C. After cooling at room temperature the activated algae powder was weighed. Ucar et al.60 used Na2CO3 solutions for activation in their research .
Preparation of Pterocladia Capillacea derived activated carbon (PCAC)
A specific amount (20 g) of activated algae was taken and put in a muffle furnace device under a nitrogen gas stream at 900 °C for 1 h to form surface pores in activated carbon through its synthesis according to Ibrahim et al.61. The nitrogen gas was used to expel any oxygen gas present to prevent the combustion of raw algae. The temperature was raised to 900 °C within 30 min. After that, the activated carbon was cooled at room temperature, and then washed with distilled water several times and refluxed using HCl solution (1 N) for 6 h to remove any impurities or inorganic materials attached to the carbon during synthesis62. After that, the activated carbon was washed with hot water then followed by distilled water several times and filtered under gravity. The obtained carbon was dried in an oven (105 °C) and weighed. After that, the activated carbon was sieved using 100-micron sieve to obtain the activated carbon in powder form and called PCAC.
Surface Modification of Pterocladia Capillacea derived activated carbon (PCAC after treatment or oxidation)
A specific amount (1300 ml) of hydrogen peroxide solution (12%) was poured into 60 g of activated carbon from algae (PCAC) in a 2 L glass beaker in the presence of an ozone stream for 2 h using an ozone generator. After that, the suspension was filtered and washed with distilled water several times followed by ethanol until its pH was approximately neutral. The modified activated carbon was dried in an oven at 105 °C to remove moisture and weighed to give 56.19 g of the prepared material then the material was ground well by a porcelain mortar and the obtained material was called PCAC after treatment. This method was modified according to Moreno-Castilla et al.63 and Valdés et al.64.
Preparation of iron oxide-activated carbon nano-composite from Pterocladia Capillacea (PCAC-IO) by Co-precipitation method
A similar method mentioned above was used to prepare iron oxide nanocomposite from PC with some modifications. 20 g of modified activated carbon from red algae (PCAC after treatment) was dispersed in 850 ml distilled water in a 1 L round flask and then sonicated by the ultrasonic bath at 40 °C for 30 min. The mixed iron salts solutions were prepared by dissolving a 162.20 g of ferric chloride salt (0.08 mol) and 12.98 g of ferrous sulfate heptahydrate (FeSO4.7H2O) salt (0.04 mol) in 480 ml of distilled water in another flask then stirred the iron solution at 55 °C for 5 min by a sonicator, 64 ml of ammonia solution (25%) was added drop by drop into the prepared iron solutions until the pH of the iron oxide precipitate is 9.5–9.83. A flask containing the activated carbon from algae (PCAC after treatment) was poured into the prepared iron oxide contained flask in a basic medium then excess ammonia solutions (approximately 39 ml) were added until pH is 9.76. The mixture was stirred in a sonicator for 20 min at 55 °C, after this time, the flask was put on a magnetic stirrer for continuous and vigorous stirring at 90 °C for 3 h at 1300 rpm in the presence of a condenser to cool and condense the vaporized base. After that the obtained iron oxide precipitate was cooled to room temperature, filtered and washed several times with distilled water until its pH was 6 to 7, then dried at oven regulated to 105 °C to give 27.61 g of PCAC-IO powder and it was used for the removal experiments. This method was modified from Magnacca et al.65.
Characterization
FT-IR Spectrophotometer with ATR unit was used to determine the surface functional group on PCAC-IO powders and PCAC after treatment. The spectrum was obtained in the wavelength range (4000–400 cm−1). Fourier Transform Infrared Spectrophotometer was used Bruker VERTEX 70 spectrophotometer with ATR platinum unit.
Nitrogen –adsorption Isotherm was used to measure the surface area, pore volume, and pore size distribution of the prepared samples (PCAC after treatment, PCAC-IO). Before measurements, the samples were degassed at 77 K, pressure P/P0 = 0.99. The average pore diameter and total surface area were calculated by a Brunauer, Emmett and Teller (BET) equation by BELSORP MINI II, VERSION 1.2.5 Surface area analyzer.
Our prepared samples (PCAC after treatment and PCAC-IO) were characterized by X- ray diffraction device, (model No, 202964) from Beni Sweif University to identify the phase compositions and the degree of crystallinity. The XRD pattern was obtained at Cu-Kα radiation at 10 mA with a wavelength of 1.54 Å in the 2θ region of 10°–80° at 25 °C.
The particle size and morphology of the PCAC-IO sample were determined using ESL Transition Electron microscopy from Scientific Researches City. The samples were prepared by using 2 mg of the powder in 5 ml ethanol and stirred in a centrifuge device. On a copper grid, a drop of the sample suspension was dropped and then the samples were tested individually.
The surface morphology, porosity of PCAC after treatment and PCAC-IO samples were investigated using an analytical Scanning Electron Microscope (JEOL JSM-6360LA). The SEM micrographs were taken at different magnifications. The powdered samples were coated with a gold layer to increase the conductivity and clear the images obtained.
VSM device from Beni Sweif University was used to measure the magnetic property of the two nano-composites PCAC-IO respectively. The magnetic field G was from + 20 KOe to − 20 KOe.
Analyticjena Spekol 1300 UV–VIS Spectrophotometer, (Model No 4560002, Cole Parmer Instrument Co., USA) was used to determine the concentration of Cr6+ ions and MV40 dye in aqueous solutions.
Adsorption experiments
A stock solution of 1000 mg/L of Cr6+ ions solution and MV40 dye were prepared separately by dissolving a certain amount of K2Cr2O7 and MV40 dye salts, respectively, in 1000 ml of distilled water in a volumetric flask separately. Dilute concentrations of the Cr6+ ions and MV40 dye stock solutions were prepared separately from their stock solutions. The adsorption batches were done by adding different dosages of PCAC-IO Composite (100, 150, 200, 250 mg) to different concentrations of Cr6+ ions and MV40 dye solutions (100, 150, 200, 300, 400 ppm) separately. The volume of each concentration was 100 ml in a conical flask; the adsorbent-adsorbate suspensions were shaken at 200 rpm and room temperature using a shaker reaching 180 min of equilibrium time for each pollutant individually. A sample of each solution was taken at an interval time to analyze the concentration of residual Cr6+ ions and dye in solutions, respectively. The samples were analyzed until attaining equilibrium; the equilibrium was after 3 h from adsorption experiments in the case of Cr6+ ions and MV40 dye solutions. All experiments were doublicated and only the mean result was reported and used for the analyses.
In case of Cr6+ ions and MV40 dye solutions adsorption tests, 0.5 ml of Cr6+ ions and MV40 dye samples were taken at interval times (5, 10, 20, 30, 45, 60, 90, 120, 150, 180 min); then the composites were separated from solutions by centrifuging them at 6000 rpm for 5 min and the magnet was used to prevent the dispersion of magnetic composites in solutions and separation of the samples. After separating the solutions of Cr6+ ions and also the mordant dye, the filtrates were measured by the spectrophotometer device at absorbance wavelengths of 540 and 510 nm, respectively, to determine the residual concentrations of each adsorbate individually. The effect of pH, nano-composite dosage, initial concentration of adsorbates and contact time was studied in the removal experiments of Cr6+ ions and MV40 dye from aqueous solutions by prepared iron oxide nano-composite (PCAC-IO).
The experimental data from adsorption batches were tested by using different adsorption isotherm and kinetic models such as Langmuir, Freundlich, Pseudo-first-order, Pseudo-second-order and Intraparticle diffusion models. These models facilitated to know the mechanism of adsorption in our study on nanocomposite adsorbent. The removal % (R%) can be obtained by the following Eq. (1):
| 1 |
where C0 and Ct are the initial and final concentrations of adsorbate in aqueous solution respectively. Adsorption uptake or capacity q (mg g−1) can be calculated from Eq. (2):
| 2 |
where m is the mass of the iron oxide nanocomposite in grams and V is the volume of the adsorbate solution in Liter (L).
The pH of different solutions was studied at 1 g L−1 of adsorbent dosage (PCAC-IO), 100 ml solution of 100 mg L−1 of Cr6+ ions and MV40 dye concentrations individually for 180 min of contact time. The pH of Cr6+ ions concentrations and the MV40 dye solutions ranged from strongly acidic to strong basic solutions (pH = 1 to 11), the studied pH of the adsorbate solution was slightly decreased or increased from this pH range.
Results and discussion
Characterization of adsorbent
FTIR analyses
Fourier transform infrared was used to characterize the manufactured materials (PCAC, PCAC after treatment, and PCAC-IO), as seen in Fig. 1. A large peak at 3200 cm−1 was found in the three FTIR spectra of PCAC, PCAC after oxidation, and PCAC-IO nanocomposite; this peak is caused by the OH group. The C–C bond in the activated carbon structure with slight wave number changes were responsible for the peaks at 2394, 2349, and 2351 cm−1 in all spectra. The C–O deformation and C–C bond cause three peaks to appear at 1085, 1086, and 1046 cm−1. Due to the production of iron oxide, the Fe–O stretching bond emerged at 597 cm−1 with great intensity.
Figure 1.

FTIR spectrum for PCAC, PCAC After oxidation and PCAC-IO Nanocomposite.
BET analyses
Using the BET equation, the surface area and pore information of the produced nano-composites and their constituent materials were calculated. The pore volume (Vt) for the adsorbent and its precursor components was calculated using nitrogen adsorption at relative pressure P/P0 = 0.99. The nano-composite of produced activated carbon and its pore diameter were measured.
According to BET analysis, Table 1 and Fig. 2 demonstrate that the specific surface areas of the PCAC, PCAC after oxidation, and PCAC-IO were 164.84, 165.11, and 51.414 m2/g, respectively. The results demonstrate the nitrogen adsorption–desorption isotherms of the adsorbents and its precursor substances as previously mentioned; they show that they were type 4 isotherms, and the structure of PCAC before and after treatment, as well as its iron oxide nanocomposite, were mesoporous according to IUPAC classification66. This resulting magnetic composite (PCAC-IO) has a total pore volume of 0.136 cm3/g. According to the findings, the impregnation of iron oxides in a carbon structure produced a reduction in the manufactured material's surface area from 164.84 to 51.414 m2/g, which blocked pores in the carbon structure.
Table 1.
Data of surface analysis of activated carbon synthesized from PC, PCAC after oxidation and its Composite (PCAC-IO).
| Surface analysis | PCAC | PCAC after oxidation | PCAC-IO |
|---|---|---|---|
| Pore diameter (nm) | 3.2957 | 3.5703 | 10.591 |
| Pore volume (cm3 g−1) | 0.1358 | 0.1474 | 0.1361 |
| Surface area (m2 g−1) | 164.84 | 165.11 | 51.414 |
Figure 2.
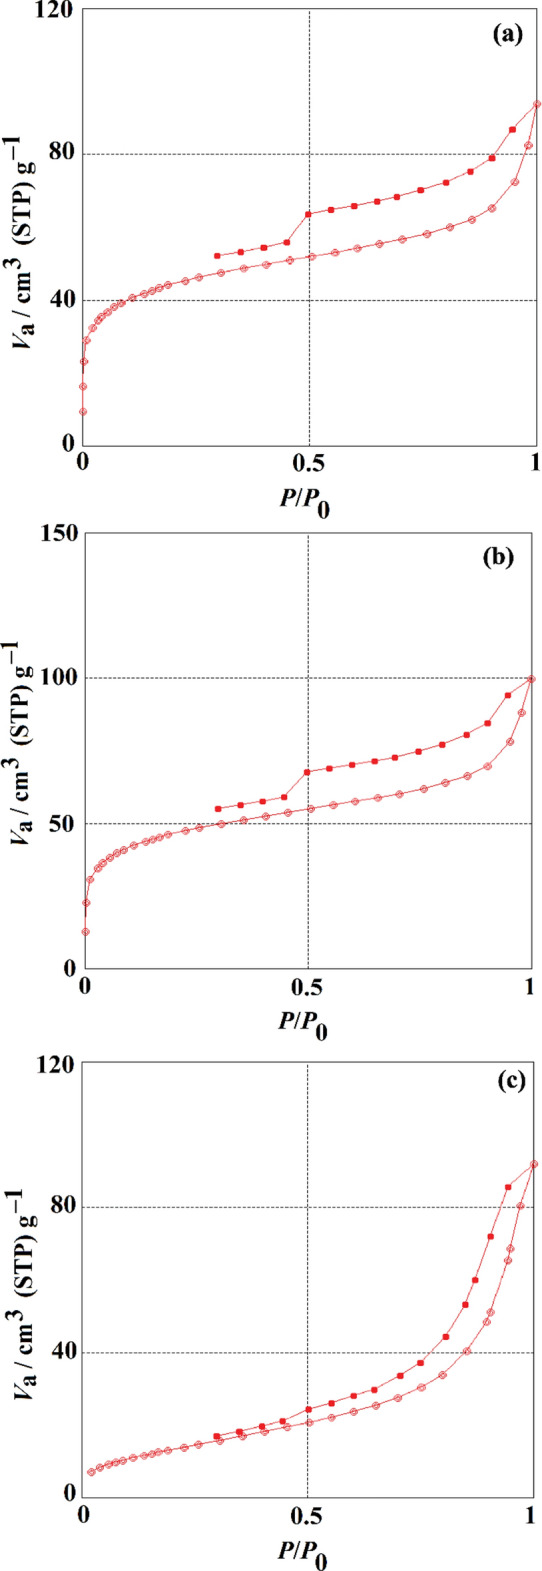
N2 adsorption–desorption isotherm plot of (a) PCAC, (b) PCAC after oxidation and (c) PCAC-IO Nanocomposite.
SEM–EDX and TEM analyses
As seen in Fig. 3, SEM–EDX analysis was used to determine the elements of the adsorbent and iron oxide nanocomposite we prepared after processing. The PCAC-IO nano-composite and its activated carbon after oxidation PCAC were analyzed and confirmed the presence of several elements such as Carbon, Oxygen, Aluminum, Silicon, Phosphorous, Sulfur, Calcium and Chlorine with weight percentages 81.67, 14.73, 0.25, 0.64, 0.38, 0.68, 1.35, 0.30, respectively for PCAC after oxidation, the same element exists in the EDS analysis for PCAC-IO adsorbent with different weight % in addition to the presence of iron element with 28.95 weight %. Due to the presence of the element Fe in the PCAC-IO structure during synthesis, the amount of carbon in the weight reduced from 81.67 to 50.94%.
Figure 3.
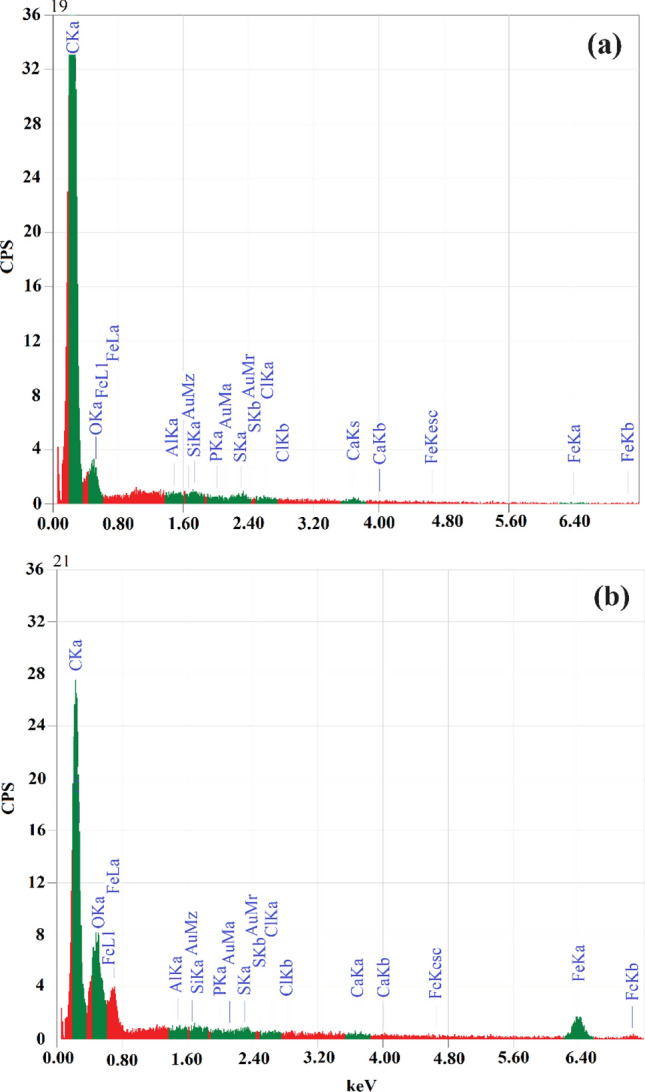
EDS data chart of (a) Pterocladia capillacea activated carbon after treatment, (b) PCAC-IO Nano-composite.
As demonstrated in Fig. 4, the surface morphology and form of the produced adsorbents following treatment (oxidation) and their iron oxide nanocomposites were studied using a scanning electron microscope operating at 15 kV. Figure 4a displays a scanning electron microscopy image of a PCAC-IO nanocomposite at magnifications of 1500 × and 2,500 x. The image reveals that the adsorbent surface is rough, iron oxide nanoparticles are dispersed on the surface of the composite and block its pores, and irregularly shaped particles are also visible. These characteristics enhance the adsorption of Cr6+ ions and MV40 dye from its solution.
Figure 4.

SEM (a) and TEM (b) images of PCAC-IO at 15 kV and 2500 X magnification.
The ranges of the nano-sized composite and its form were determined using a transition electron microscope (TEM-2100), and the TEM picture of the PCAC-IO nanocomposite is displayed in Fig. 4b. The TEM image of the PCAC-IO nano-adsorbent revealed that the iron oxide (magnetite) particles were spherical and gathered together on the surface of the activated carbon, which decreased the PCAC-IO's surface area after synthesis. The particle size ranged from 13.11 to 22.64 nm, this represented the preparation of iron oxide nanocomposite.
VSM analyses
In order to investigate the magnetic property, the magnetite iron oxide nano-composite (PCAC-IO) was examined. The synthesized nanocomposite magnetization curve at room temperature in a magnetic field with a cycle of − 20 to + 20 KOe. According to Fig. 5, the maximum saturation magnetization for PCAC-IO was 17.773 emu/g. It is exhausted from this result that the prepared nano-magnetic adsorbent can be separated from the water environment after the adsorption process is completed.
Figure 5.
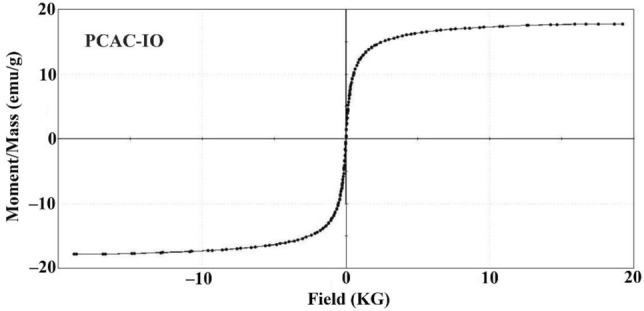
Magnetization curve for PCAC-IO nanocomposite.
XRD analyses
The analysis of XRD of prepared nano-composites and their pristine materials at Cu- Kα radiation at 25 °C. In the case of materials prepared from Pterocladia capillacea algae, Fig. 6a showed two peaks appeared at angles 2θ = 22.73 and 26.54 0 which are indicated the activated carbon prepared from the red algae using Na2CO3 solution as a chemical activator and a muffle furnace as a conversion device for synthesis it. The sharp peaks at 26.54 indicate the graphitic activated carbon as it was prepared at a high temperature, 900 °C. Figure 6b shows the XRD analysis of PCAC after oxidation that appears two peaks, one at 26.50 indicated to the graphitic activated carbon prepared from PC red algae and the other peak at 35.480 indicated to magnetite or maghemite with a small intensity which may be prepared before adding the Iron salts during a co-precipitation method due to the presence of impurities in the algae like Fe within its structure67 as previously shown in EDS analysis. Figure 6c shows the analysis of PCAC-IO nano-composite prepared from Pterocladia capillacea algae, the graph shows different peaks with different angle diffractions 2θ at 30.27, 35.57, 43.17, 53.75, 57.23, 62.88 due to the presence of iron oxide cubic structure that may be magnetite or maghemite phases68. The average crystalline size of the prepared iron oxide nanocomposites was determined from the XRD results; it was calculated from Scherrer’s formula,
| 3 |
Figure 6.
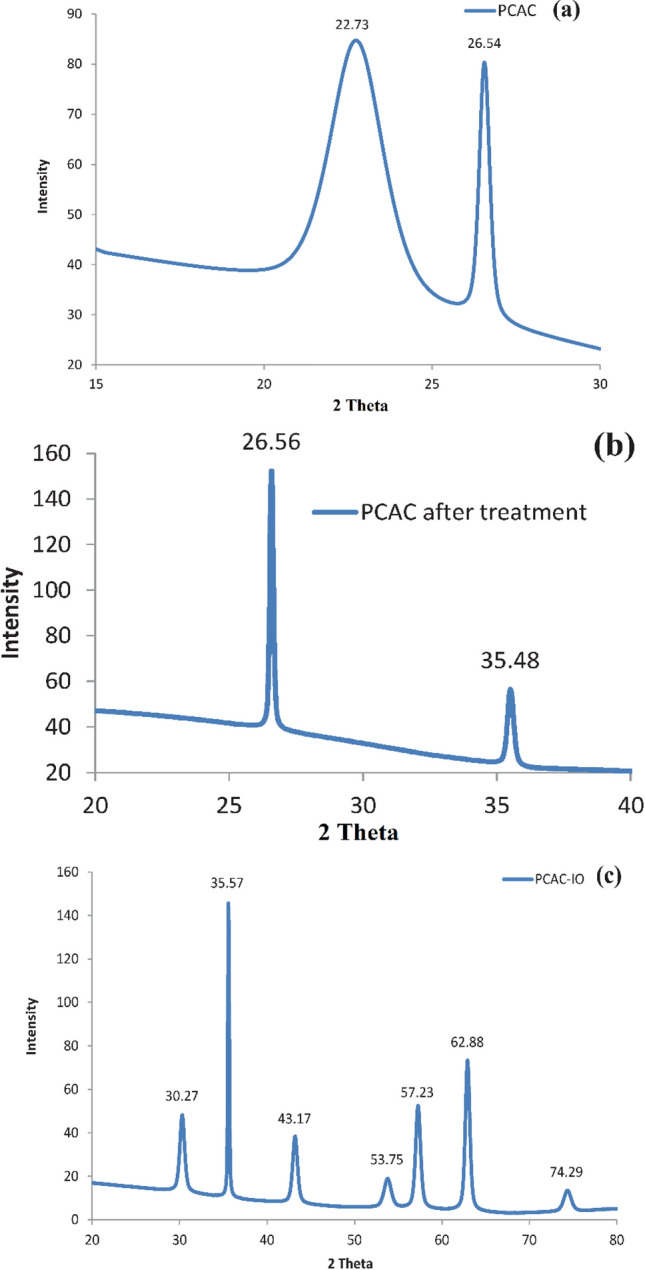
XRD graph of (a) PCAC (b) PCAC after oxidation and (c) PCAC/Iron oxide Nanocomposite prepared from (PCAC-IO).
where L is the crystalline size, λ is the wavelength of the X-ray, β is the full width of half maximum of a diffraction peak and θ is the angle of diffraction. K is Scherrer’s constant of the order of 0.8969. XRD results showed that the mean crystal size of PCAC-IO was 65.2 nm at 35,570 and 19.1 nm at a diffraction angle (2θ) of 62,880. The obtained 19.1 nm is in agreement with the results obtained from the TEM image of PCAC-IO.
Adsorption of Cr6+ ions and MV40 dye on PCAC-IO
Effect of pH
The surface charge of the adsorbent is a factor that is affected by the pH of the solutions70. The effect of different pH solutions showed that the best removal % was in an acidic pH environment. As seen in Fig. 7, the effect of solution pH was studied by increasing the pH of Cr6+ ions and MV40 dye solutions from 1 to 11.6. As a result, it was observed that the removal percentage of Cr6+ ions decreased from 33.02% to 24.93% as the pH increased. For this reason, the optimum solution was determined as pH = 1 by obtaining the maximum removal percentage at pH 1.0.
Figure 7.
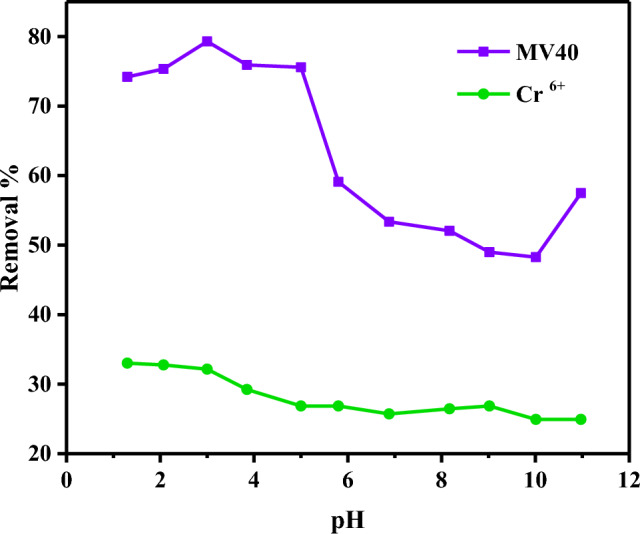
Effect of pH on the removal of Cr6+ ions and MV40 dye from aqueous media (Pollutant = 100 mg L−1, adsorbent = 1.0 g L–1, Time = 3 h).
The effect of dye solutions with different pH has been clarified that the best removal % is on acidic pH. It was observed that the MV40 dye removal increased slightly at first and then decreased continuously when the pH was increased from 1.04 to 10.48. Under optimum conditions, the best removal rate of 79.30% was obtained at pH 2.06. This result is due to the electrostatic attraction between the positively charged PCAC-IO surface and the negative charges of the MV40 dye molecules at acidic pH, but at higher pH, there is repulsion between the two opposite charges of the dye molecules and the opposite charges of the dye molecules adsorbent surface used. The same outcomes were found in El-Nemr et al.71.
Effect of PCAC-IO adsorbent dosage
Different PCAC-IO nano-composite dosages (1.0, 1.5, 2.0, 2.5, 3.0, 4.0, 5.0 g L−1) were used to examine the mass effect of the adsorbent at initial concentrations of 100 mg L−1 for Cr6+ ions and MV40 solutions, respectively. Contact time was 3 h, and the pH of the Cr6+ ions solutions was 1 after the addition of the adsorbent, whereas the pH of the MV40 dye solutions was 2.06 separately. In order to determine the ultimate concentrations of the MV40 dye and Cr6+ ions in the solutions, solution samples were taken at regular intervals. Figure 8 shows the adsorption of Cr6+ ions indicating that by increasing the mass of the adsorbent (PCAC-IO) from 0.1 to 0.5 g, the removal percentage increased from 36.38 to 96.88%. The elimination percentage of MV40 was also enhanced in the adsorption trial from 74.37 to 99.76% by increasing the PCAC-IO from 0.1 to 0.5 g. In order to remove Cr6+ ions and dyes from their solutions at room temperature, an equilibrium duration of 3 h, and solution pH of 1 and 2,06, respectively, 0.5 g of PCAC-IO nano-composite was determined to be the optimal dosage.
Figure 8.
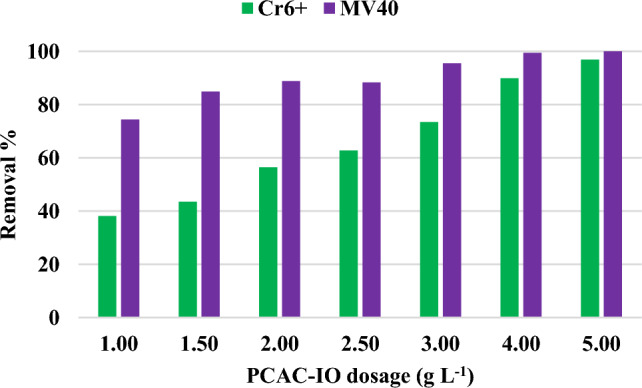
Effect of different PCAC-IO masses on the removal % of Cr6+ ions and MV40 dye. (Pollutant = 100 mg L−1, adsorbent dosage = 1.0–5.0 g L–1, Time = 3 h).
Effect of initial adsorbates concentrations on PCAC-IO Nanocomposite
In order to examine the effect of PCAC-IO concentration, batch adsorption experiments of four different Cr6+ ions solution concentrations (100, 150, 300, 400 mg/L) and five MV40 dye concentrations (100, 150, 200, 300, and 400) were performed. Optimum pH values determined as pH = 1 for Cr6+ ions adsorption and pH = 2.06 for MV40 dye adsorption were used during the experiments. As shown in Fig. 9a, when Cr6+ ions were adsorbed onto PCAC-IO nano-composite, the equilibrium adsorption capacity (qe) increased by increasing the initial concentration of Cr6+ ions solutions, resulting in an adsorption capacity (qe) of 149.62 mg g−1 at fixed adsorbent dosage (PCAC-IO) = 1 g L−1.
Figure 9.

Effect of various concentrations of Cr+6 ions (a) and MV40 dye (b) on adsorption capacity qe (mg g−1) for each PCAC-IO concentration (pH of Cr+6 ions solutions = 1 and pH of MV40 dye solutions = 2.06, (Pollutant = 100–400 mg L−1, adsorbent dosage = 1.0–5.0 g L–1, Time = 3 h).
As can be seen in Fig. 9b, the MV40 dye molecules were successfully adsorbed onto the PCAC-IO adsorbent. Similarly, the equilibrium adsorption capacity was increased by increasing the initial concentration of dye solutions, giving a maximum adsorption capacity of 208.08 mg g−1 at a fixed adsorbent dose (PCAC-IO) = 1 g L−1.
Effect of contact time using PCAC-IO
The effect of contact time was investigated at varying initial concentrations of Cr6+ ions or MV40 dye solutions, and evaluated at 5 g L−1 of PCAC-IO adsorbent concentration at pH of 1.0 and 2.06 of Cr6+ ions and dye solutions, respectively, at room temperature. According to Fig. 10a, the removal process of Cr6+ ions occurred very quickly. The removal of Cr6+ ions increased over time to reach 96.88% at equilibrium time = 180 min, which may be because there were enough unsaturated active sites on the PCAC-IO nano-composite. The removal of Cr6+ ions was 67.67% after only 10 min at 100 mg L−1 of initial concentration and 0.5 g of adsorbent dosage (PCAC-IO). When equilibrium was attained, the removal percentage of Cr6+ ions solutions dropped as the initial concentrations increased from 100 to 400 mg L−1. By raising the initial concentrations from 100 to 400 mg L−1 after 3 h, it reduced from 96.88 to 51.68%.
Figure 10.

Effect of contact time on adsorption of Cr6+ ions (a) and MV40 dye (b) on PCAC-IO nanocomposite at optimum dose = 5.0 g L−1 (pH of Cr+6 ions solutions = 1 and pH of MV40 dye solutions = 2.06, pollutant concentration 100–400 mg L–1).
MV40 dyes were quickly removed from solutions. After only 10 min of contact time, 99.43% of the dye had been removed at an initial concentration of 100 mg L−1 and a PCAC-IO concentration of 5 g L−1; this removal percentage increased over the following 45 min to reach 99.76%. This may be because the PCAC-IO nano-composite has enough unsaturated active sites. Additionally, as previously mentioned, the clearance percentage reduced as the initial dye solution concentrations increased from 100 to 400 mg L−1. This occurred when the dye solution reached the equilibrium time. By increasing the initial dye concentrations from 100 up to 400 mg after 3 h, it reduced from 99.76 to 82.86% as shown in Fig. 10b.
Adsorption ısotherm studies
As shown in Tables 2 and 3, two adsorption isotherms were examined for the adsorption of Cr6+ ions and MV40 dye on activated carbon-iron oxide nanocomposites made from Pterocladia Capillacea red algae (PC). Langmuir and Freundlich adsorption isotherm models were used. These tables display the adsorption isotherm data for the Freundlich and Langmuir models for the adsorption of MV40 dye molecules and Cr6+ ions from their respective aqueous environments. The characteristics of the interaction between the adsorbates and adsorbents are represented by the properties of adsorption and the parameters of each isotherm model72. The Langmuir model presumed that there would be a monolayer of adsorbed molecules on a uniform adsorbent surface, that there would be no interactions between the adsorbed molecules, and that the transmigration of adsorbed molecules on the adsorbent surface would not be permitted73. The expression for the Langmuir linear Eq. (4) is as follows:
| 4 |
Table 2.
Adsorption isotherm data for Cr6+ ions adsorption on PCAC-IO nano-composite at room temperature.
| Adsorption ısotherm model | Parameters | Activated carbon-ıron oxide composites (PCAC-IO) (g/L) | ||||||
|---|---|---|---|---|---|---|---|---|
| 1.0 | 1.5 | 2.0 | 2.5 | 3.0 | 4.0 | 5.0 | ||
| Langmuir | R2 | 0.990 | 0.983 | 0.995 | 0.999 | 0.997 | 0.986 | 0.993 |
| Qm (mg/g) | 151.52 | 94.34 | 91.74 | 64.94 | 63.69 | 47.85 | 43.48 | |
| Ka | 0.02 | 0.03 | 0.01 | 0.02 | 0.02 | 0.06 | 0.18 | |
| Freundlich | R2 | 0.629 | 0.614 | 0.859 | 0.890 | 0.924 | 0.960 | 0.878 |
| 1/n | 0.63 | 0.54 | 0.47 | 0.45 | 0.32 | 0.22 | 0.16 | |
| KF (mg1–1/nL1/ng−1) | 4.22 | 4.73 | 5.37 | 4.77 | 9.17 | 14.22 | 18.38 | |
Table 3.
Adsorption isotherm data for MV40 dye adsorption on PCAC-IO nano-composite at room temperature.
| Adsorption ısotherm model | Parameters | Activated carbon-ıron oxide composites (PCAC-IO) (g/L) | ||||||
|---|---|---|---|---|---|---|---|---|
| 1.0 | 1.5 | 2.0 | 2.5 | 3.0 | 4.0 | 5.0 | ||
| Langmuir | R2 | 0.991 | 0.992 | 0.973 | 0.967 | 0.973 | 0.980 | 0.991 |
| Qm (mg/g) | 303.03 | 222.22 | 172.41 | 142.86 | 91.743 | 84.034 | 67.57 | |
| Ka | 0.012 | 0.021 | 0.023 | 0.030 | 0.075 | 0.109 | 0.323 | |
| Freundlich | R2 | 0.990 | 0.973 | 0.982 | 0.993 | 0.974 | 0.998 | 0.990 |
| 1/n | 0.52 | 0.49 | 0.46 | 0.48 | 0.46 | 0.25 | 0.21 | |
| KF (mg1–1/nL1/ng−1) | 14.12 | 14.32 | 13.84 | 11.89 | 12.32 | 25.21 | 27.73 | |
where Ce is the concentration of adsorbate in solution (mg L−1) at equilibrium, qe is the adsorption capacity at equilibrium in mg g−1, k1 is constantly related to the free energy of adsorption (L mg−1), and Qm is the maximum adsorption capacity at monolayer coverage in mg g−1. An empirical linear equation of Freundlich Isotherm assumed that the adsorbent surface was heterogeneous; the equation was expressed as shown in Eq. (5):
| 5 |
where kf (mg1–1/n g−1 L1/n) and n are the Freundlich constants, they indicate the adsorption capacity and intensity of adsorption, respectively. The value of 1/n in Table 2 is lower than 1, which indicated to normal Langmuir model74. The isotherm parameters obtained from both models due to Cr6+ ions adsorption on PCAC-IO were listed in Table 2. Langmuir and Freundlich's linear equations were discussed previously in Eqs. (4) and (5), respectively. The values of 1/n in Tables 2, 3 are lower than 1, which indicated the normal Langmuir model74. The isotherm parameters shown in these tables indicated that the Cr6+ ions adsorption was fitted to the Langmuir model while MV40 dye adsorption was more fitted to the Freundlich model as shown in Fig. 11. Separation factor RL was calculated by the following Eq. (6):
| 6 |
Figure 11.

(a) Langmuir (b) Freundlich isotherms profiles for Cr6+ ions and (c) Langmuir (d) Freundlich isotherms profiles MV40 dye of initial concentration (100–400 mg L−1) on PCAC-IO doses (1.00–5.00 g L−1) at 25 ± 2 °C, contact time: 180 min).
The separation factor values determined the favorability of the adsorption process. They ranged from 0.01 to 0.45 in the case of Cr6+ ions adsorption and ranged from 0.01 to 0.46 where 0 < RL < 1, it represented the adsorption of Cr6+ ions and the dye molecules on PCAC-IO nano-composite surface, respectively, was favorable. Tables 2 and 3 also showed that the maximum adsorption capacity Qm from the Langmuir model was 303.03 mg g−1 in the case of MV40 dye adsorption at 1 g L−1 of PCAC-IO mass. Freundlich is more fitted due to the smallest relative error in calculations in the case of dye adsorption.
Adsorption kinetic studies
Adsorption kinetic data were investigated by two kinetic models such as Pseudo first and Pseudo Second order models. The rate expression of Lagergren indicated pseudo-first-order75 as shown in Eq. (7)
| 7 |
where qt (mg g−1) is the amount of adsorbed Cr6+ ions on PCAC-IO adsorbent in time t and k1, (min−1), is the first-order rate constant, and qe is the adsorption uptake at equilibrium. The straight line was obtained representing, log (qe − qt) as the y-axis and t as the x-axis. qe and k1 shown in Tables 4 and 5 were determined from the intercept and slope of the plot, respectively (Fig. 12a). The linear pseudo-second-order kinetic model was used75 as in Eq. (8):
| 8 |
Table 4.
Comparison of the first- and second-order adsorption rate constants and calculated and experimental qe values for various initial Cr6+ ions and PCAC-IO concentrations.
| Parameter | Pseudo-first-order | Pseudo-second-order | |||||||
|---|---|---|---|---|---|---|---|---|---|
| PCAC-IO (g L−1) | Cr6+ (mg L−1) | qe (exp.) | qe (calc.) | k1 × 103 | R2 | qe (calc.) | k2 × 103 | h | R2 |
| 1.0 | 100 | 36.87 | 41.30 | 47.210 | 1.000 | 36.36 | 9.55 | 12.63 | 0.993 |
| 150 | 89.33 | 18.40 | 2.990 | 1.000 | 78.74 | 5.02 | 31.15 | 1.000 | |
| 300 | 103.39 | 51.02 | 68.860 | 0.998 | 105.26 | 2.73 | 30.30 | 1.000 | |
| 400 | 149.62 | 43.32 | 9.670 | 0.891 | 158.73 | 2.06 | 51.81 | 0.994 | |
| 1.5 | 100 | 29.01 | 11.93 | 5.070 | 0.978 | 27.93 | 14.35 | 11.20 | 1.000 |
| 150 | 61.10 | 4.16 | 7.600 | 0.964 | 54.05 | 9.10 | 26.60 | 0.999 | |
| 300 | 66.45 | 28.62 | 8.290 | 0.983 | 70.42 | 4.73 | 23.47 | 1.000 | |
| 400 | 105.24 | 14.84 | 2.990 | 0.942 | 106.38 | 16.36 | 185.19 | 1.000 | |
| 2.0 | 100 | 28.23 | 6.55 | 4.610 | 0.906 | 23.53 | 41.43 | 22.94 | 1.000 |
| 150 | 44.57 | 10.92 | 17.730 | 0.992 | 46.51 | 2.42 | 5.24 | 1.000 | |
| 300 | 54.95 | 4.22 | 8.060 | 0.997 | 47.62 | 18.15 | 41.15 | 1.000 | |
| 400 | 78.79 | 4.71 | 7.140 | 0.971 | 78.74 | 6.92 | 42.92 | 0.999 | |
| 2.5 | 100 | 25.10 | 7.71 | 23.490 | 0.908 | 25.97 | 5.22 | 3.52 | 0.996 |
| 150 | 39.50 | 2.71 | 5.760 | 0.958 | 39.22 | 12.78 | 19.65 | 0.999 | |
| 300 | 43.64 | 5.79 | 2.760 | 0.995 | 45.25 | 2.45 | 5.02 | 0.997 | |
| 400 | 66.01 | 7.24 | 2.760 | 1.000 | 169.49 | 0.73 | 20.83 | 0.994 | |
| 3.0 | 100 | 24.48 | 10.85 | 19.110 | 0.950 | 25.51 | 3.66 | 2.38 | 0.997 |
| 150 | 34.29 | 3.45 | 15.200 | 0.996 | 34.36 | 13.79 | 16.29 | 1.000 | |
| 300 | 42.43 | 13.15 | 10.590 | 0.958 | 45.05 | 6.24 | 12.66 | 0.995 | |
| 400 | 55.01 | 4.78 | 13.590 | 0.961 | 55.25 | 7.22 | 22.03 | 1.000 | |
| 4.0 | 100 | 22.48 | 8.41 | 14.970 | 0.981 | 23.26 | 4.07 | 2.20 | 0.997 |
| 150 | 30.98 | 6.76 | 10.590 | 0.981 | 31.65 | 4.18 | 4.18 | 0.995 | |
| 300 | 39.12 | 32.22 | 18.650 | 0.964 | 39.68 | 2.66 | 4.19 | 0.994 | |
| 400 | 46.83 | 7.21 | 12.670 | 0.979 | 47.17 | 5.67 | 12.61 | 0.999 | |
| 5.0 | 100 | 19.38 | 6.21 | 17.960 | 0.992 | 19.88 | 7.23 | 2.86 | 0.999 |
| 150 | 28.85 | 9.38 | 12.210 | 0.944 | 29.33 | 3.58 | 3.08 | 0.995 | |
| 300 | 37.96 | 12.63 | 13.130 | 0.971 | 38.46 | 2.98 | 4.42 | 0.996 | |
| 400 | 43.70 | 10.34 | 28.100 | 0.983 | 44.25 | 5.69 | 11.15 | 0.999 | |
Table 5.
Comparison of the first- and second-order adsorption rate constants and calculated and experimental qe (mg g–1) values for various initial MV40 dye solutions and PCAC-IO concentrations.
| Parameter | Pseudo-first-order | Pseudo-second-order | |||||||
|---|---|---|---|---|---|---|---|---|---|
| PCAC-IO (g L−1) | MV40 (mg L−1) | qe (exp.) | qe (calc.) | k1 × 103 | R2 | qe (calc.) | k2 × 103 | h | R2 |
| 1.0 | 100 | 74.37 | 23.47 | 31.0 | 0.916 | 74.63 | 8.72 | 48.54 | 1.000 |
| 150 | 101.33 | 6.94 | 42.0 | 0.987 | 166.67 | 0.35 | 9.65 | 0.991 | |
| 200 | 132.42 | 19.43 | 59.0 | 0.927 | 133.33 | 3.41 | 60.61 | 1.000 | |
| 300 | 192.64 | 27.39 | 17.0 | 0.967 | 196.08 | 1.75 | 67.11 | 1.000 | |
| 400 | 208.08 | 81.51 | 14.0 | 0.988 | 212.77 | 0.42 | 19.00 | 0.997 | |
| 1.5 | 100 | 56.53 | 2.90 | 12.0 | 0.972 | 56.50 | 15.21 | 48.54 | 1.000 |
| 150 | 72.84 | 16.46 | 13.0 | 0.931 | 72.99 | 17.88 | 95.24 | 1.000 | |
| 200 | 94.10 | 5.26 | 45.0 | 0.954 | 95.24 | 7.99 | 72.46 | 1.000 | |
| 300 | 139.04 | 26.77 | 62.0 | 0.816 | 140.85 | 2.34 | 46.51 | 1.000 | |
| 400 | 169.87 | 136.30 | 49.0 | 0.914 | 178.57 | 0.63 | 20.20 | 0.997 | |
| 2.0 | 100 | 44.40 | 3.70 | 13.0 | 0.957 | 44.44 | 14.63 | 28.89 | 1.000 |
| 150 | 60.93 | 7.50 | 44.0 | 0.997 | 61.35 | 9.88 | 37.17 | 1.000 | |
| 200 | 75.87 | 17.37 | 46.0 | 0.891 | 76.34 | 8.50 | 49.50 | 1.000 | |
| 300 | 108.85 | 9.45 | 35.0 | 0.976 | 109.89 | 9.30 | 112.36 | 1.000 | |
| 400 | 134.52 | 120.78 | 94.0 | 0.908 | 138.89 | 2.61 | 50.25 | 1.000 | |
| 2.5 | 100 | 35.08 | 5.23 | 39.0 | 0.975 | 35.97 | 17.56 | 22.73 | 1.000 |
| 150 | 51.95 | 5.61 | 33.0 | 0.952 | 49.75 | 27.30 | 67.57 | 0.998 | |
| 200 | 69.04 | 7.16 | 16.0 | 0.997 | 67.57 | 15.32 | 69.93 | 0.998 | |
| 300 | 89.38 | 6.33 | 27.0 | 0.965 | 90.09 | 11.85 | 96.15 | 1.000 | |
| 400 | 116.12 | 76.03 | 67.0 | 0.926 | 117.65 | 2.74 | 37.88 | 0.999 | |
| 3.0 | 100 | 31.85 | 2.82 | 95.0 | 1.000 | 32.15 | 66.70 | 68.97 | 1.000 |
| 150 | 44.79 | 5.59 | 36.0 | 0.972 | 45.05 | 17.23 | 34.97 | 1.000 | |
| 200 | 56.97 | 10.38 | 42.0 | 0.979 | 57.14 | 10.49 | 34.25 | 1.000 | |
| 300 | 78.33 | 5.31 | 15.0 | 0.929 | 78.74 | 7.79 | 48.31 | 1.000 | |
| 400 | 103.69 | 18.21 | 16.0 | 0.995 | 104.71 | 2.33 | 25.25 | 0.999 | |
| 4.0 | 100 | 24.78 | 1.23 | 96.0 | 0.965 | 24.81 | 213.70 | 131.58 | 1.000 |
| 150 | 36.27 | 4.76 | 39.0 | 0.969 | 36.63 | 11.45 | 15.36 | 0.998 | |
| 200 | 46.73 | 10.97 | 42.0 | 0.961 | 46.95 | 9.53 | 21.01 | 1.000 | |
| 300 | 63.76 | 6.24 | 19.0 | 0.978 | 64.10 | 8.39 | 34.48 | 1.000 | |
| 400 | 78.46 | 17.06 | 41.0 | 0.902 | 78.74 | 7.27 | 45.05 | 1.000 | |
| 5.0 | 100 | 19.95 | 8.81 | 12.0 | 0.657 | 19.96 | 738.24 | 294.12 | 1.000 |
| 150 | 29.45 | 1.97 | 69.0 | 0.979 | 29.59 | 83.39 | 72.99 | 1.000 | |
| 200 | 39.26 | 3.51 | 17.0 | 0.969 | 39.53 | 14.29 | 22.32 | 1.000 | |
| 300 | 54.00 | 4.91 | 15.0 | 0.965 | 54.35 | 9.59 | 28.33 | 1.000 | |
| 400 | 66.29 | 4.84 | 16.0 | 0.980 | 66.67 | 10.14 | 45.05 | 1.000 | |
Figure 12.

The plot of (a) PFO (b) PSO (c) IPDM of adsorption of Cr6+ ions and (d) PFO (e) PSO (f) IPDM of adsorption of MV40 dye by PCAC-IO adsorbent (Initial concentration = (100–400 mg L−1), Adsorbent dose = (5.0 g L−1), Temperature = 25 ± 2 °C).
where k2 (g mg−1) (min−1) is the pseudo-second-order rate constant. From the slope of the straight line t/qt vs. t plot, as shown in Fig. 12b–e, we can obtain qe while k2 obtained from its intercept. The kinetic parameter values due to Cr6+ ions and MV40 dye adsorption on PCAC-IO adsorbent are separately in Tables 4, 5, 6. It showed that the adsorption process follows the pseudo-second-order (PSO) model according to correlation coefficient R2 from 0.993 to 1.000 in the case of Cr6+ ions adsorption and R2 ranged from 0.997 to 1.000 for MV40 dye adsorption and closeness of the calculated equilibrium adsorption capacity (qe)calc to those obtained from the experimental values (qe)exp. R2 values for the pseudo-first-order (PFO) model are not satisfactory so, the PSO kinetic model is the best model that explained the experimental data from Cr6+ ions and dye adsorption on PCAC-IO. These results were interpreted that the adsorption process was chemisorption76. Chemisorption is sharing or exchanging electrons between the adsorbate and the active sites on the adsorbent76. To interpret the diffusion mechanism, the experimental results were analyzed and fitted to the intraparticle diffusion model which is expressed by the following Eq. (9):
| 9 |
where Kdiff is the intraparticle rate constant (mg g−1 min0.5) and C is an intercept (mg g−1) which indicates the boundary layer effect. The intraparticle diffusion model (IPDM) was also tested on the adsorption of the MV40 dye and Cr6+ ions on PCAC-IO nano-composite separately, the qt vs t0.5 plot was drawn as shown in Fig. 12c and f, a line didn’t pass through the origin and the intercept C increased by increasing the initial concentrations of adsorbates solutions as shown Fig. 12c and f. It was seen that the intraparticle diffusion model was not the only rate-determining step as discussed before. The above results showed that the interaction mechanism presented between adsorbent and pollutant was suspect to be due to electrostatic attraction between the PCAC-IO nano-composite adsorbent and MV40 dye and Cr6+ ions77–79.
Table 6.
IPDM results of adsorption of Cr6+ ions and MV40 dye by PCAC-IO adsorbent (Initial concentration = (100–400 mg L−1), adsorbent doses = (1.0–5.0 g L−1), Temp. = (25 °C)).
| Parameter | Cr6+ ions | MV40 dye | |||||
|---|---|---|---|---|---|---|---|
| PCAC-IO (g L−1) | Pollutant (mg L−1) | Кdif | C | R2 | Кdif | C | R2 |
| 1.00 | 100 | − 0.117 | 36.70 | 0.049 | 0.132 | 69.47 | 0.019 |
| 150 | − 1.344 | 92.53 | 0.592 | 0.627 | 91.67 | 0.116 | |
| 200 | – | – | – | 1.582 | 112.52 | 0.647 | |
| 300 | 0.016 | 80.85 | 0.000 | 2.251 | 162.96 | 0.871 | |
| 400 | 0.986 | 132.83 | 0.062 | 6.884 | 116.37 | 0.975 | |
| 1.50 | 100 | 0.334 | 23.88 | 0.921 | 0.239 | 53.17 | 0.963 |
| 150 | − 0.700 | 62.32 | 0.467 | 0.142 | 68.52 | 0.023 | |
| 200 | – | – | – | 0.156 | 89.46 | 0.057 | |
| 300 | − 0.218 | 59.89 | 0.021 | 2.467 | 113.42 | 0.870 | |
| 400 | − 1.917 | 117.01 | 0.488 | 5.286 | 104.73 | 0.804 | |
| 2.00 | 100 | 0.441 | 20.27 | 0.468 | 0.342 | 40.08 | 0.885 |
| 150 | − 0.192 | 45.39 | 0.159 | 0.364 | 53.36 | 0.116 | |
| 200 | – | – | – | 0.234 | 70.84 | 0.223 | |
| 300 | 0.548 | 41.68 | 0.259 | 0.675 | 101.00 | 0.738 | |
| 400 | − 0.063 | 77.14 | 0.014 | 4.735 | 96.25 | 0.934 | |
| 2.50 | 100 | 0.627 | 17.03 | 0.879 | 0.110 | 32.93 | 0.116 |
| 150 | 0.228 | 35.82 | 0.840 | 0.659 | 44.93 | 0.446 | |
| 200 | – | – | – | 0.388 | 63.16 | 0.265 | |
| 300 | 1.526 | 25.22 | 0.589 | 0.424 | 83.95 | 0.741 | |
| 400 | − 0.199 | 64.50 | 0.133 | 2.623 | 91.28 | 0.941 | |
| 100 | 0.778 | 14.41 | 0.994 | 0.037 | 31.20 | 0.162 | |
| 150 | 0.263 | 30.71 | 0.931 | 0.412 | 40.12 | 0.412 | |
| 3.00 | 200 | – | – | – | 0.401 | 51.76 | 0.960 |
| 300 | 0.254 | 36.38 | 0.152 | 0.467 | 71.86 | 0.853 | |
| 400 | 0.418 | 49.20 | 0.854 | 1.576 | 83.51 | 0.952 | |
| 4.00 | 100 | 0.724 | 13.02 | 0.970 | 0.022 | 24.43 | 0.352 |
| 150 | 0.600 | 22.62 | 0.907 | 0.207 | 33.68 | 0.849 | |
| 200 | – | – | – | 0.338 | 41.82 | 0.912 | |
| 300 | 1.103 | 23.23 | 0.930 | 0.495 | 57.44 | 0.919 | |
| 400 | 0.599 | 38.679 | 0.996 | 0.587 | 71.06 | 0.971 | |
| 5.00 | 100 | 0.606 | 35.399 | 0.744 | 0.008 | 19.85 | 0.038 |
| 150 | 0.981 | 24.466 | 0.976 | 0.052 | 28.78 | 0.349 | |
| 200 | – | – | – | 0.283 | 35.52 | 0.894 | |
| 300 | 0.731 | 18.583 | 0.977 | 0.382 | 48.85 | 0.955 | |
| 400 | 0.508 | 13.004 | 0.923 | 0.391 | 61.047 | 0.918 | |
Comparison of results with reported literature
The efficacy of the elimination of Cr6+ ions and MV40 dye using various adsorbents was compared with the PCAC-IO adsorbent in the literature review. Table 7 shows a comparison of the maximum adsorption capacities (mg g−1) of the adsorbents used and maximum removal (%) of pollutants in this study with other results reported in the literature. Table 7 makes it evident that the PCAC-IO adsorbent removed the Cr6+ ions and MV40 well.
Table 7.
A comparison of the highest pollutant removal capabilities of some adsorbents.
| Name of adsorbent | Pollutant | Qm (mg·g−1) | References |
|---|---|---|---|
| Wheat straw and E. adenophorum | Cr6+ | 88.57 | 80 |
| Magnetite nanoparticles | Cr6+ | 34.9 | 81 |
| Rice husk-derived magnetic sorbent (RHC-Mag-2) | Cr6+ | 157.7 | 82 |
| Active carbon derived from Lantana Camara Plant | Cr6+ | 26.25 | 83 |
| Polyaniline hexadecyltrimethylammonium bromide (PANI/HTAB) | Mordant black 11 | 232.00 | 84 |
| CMC-polyaniline hydrogel | Mordant blue 9 | 12.20 | 85 |
| PCAC-IO nano-composite | Cr6+ | 151.52 | This study |
| PCAC-IO nano-composite | Mordant violet 40 | 303.03 | This study |
Conclusion
Iron oxide nano-composites can be prepared from pterocladia capillacea red algae. The magnetization saturation (Ms) increased by increasing the iron oxide: carbon ratio in the prepared nano-composites. The Cr6+ ions removal was 96.88% at solution pH was 1.0, the adsorbent dosage was 0.5. and 100 mg/L of initial adsorbate concentrations by PCAC-IO adsorbent. The removal % of MV40 was 99.76% obtained by using PCAC-IO adsorbent at pH of dye solutions = 2.0 and adsorbent dosage 0.5 of PCAC-IO at 100 mg/L of initial adsorbate concentrations. The removal percentage of Cr6+ ions and MV40 dye on both adsorbents was higher in acidic solutions than in basic solutions. PCAC nano adsorbent has high magnetization saturation of 17.773 emu/g. Qmax of Cr6+ ions on PCAC-IO was 151.52 mg g−1 at 1 g L−1, while in the case of dye, was 303.03 mg g−1 at 1 g L−1 adsorbent concentration. Freundlich model was the most fitted on MV40 adsorption using PCAC-IO. Langmuir model was more fitted on Cr6+ ions adsorption on PCAC-IO adsorbent. PCAC-IO nano-composites can be separated from aqueous media after treatment and the adsorption process by a magnet. The prepared Iron oxide nano-composite PCAC-IO can be used for the adsorption of Cr6+ ions and mordant violet 40 dye from aqueous media.
Acknowledgements
The authors acknowledge the lat Professor Dr. Hesham Zaki Ibrahim, Institute of Graduate Studies and Research, Alexandria University, who passed away prior to writing this manuscript for his supervision and valuable discussion with S.M.I.M. during the experimental work and writing of Ms. S.M.I.M.’s master’s thesis.
Author contributions
S.M.I.M conceived the experiments, conducted the experiments and wrote the main manuscript text; E.K.G. and M.Y. revised and edited the main manuscript; A.E.N reviewed, revised and enhanced the discussion in the paper and submitted to the journal. All authors reviewed the manuscript.
Funding
Open access funding provided by The Science, Technology & Innovation Funding Authority (STDF) in cooperation with The Egyptian Knowledge Bank (EKB). This work was partially supported by The Science, Technology & Innovation Funding Authority (STDF) of Egypt, project number SCSE-31235.
Data availability
The data presented in this study are available on the request from the corresponding author.
Competing interests
The authors declare no competing interests.
Footnotes
Publisher's note
Springer Nature remains neutral with regard to jurisdictional claims in published maps and institutional affiliations.
References
- 1.Roy H, Rahman TU, Khan MAJR, Al-Mamun MR, Islam SZ, Khaleque MA, Awual MR. Toxic dye removal, remediation, and mechanism with doped SnO2-based nanocomposite photocatalysts: A critical review. J. Water Process Eng. 2023;54:104069. doi: 10.1016/j.jwpe.2023.104069. [DOI] [Google Scholar]
- 2.Sriram G, Bendre A, Mariappan E, Altalhi T, Kigga M, Ching YC, Kurkuri M. Recent trends in the application of metal-organic frameworks (MOFs) for the removal of toxic dyes and their removal mechanism-a review. Sustain. Mater. Technol. 2022;31:e00378. [Google Scholar]
- 3.Bhattacharjee J, Mishra S, Das AP. Recent advances in sensor-based detection of toxic dyes for bioremediation application: A review. Appl. Biochem. Biotechnol. 2022;194(10):4745–4764. doi: 10.1007/s12010-021-03767-7. [DOI] [PubMed] [Google Scholar]
- 4.Sridhar A, Ponnuchamy M, Kapoor A, Prabhakar S. Valorization of food waste as adsorbents for toxic dye removal from contaminated waters: A review. J. Hazard. Mater. 2022;424:127432. doi: 10.1016/j.jhazmat.2021.127432. [DOI] [PubMed] [Google Scholar]
- 5.Hassaan MA, Yılmaz M, Helal M, El-Nemr MA, Ragab S, El Nemr A. Isotherm and kinetic investigations of sawdust-based biochar modified by ammonia to remove methylene blue from water. Sci. Rep. 2023;13(1):12724. doi: 10.1038/s41598-023-39971-0. [DOI] [PMC free article] [PubMed] [Google Scholar]
- 6.Caglar B, Guner EK, Keles K, Özdokur KV, Cubuk O, Coldur F, Tabak A. Fe3O4 nanoparticles decorated smectite nanocomposite: Characterization, photocatalytic and electrocatalytic activities. Solid State Sci. 2018;83:122–136. doi: 10.1016/j.solidstatesciences.2018.07.013. [DOI] [Google Scholar]
- 7.Vishani DB, Shrivastav A, et al. Enzymatic decolorization and degradation of azo dyes. In: Shah MP, et al., editors. Development in Wastewater Treatment Research and Processes. Elsevier; 2022. pp. 419–432. [Google Scholar]
- 8.Gürses A, Açıkyıldız M, Güneş K, Gürses MS, Gürses A, Açıkyıldız M, Gürses MS. Classification of dye and pigments. Dyes Pigments. 2016 doi: 10.1007/978-3-319-33892-7_3. [DOI] [Google Scholar]
- 9.de Campos Ventura-Camargo B, Marin-Morales MA. Azo dyes: Characterization and toxicity-A review. Textiles Light Ind. Sci. Technol. 2013;2(2):85–103. [Google Scholar]
- 10.Dye, World Dye Variety, 2019. <http://www.worlddyevariety.com/mordant-dyes/mordantviolet- 40.html> acessed (2019.01.2).
- 11.Hassaan MA, El Nemr A, Hassaan A. Health and environmental impacts of dyes: Mini review. Am. J. Environ. Sci. Eng. 2017;1(3):64–67. [Google Scholar]
- 12.Dhahri R, Yılmaz M, Mechi L, Alsukaibi AKD, Alimi F, Ben Salem R, Moussaoui Y. Optimization of the preparation of activated carbon from prickly pear seed cake for the removal of lead and cadmium ions from aqueous solution. Sustainability. 2022;14(6):3245. doi: 10.3390/su14063245. [DOI] [Google Scholar]
- 13.El-Wakil AM, Waly SM, Abou El-Maaty WM, Waly MM, Yılmaz M, Awad FS. Triazine-based functionalized activated carbon prepared from water hyacinth for the removal of Hg2+, Pb2+, and Cd2+ ions from water. ACS Omega. 2022;7(7):6058–6069. doi: 10.1021/acsomega.1c06441. [DOI] [PMC free article] [PubMed] [Google Scholar]
- 14.Munshi AM, Alamrani NA, Alessa H, Aljohani M, Ibarhiam SF, Saad FA, El-Metwaly NM. Thiophene functionalized cellulose immobilized with metal organic framework for removal of heavy metals. Cellulose. 2023;30:7235. doi: 10.1007/s10570-023-05331-4. [DOI] [Google Scholar]
- 15.Shadreck M, Mugadza T. Chromium, an essential nutrient and pollutant: A review. Afr. J. Pure Appl. Chem. 2013;7(9):310–317. [Google Scholar]
- 16.Soni S, Jha AB, Dubey RS, Sharma P. Alleviation of chromium stress in plants using metal and metal oxide nanoparticles. Environ. Sci. Pollut. Res. 2023;30:83180–83197. doi: 10.1007/s11356-023-28161-0. [DOI] [PubMed] [Google Scholar]
- 17.Shahid M, Shamshad S, Rafiq M, Khalid S, Bibi I, Niazi NK, Rashid MI. Chromium speciation, bioavailability, uptake, toxicity and detoxification in soil-plant system: A review. Chemosphere. 2017;178:513–533. doi: 10.1016/j.chemosphere.2017.03.074. [DOI] [PubMed] [Google Scholar]
- 18.Jiang Y, Yang F, Dai M, Ali I, Shen X, Hou X, Naz I. Application of microbial immobilization technology for remediation of Cr (VI) contamination: A review. Chemosphere. 2022;286:131721. doi: 10.1016/j.chemosphere.2021.131721. [DOI] [PubMed] [Google Scholar]
- 19.Pushkar B, Sevak P, Parab S, Nilkanth N. Chromium pollution and its bioremediation mechanisms in bacteria: A review. J. Environ. Manag. 2021;287:112279. doi: 10.1016/j.jenvman.2021.112279. [DOI] [PubMed] [Google Scholar]
- 20.Tchounwou PB, Yedjou CG, Patlolla AK, Sutton DJ. Heavy metal toxicity and the environment. Molecular, clinical and environmental toxicology. Exp. Suppl. 2012;101:133–64. doi: 10.1007/978-3-7643-8340-4_6. [DOI] [PMC free article] [PubMed] [Google Scholar]
- 21.Wang Y, Su H, Gu Y, Song X, Zhao J. Carcinogenicity of chromium and chemoprevention: A brief update. OncoTargets Ther. 2017;10:4065–4079. doi: 10.2147/OTT.S139262. [DOI] [PMC free article] [PubMed] [Google Scholar]
- 22.Huadong X, Li S, Lingfang F, Fan W, Junfei C, Yao Q, Xiaowen D, Zhaoqiang J, Yongxin L, Hailing X, Jianlin L. Hexavalent chromium [Cr(VI)]-induced ribosomal DNA copy number variation and DNA damage responses and their associations with nucleolar protein HRAS in humans and cells. Environ. Pollut. 2023;331(2):121816. doi: 10.1016/j.envpol.2023.121816. [DOI] [PubMed] [Google Scholar]
- 23.El Nemr A, Aboughaly RM, El Sikaily A, Ragab S, Masoud MS, Ramadan MS. Microporous nano-activated carbon type I derived from orange peel and its application for Cr (VI) removal from aquatic environment. Biomass Conv. Biorefin. 2020;12:5125. doi: 10.1007/s13399-020-00995-5. [DOI] [Google Scholar]
- 24.Caglar B, Guner EK, Ersoy S, Caglar S, Özdemir AO, Özdokur KV, Çırak Ç. Bi2S3 nanorods decorated on bentonite nanocomposite for enhanced visible-light-driven photocatalytic performance towards degradation of organic dyes. J. Alloys Compd. 2021;885:160964. doi: 10.1016/j.jallcom.2021.160964. [DOI] [Google Scholar]
- 25.Yılmaz M, Eldeeb TM, Hassaan MA, El-Nemr MA, Ragab S, El Nemr A. The use of mandarin-biochar-O3-TETA (MBT) produced from mandarin peels as a natural adsorbent for the removal of acid red 35 (AR35) dye from water. Environ. Proces. 2022;9(3):44. doi: 10.1007/s40710-022-00592-w. [DOI] [Google Scholar]
- 26.Eleryan A, Aigbe UO, Ukhurebor KE, Onyancha RB, Hassaan MA, Elkatory MR, Ragab S, Osibote OA, Kusuma HS, El Nemr A. Direct blue 106 dye adsorption using green synthesized zinc oxide nanoparticles. Environ. Sci. Pollut. Res. 2023;30:69666–69682. doi: 10.1007/s11356-023-26954-x. [DOI] [PMC free article] [PubMed] [Google Scholar]
- 27.Hassaan MA, Yılmaz M, Helal M, El-Nemr MA, Ragab S, El Nemr A. Improved methylene blue adsorption from an aqueous medium by ozone-triethylenetetramine modification of sawdust-based biochar. Sci. Rep. 2023;13(1):12431. doi: 10.1038/s41598-023-39495-7. [DOI] [PMC free article] [PubMed] [Google Scholar]
- 28.El-Nemr MA, Hassaan MA, Ashour I. Fabrication of N-doping activated carbons from fish waste and sawdust for Acid Yellow 36 dye removal from an aquatic environment. Sci. Rep. 2023;13(1):5892. doi: 10.1038/s41598-023-33075-5. [DOI] [PMC free article] [PubMed] [Google Scholar]
- 29.Fuertes AB, Arbestain MC, Sevilla M, Maciá-Agulló JA, Fiol S, López R, Macìas F. Chemical and structural properties of carbonaceous products obtained by pyrolysis and hydrothermal carbonisation of corn stover. Soil Res. 2010;48(7):618–626. doi: 10.1071/SR10010. [DOI] [Google Scholar]
- 30.Kızıltaş H. Production of highly effective adsorbent from tea waste, and its adsorption behaviors and characteristics for the removal of Rhodamine B. Int. J. Environ. Anal. Chem. 2022 doi: 10.1080/03067319.2022.2047181. [DOI] [Google Scholar]
- 31.Nguyen DTC, Le HT, Nguyen TT, Nguyen TTT, Liew RK, Bach LG, Van Tran T. Engineering conversion of Asteraceae plants into biochars for exploring potential applications: A review. Sci. Total Environ. 2021;797:149195. doi: 10.1016/j.scitotenv.2021.149195. [DOI] [PubMed] [Google Scholar]
- 32.MiarAlipour S, Friedmann D, Scott J, Amal R. TiO2/porous adsorbents: Recent advances and novel applications. J. Hazard. Mater. 2018;341:404–423. doi: 10.1016/j.jhazmat.2017.07.070. [DOI] [PubMed] [Google Scholar]
- 33.Ren J, Wang C, Zhang H, Liu X, Yang T, Zheng W, Ma Y. Magnetic core@ Shell Fe3O4@ polypyrrole@ sodium dodecyl sulfate composite for enhanced selective removal of dyestuffs and heavy metal ions from complex wastewater. Langmuir. 2023;39(29):10098–10111. doi: 10.1021/acs.langmuir.3c01029. [DOI] [PubMed] [Google Scholar]
- 34.Sharifi MJ, Nouralishahi A, Hallajisani A. Fe3O4-chitosan nanocomposite as a magnetic biosorbent for removal of nickel and cobalt heavy metals from polluted water. Int. J. Biol. Macromol. 2023;248:125984. doi: 10.1016/j.ijbiomac.2023.125984. [DOI] [PubMed] [Google Scholar]
- 35.Weidner E, Karbassiyazdi E, Altaee A, Jesionowski T, Ciesielczyk F. Hybrid metal oxide/biochar materials for wastewater treatment technology: A review. ACS omega. 2022;7(31):27062–27078. doi: 10.1021/acsomega.2c02909. [DOI] [PMC free article] [PubMed] [Google Scholar]
- 36.Siddiqui SI, Chaudhry SA. Iron oxide and its modified forms as an adsorbent for arsenic removal: A comprehensive recent advancement. Process Saf. Environ. Prot. 2017;111:592–626. doi: 10.1016/j.psep.2017.08.009. [DOI] [Google Scholar]
- 37.Niraula G, Coaquira JA, Zoppellaro G, Villar BM, Garcia F, Bakuzis AF, Sharma SK. Engineering shape anisotropy of Fe3O4-γ-Fe2O3 hollow nanoparticles for magnetic hyperthermia. ACS Appl. Nano Mater. 2021;4(3):3148–3158. doi: 10.1021/acsanm.1c00311. [DOI] [Google Scholar]
- 38.Apostolov AT, Apostolova IN, Wesselinowa JM. MO Fe2O3 nanoparticles for self-controlled magnetic hyperthermia. J. Appl. Phys. 2011;109(8):083939. doi: 10.1063/1.3580476. [DOI] [Google Scholar]
- 39.Zhao Z, Li M, Zeng J, Huo L, Liu K, Wei R, Gao J. Recent advances in engineering iron oxide nanoparticles for effective magnetic resonance imaging. Bioact. Mater. 2022;12:214–245. doi: 10.1016/j.bioactmat.2021.10.014. [DOI] [PMC free article] [PubMed] [Google Scholar]
- 40.Keles Guner E. Structural, optical, magnetic and photocatalytic properties of Zn doped CoFe2O4 decorated bentonite nanocomposites. ChemistrySelect. 2023;8(10):e202204568. doi: 10.1002/slct.202204568. [DOI] [Google Scholar]
- 41.Ahribesh AA, Lazarević S, Janković-Častvan I, Jokić B, Spasojević V, Radetić T, Petrović R. Influence of the synthesis parameters on the properties of the sepiolite-based magnetic adsorbents. Powder Technol. 2017;305:260–269. doi: 10.1016/j.powtec.2016.09.086. [DOI] [Google Scholar]
- 42.Treviño-Cordero H, Juárez-Aguilar LG, Mendoza-Castillo DI, Hernández-Montoya V, Bonilla-Petriciolet A, Montes-Morán MA. Synthesis and adsorption properties of activated carbons from biomass of Prunus domestica and Jacaranda mimosifolia for the removal of heavy metals and dyes from water. Ind. Crops Prod. 2013;42:315–323. doi: 10.1016/j.indcrop.2012.05.029. [DOI] [Google Scholar]
- 43.Kefeni KK, Mamba BB, Msagati TA. Application of spinel ferrite nanoparticles in water and wastewater treatment: A review. Sep. Purif. Technol. 2017;188:399–422. doi: 10.1016/j.seppur.2017.07.015. [DOI] [Google Scholar]
- 44.Grima-Olmedo C, Valle-Falcones LM, Galindo DG-L, Esparver RR-P. Production of AC from bamboo, orange, and paulownia waste—Influence of activation gas and biomass maturation. Materials. 2023;16(9):3498. doi: 10.3390/ma16093498. [DOI] [PMC free article] [PubMed] [Google Scholar]
- 45.Alameri AA, Alfilh RH, Awad SA, Zaman GS, Al-Musawi TJ, Joybari MM, McKay G. Ciprofloxacin adsorption using magnetic and ZnO nanoparticles supported activated carbon derived from Azolla filiculoides biomass. Biomass Conv. Biorefin. 2022 doi: 10.1007/s13399-022-03372-6. [DOI] [Google Scholar]
- 46.Nagarajan L, Kumaraguru K, Saravanan P, Rajeshkannan R, Rajasimman M. Facile synthesis and characterization of microporous-structured activated carbon from agro waste materials and its application for CO2 capture. Environ. Technol. 2022;43(25):3983–3992. doi: 10.1080/09593330.2021.1938243. [DOI] [PubMed] [Google Scholar]
- 47.Kumaraguru K, Saravanan P, Rajesh Kannan R, Saravanan V. A systematic analysis of hexavalent chromium adsorption and elimination from aqueous environment using brown marine algae (Turbinaria ornata) Biomass Conv. Biorefin. 2021 doi: 10.1007/s13399-021-01795-1. [DOI] [Google Scholar]
- 48.Nivetha N, Srivarshine B, Sowmya B, Rajendiran M, Saravanan P, Rajeshkannan R, Rajasimman M, Pham THT, Shanmugam VK, Dragoi E-N. A comprehensive review on bio-stimulation and bio-enhancement towards remediation of heavy metals degeneration. Chemosphere. 2023;312:137099. doi: 10.1016/j.chemosphere.2022.137099. [DOI] [PubMed] [Google Scholar]
- 49.Nagarajan L, Saravanan P, Kumaraguru K, Joo S-W, Vasseghian Y, Rajeshkannan R, Rajasimman M. Synthesis of magnesium nanocomposites decked with multilayer graphene (MG) and its application for the adsorptive removal of pollutant. Chemosphere. 2022;298:134121. doi: 10.1016/j.chemosphere.2022.134121. [DOI] [PubMed] [Google Scholar]
- 50.Ganjoo R, Sharma S, Kumar A, Daouda MM. Chapter 1: Activated Carbon: Fundamentals, Classification, and Properties. In: Verma C, Quraishi MA, editors. Activated Carbon: Progress and Applications. The Royal Society of Chemistry; 2023. pp. 1–22. [Google Scholar]
- 51.Azam K, Shezad N, Shafiq I, Akhter P, Akhtar F, Jamil F, Hussain M. A review on activated carbon modifications for the treatment of wastewater containing anionic dyes. Chemosphere. 2022;306:135566. doi: 10.1016/j.chemosphere.2022.135566. [DOI] [PubMed] [Google Scholar]
- 52.Jasri K, Abdulhameed AS, Jawad AH, Al Othman ZA, Yousef TA, Al Duaij OK. Mesoporous activated carbon produced from mixed wastes of oil palm frond and palm kernel shell using microwave radiation-assisted K2CO3 activation for methylene blue dye removal: Optimization by response surface methodology. Diam. Relat. Mater. 2023;131:109581. doi: 10.1016/j.diamond.2022.109581. [DOI] [Google Scholar]
- 53.El-Nemr MA, El Nemr A, Hassaan MA, Ragab S, Tedone L, De Mastro G, Pantaleo A. Microporous activated carbon from Pisum sativum pods using various activation methods and tested for adsorption of acid orange 7 dye from water. Molecules. 2022;27(15):4840. doi: 10.3390/molecules27154840. [DOI] [PMC free article] [PubMed] [Google Scholar]
- 54.El Nemr A. Potential of pomegranate husk carbon for Cr (VI) removal from wastewater: Kinetic and isotherm studies. J. Hazard. Mater. 2009;161(1):132–141. doi: 10.1016/j.jhazmat.2008.03.093. [DOI] [PubMed] [Google Scholar]
- 55.Hussain OA, Hathout AS, Abdel-Mobdy YE, Rashed MM, Rahim EA, Fouzy ASM. Preparation and characterization of activated carbon from agricultural wastes and their ability to remove chlorpyrifos from water. Toxicol. Rep. 2023;10:146–154. doi: 10.1016/j.toxrep.2023.01.011. [DOI] [PMC free article] [PubMed] [Google Scholar]
- 56.Zayed AM, Metwally BS, Masoud MA, Mubarak MF, Shendy H, Petrounias P, Wahed MSA. Facile synthesis of eco-friendly activated carbon from leaves of sugar beet waste as a superior nonconventional adsorbent for anionic and cationic dyes from aqueous solutions. Arab. J. Chem. 2023;16(8):104900. doi: 10.1016/j.arabjc.2023.104900. [DOI] [Google Scholar]
- 57.Aftab RA, Zaidi S, Khan AAP, Usman MA, Khan AY, Chani MTS, Asiri AM. Removal of congo red from water by adsorption onto activated carbon derived from waste black cardamom peels and machine learning modeling. Alex. Eng. J. 2023;71:355–369. doi: 10.1016/j.aej.2023.03.055. [DOI] [Google Scholar]
- 58.Lewoyehu M. Comprehensive review on synthesis and application of activated carbon from agricultural residues for the remediation of venomous pollutants in wastewater. J. Anal. Appl. Pyrolysis. 2021;159:105279. doi: 10.1016/j.jaap.2021.105279. [DOI] [Google Scholar]
- 59.Liu W, Zhang Y, Wang S, Bai L, Deng Y, Tao J. Effect of pore size distribution and amination on adsorption capacities of polymeric adsorbents. Molecules. 2021;26(17):5267. doi: 10.3390/molecules26175267. [DOI] [PMC free article] [PubMed] [Google Scholar]
- 60.Ucar S, Erdem M, Tay T, Karagoz S. Removal of lead (II) and nickel (II) ions from aqueous solution using activated carbon prepared from rapeseed oil cake by Na2CO3 activation. Clean Technol Environ Policy. 2015;17:747–756. doi: 10.1007/s10098-014-0830-8. [DOI] [Google Scholar]
- 61.Ibrahim WM, Hassan AF, Azab YA. Biosorption of toxic heavy metals from aqueous solution by Ulva lactuca activated carbon. Egypt. J. Basic Appl. Sci. 2016;3:241–249. [Google Scholar]
- 62.Lima SB, Borges SMS, do Rangel MC, Marchetti SG. Effect of ıron content on the catalytic properties of activated carbon-supported magnetite derived from biomass. J. Braz. Chem. Soc. 2013;24(2):344–354. doi: 10.5935/0103-5053.20130044. [DOI] [Google Scholar]
- 63.Moreno-Castilla C, Lopez-Ramon MV, Carrasco-Marın F. Changes in surface chemistry of activated carbons by wet oxidation. Carbon. 2000;38:1995–2000. doi: 10.1016/S0008-6223(00)00048-8. [DOI] [Google Scholar]
- 64.Valde’s H, Sa’nchez-Polo M, Rivera-Utrilla J, Zaror CA. Effect of ozone treatment on surface properties of activated carbon. Langmuir. 2002;18:2111–2116. doi: 10.1021/la010920a. [DOI] [Google Scholar]
- 65.Magnacca G, Allera A, Montoneri E, Celi L, Bentio DE, Gagliardi LG, Gonzalez MC, Martire DO, Carlos L. Novel magnetite nanoparticles coated with waste—Sourced biobased substances as sustainable and renewable adsorbing materials. ACS Sustain. Chem. Eng. 2014;2:1518. doi: 10.1021/sc500213j. [DOI] [Google Scholar]
- 66.Rocher V, Siaugue JM, Cabuil V, Bee A. Removal of organic dyes by magnetic alginate beads. Water Res. 2008;42:1290–1298. doi: 10.1016/j.watres.2007.09.024. [DOI] [PubMed] [Google Scholar]
- 67.Khalil A, Salem M, Ragab S, Sillanpää M, El Nemr A. Orange peels magnetic activate carbon (MG-OPAC) composite formation for toxic chromium absorption from Wastewaters. Sci. Rep. 2023;13:3402. doi: 10.1038/s41598-023-30161-6. [DOI] [PMC free article] [PubMed] [Google Scholar]
- 68.Lopez JA, Gonzalez F, Bonilla FA, Zambrano G, Gomez ME. Synthesıs and characterızatıon of Fe3O4 magnetıc nanofluıd. Revista latino americana de metalurgia y Materials. 2010;30(1):60–66. [Google Scholar]
- 69.Ranjithkumar V, Sangeetha S, Vairam S. Synthesis of magnetic activated carbon/ α-Fe2O3 nanocomposite and its application in the removal of acid yellow 17 dye from water. J. Hazard. Mater. 2014;273:127–135. doi: 10.1016/j.jhazmat.2014.03.034. [DOI] [PubMed] [Google Scholar]
- 70.Kalantry RR, Jafari AJ, Esrafili A, Kakavandi B, Gholizadeh A, Azari A. Optimization and evaluation of reactive dye adsorption on magnetic composite of activated carbon and iron oxide. Desalin. Water Treat. 2015;57(14):6411–6422. doi: 10.1080/19443994.2015.1011705. [DOI] [Google Scholar]
- 71.El-Nemr MA, Aigbe UO, Ukhurebor KE, Onyancha RB, El Nemr A, Ragab S, Osibote OA, Hassaan MA. Adsorption of Cr6+ ion using activated Pisum sativum peels decorated with triethylenetetramine. Environ. Sci. Pollut. Res. 2022;29:91036–91060. doi: 10.1007/s11356-022-21957-6. [DOI] [PMC free article] [PubMed] [Google Scholar]
- 72.Liu R, Zhang B, Mei D, Liu J. Adsorption of methyl violet from aqueous solution by halloysite nanotubes. Desalination. 2011;268:111–116. doi: 10.1016/j.desal.2010.10.006. [DOI] [Google Scholar]
- 73.Hanafiah MAKM, Nagh WSW, Zolkafly SH, Teong LC, Majid ZAA. Acid Blue 25 adsorption on base treated Shorea dasyphylla sawdust: Kinetic, isotherm, thermodynamic and spectroscopic analysis. J. Envıron. Scı. 2012;24:261–268. doi: 10.1016/S1001-0742(11)60764-X. [DOI] [PubMed] [Google Scholar]
- 74.Fan L, Zhang Y, Li X, Luo C, Lu F, Qiu H. Removal of alizarin red from water environment using magnetic chitosan with Alizarin Red as imprinted molecules. Colloids Surf. B: Biointerfaces. 2012;91:250–257. doi: 10.1016/j.colsurfb.2011.11.014. [DOI] [PubMed] [Google Scholar]
- 75.Ho YS, McKay G. Pseudo-second order model for sorption processes. Process Biochem. 1999;34(5):451–564. doi: 10.1016/S0032-9592(98)00112-5. [DOI] [Google Scholar]
- 76.Gupta VK, Gupta B, Rastogi A, Agarwal S, Nayak A. A comparative investigation on adsorption performances of mesoporous activated carbon prepared from waste rubber tire and activated carbon for a hazardous azo dye—Acid Blue 113. J. Hazard. Mater. 2011;186:891–901. doi: 10.1016/j.jhazmat.2010.11.091. [DOI] [PubMed] [Google Scholar]
- 77.Shayesteh H, Ashrafi A, Rahbar-Kelishami A. Evaluation of Fe3O4@MnO2 core-shell magnetic nanoparticles as an adsorbent for decolorization of methylene blue dye in contaminated water: Synthesis and characterization, kinetic, equilibrium, and thermodynamic studies. J. Mol. Struct. 2017;1149:199–205. doi: 10.1016/j.molstruc.2017.07.100. [DOI] [Google Scholar]
- 78.Shayesteh H, Raji F, Rahbar Kelishami A. Influence of the alkyl chain length of surfactant on adsorption process: A case study. Surf. Interfaces. 2021;22:100806. doi: 10.1016/j.surfin.2020.100806. [DOI] [Google Scholar]
- 79.Koochakzadeh F, Norouzbeig R, Shayesteh H. Statistically optimized sequential hydrothermal route for FeTiO3 surface modification: Evaluation of hazardous cationic dyes adsorptive removal. Environ. Sci. Pollut. Res. 2023;30:19167–19181. doi: 10.1007/s11356-022-23481-z. [DOI] [PubMed] [Google Scholar]
- 80.Song D, Pan K, Tariq A, Azizullah A, Sun F, Li Z, et al. Adsorption of toxic chromium from waste-water using wheat straw and eupatorium adenophorum. Plos ONE. 2016;11(12):e0167037. doi: 10.1371/journal.pone.0167037. [DOI] [PMC free article] [PubMed] [Google Scholar]
- 81.Rajput Jr SCUP, Mohan D. Magnetic magnetite (Fe3O4) nanoparticle synthesis and applications for lead (Pb2+) and chromium (Cr6+) removal from water. J. Colloid Interf. Sci. 2015;468:334–346. doi: 10.1016/j.jcis.2015.12.008. [DOI] [PubMed] [Google Scholar]
- 82.Fan Y, Yang R, Lei Z, Liu N, Lv J, et al. Removal of Cr (VI) from aqueous solution by rice husk derived magnetic sorbents. Korean J. Chem. Eng. 2015;33:1416–1424. doi: 10.1007/s11814-015-0248-y. [DOI] [Google Scholar]
- 83.Ravulapalli S, Kunta R. Enhanced removal of chromium (VI) from wastewater using active carbon derived from Lantana camara plant as adsorbent. Water Sci. Technol. 2018;78(6):1377–1389. doi: 10.2166/wst.2018.413. [DOI] [PubMed] [Google Scholar]
- 84.Hajjaoui H, Khnifira M, Soufi A, Abdennouri M, Kaya S, Akkaya R, Barka N. Experimental, DFT and MD simulation studies of Mordant Black 11 dye adsorption onto polyaniline in aqueous solution. J. Mol. Liquids. 2022;364:120045. doi: 10.1016/j.molliq.2022.120045. [DOI] [Google Scholar]
- 85.Bagheri N, Lakouraj MM, Hasantabar V, Mohseni M. Biodegradable macro-porous CMC-polyaniline hydrogel: Synthesis, characterization and study of microbial elimination and sorption capacity of dyes from waste water. J. Hazard. Mater. 2021;403:123631. doi: 10.1016/j.jhazmat.2020.123631. [DOI] [PubMed] [Google Scholar]
Associated Data
This section collects any data citations, data availability statements, or supplementary materials included in this article.
Data Availability Statement
The data presented in this study are available on the request from the corresponding author.