

Abstract
Objective:
Alcohol-impaired driving is a major contributor to motor vehicle crash deaths and injury. Many survey studies include self-report measures of alcohol-impaired driving, but no guidance is available to help researchers select from among available measures. The aims of this systematic review were to compile a list of measures that researchers have used previously, to compare performance between measures, and to identify the measures with highest validity and reliability.
Method:
Literature searches of PubMed, Scopus, and Web of Science identified studies that assessed alcohol-impaired driving behavior through self-report. The measures from each study and, if available, indices of reliability or validity were extracted. Using the measures’ text, we developed 10 codes to group similar measures and compare them. For example, the “alcohol effects” code refers to driving while feeling dizzy or lightheaded after drinking, and the “drink count” code pertains to the number of drinks someone consumed before driving. For measures with multiple items, each item was categorized separately.
Results:
After screening according to the eligibility criteria, 41 articles were included in the review. Thirteen articles reported on reliability. No articles reported on validity. The self-report measures with the highest reliability coefficients contained items from multiple codes, namely alcohol effects and drink count.
Conclusions:
Self-report alcohol-impaired driving measures with multiple items evaluating distinct aspects of alcohol-impaired driving show better reliability than measures using a single item. Future work investigating the validity of these measures is needed to determine the best approach for conducting self-report research in this area.
Road Traffic Crashes, the eighth leading cause of death globally, are responsible for more than 1.35 million deaths and 50 million injuries each year (World Health Organization, 2018b). Alcohol-impaired driving increases the risk of crashes (Compton & Berning, 2015) as well as the risk of injury or death (Voas et al., 2012; Zador et al., 2000). In 2018, the World Health Organization reported that 27% of global deaths caused by road traffic injuries were attributable to alcohol consumption (World Health Organization, 2018a). In the United States, the burden of alcohol-impaired crashes is even greater. About one in three crashes involve alcohol, resulting in more than 10,000 deaths (National Center for Statistics and Analysis, 2022) and 3 million injuries each year (Blincoe et al., 2015). Fatalities and injuries have increased in recent years (National Center for Statistics and Analysis, 2021), totaling economic costs that exceed $44 billion (Blincoe et al., 2015).
Measuring alcohol-impaired driving is essential for research examining the prevention of injuries and deaths from alcohol-related crashes. There are many methods of collecting data related to alcohol-impaired driving behaviors, one being self-report, in which respondents are asked to report their past alcohol-impaired driving behavior via surveys, questionnaires, or interviews rather than direct observations by researchers. Prominent sources of self-report alcohol-impaired driving data are national health behavior surveys, such as the Behavioral Risk Factor Surveillance System (BRFSS; Centers for Disease Control and Prevention, 2022), the National Epidemiologic Survey on Alcohol and Related Conditions–III (NESARC-III; National Institute on Alcohol Abuse and Alcoholism, n.d.), and the National Survey on Drug Use and Health (NSDUH; Substance Abuse and Mental Health Services Administration, n.d.).
As with all self-report methods of data collection, in addition to the complexity of this behavior, there are many difficulties with measuring self-report alcohol-impaired driving, such as estimation challenges, recall bias, and social desirability bias. Alcohol-impaired driving is the concurrence of two separate behaviors: the consumption of alcohol and the action of driving a motor vehicle, resulting in driving while impaired. First, alcohol consumption must be assessed by self-report, which is affected by an estimation challenge. Respondents typically face difficulty with accurately estimating the amount of alcohol they have consumed, in part because of variations in drink size (Kerr & Stockwell, 2012; Kerr et al., 2008). This makes estimation of alcohol volume consumed difficult, especially if a respondent consumed multiple alcoholic drinks, more than one type of alcoholic beverage, and/or varying sizes of each drink. As with studies that use self-report to evaluate alcohol consumption (Cherpitel et al., 2018), self-report of alcohol-impaired driving may also be affected by recall bias. Respondents must retroactively assess their own impairment and remember if their impairment was experienced while driving. Since it may be considered a sensitive subject because of its illegality and social norms that view it as an adverse behavior, reporting alcohol-impaired driving is likely affected by social desirability bias, in which respondents may underreport alcohol-impaired driving incidents (Althubaiti, 2016). This has been documented in studies assessing alcohol consumption and alcohol-impaired driving (Davis et al., 2010; Schell et al., 2006). Mitigating biases in self-report alcohol-impaired driving research is important for producing reliable and valid results.
The usefulness of self-report measures relies on their validity: “an expression of the degree to which a measurement measures what it purports to measure” (Porta, 2008, p. 305). There are three main types of validity: content, construct, and criterion. Content validity refers to whether a measure represents all components of a construct (Heale & Twycross, 2015). An alcohol-impaired driving measure with high content validity would need to accurately measure the intersection of several behaviors: the consumption of alcohol, the subsequent impairment attributable to alcohol, and the act of driving while still impaired. The extent to which a measure reflects a construct and the subsequent ability to make inferences from a measure is construct validity (Heale & Twycross, 2015). For example, with alcohol-impaired driving measures, does a positive score on a measure accurately indicate that a person drove while impaired by alcohol? If a measure instead actually demonstrated drug-impaired driving or alcohol use disorder, construct validity would be low. Finally, criterion validity shows how well correlated a measure is to other related measures that examine the same phenomenon. High correlation with similar measures and low correlation with measures that assess a different construct demonstrate criterion validity for a measure (Heale & Twycross, 2015).
Considering the potential for bias in conducting self-report research of alcohol-impaired driving, among many different methods of measurement, there is no clear best approach for research with this method. The aims of this systematic review were to compile a list of self-report measures that researchers have used previously to study alcohol-impaired driving, to compare performance between measures, and to identify the measures with highest validity and reliability.
We hypothesize that studies adopting existing measures from nationally representative panel surveys will have the highest coefficients for reliability and validity because these measures have been developed over many years and have been subjected to extensive field testing. Reliably and validly measuring alcohol-impaired driving behavior is key to investigating risk factors and prevention strategies to reduce alcohol-impaired driving and improve population health overall.
Method
We conducted a systematic literature review examining self-report measures of alcohol-impaired driving in the past 5 years. The goal of this review was to compare self-report items used in primary survey research to assess alcohol-impaired driving behavior.
Article identification
Three electronic databases were searched for relevant articles: PubMed, Scopus, and Web of Science. Several search terms and combinations related to alcohol, impaired driving, and self-report were used and are listed in Figure 1. We retrieved articles from all three databases using the final search term combination, searching article titles, abstracts, and keywords. Before screening the articles, we removed all duplicates.
Figure 1.
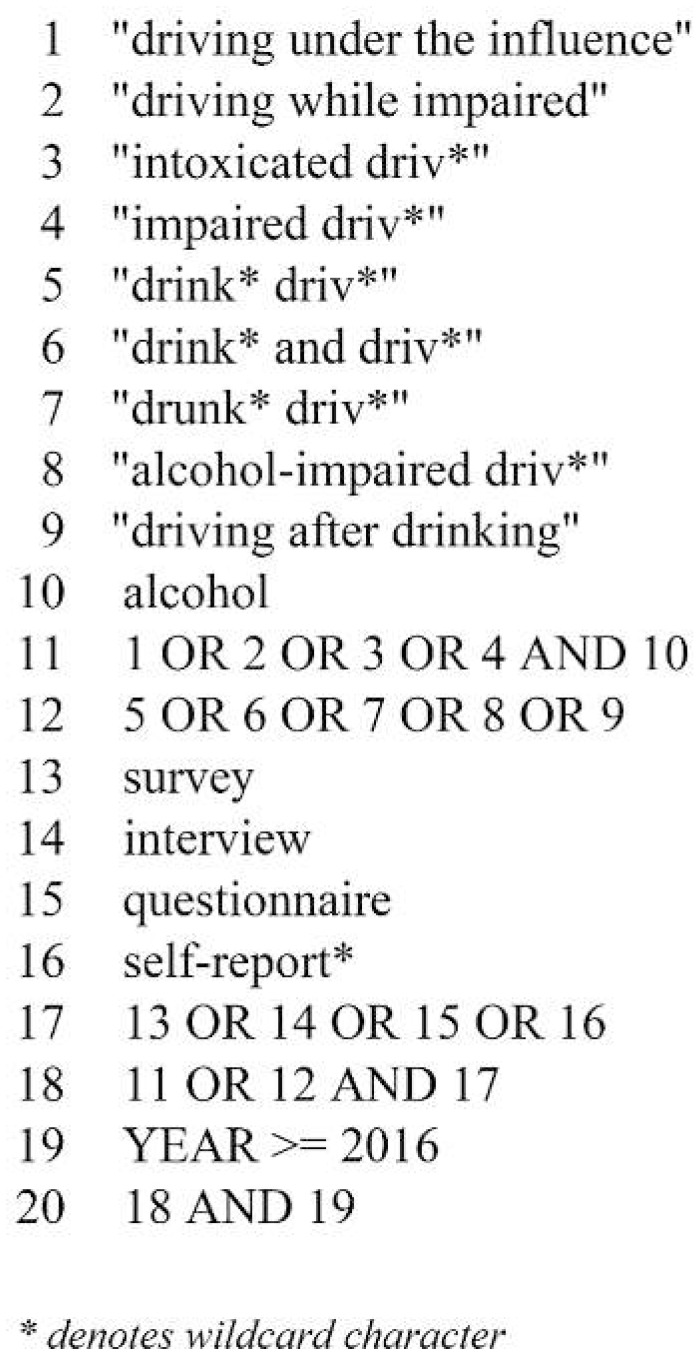
Search term strategy used for identifying articles. Combination number 20 was used for the final retrieval of all articles assessed for inclusion in this review.
Screening and eligibility criteria
The identified studies were screened for eligibility using Covidence systematic review software (Veritas Health Innovation, 2022). We performed an initial title and abstract review followed by a full text review. Articles included in the review met the following criteria: (a) published in a peer-reviewed journal, (b) written in English, (c) use individuals as the unit of analysis, (d) assess alcohol-impaired driving by self-report, and (e) published between January 1, 2016, and January 21, 2022. Articles were excluded if they (a) performed a secondary analysis, (b) did not provide an exact wording of the alcohol-impaired driving self-report measure, (c) evaluated driving impaired by any substance other than alcohol, (d) used only a combined scale of alcohol-impaired driving behaviors and other driving behaviors, and (e) measured only the avoidance of alcohol-impaired driving.
Data extraction
After articles were selected for inclusion in the review, the authors extracted the journal name, article title, year, number of participants, self-report alcohol-impaired driving measures, and mode of data collection. A measure refers to the scale, set of questions, or single question used to assess alcohol-impaired driving via self-report. Each question included in a measure is referred to as an item. We also extracted indices of validity, reliability, and internal consistency from studies that reported these values, where validity was defined as the degree to which a measure accurately evaluates the behavior of interest, and reliability was defined as the consistency of a measure, meaning the degree to which a measure produces the same score each time it is administered, with all other things being equal (Heale & Twycross, 2015). Internal consistency, a subtype of reliability, was defined as the extent to which several items assessing the same behavior yield similar scores. Typically, internal consistency is determined using the correlations between items on the same measure (Revicki, 2014). Some included articles did not directly list the self-report alcohol-impaired driving measures used in the study. For these articles, the measures were retrieved from their original source if cited within the included article.
Self-report alcohol-impaired driving codes
We developed codes for self-report measures of alcohol-impaired driving using a combination of five a priori and five emergent codes. The a priori codes were derived from major population surveys of alcohol use and related harm in the United States, namely BRFSS, NESARC-III, NSDUH, and National Alcohol Surveys (Alcohol Research Group, 2022). These codes were “too much” (subjective evaluation of driving after consuming too much alcohol to drive safely), “any consumption” (driving after consuming any alcohol in general with no quantity specified), “open container” (consuming alcohol while operating a vehicle), “DUI” (arrest for drinking and driving), and “legal limit” (driving while suspecting oneself to be over the legal blood alcohol limit, without being arrested). Some measures include multiple items. For example, the measure from NESARC-III includes the items, “In your entire life, did you EVER more than once drive a car or other vehicle WHILE you were drinking?” which we coded as “open container”; and “In your entire life, did you EVER more than once drive a car, motorcycle, truck, boat, or other vehicle AFTER having too much to drink?” which we coded as “too much.”
Emergent codes were used to group items that did not correspond to the a priori codes. These consist of items gauging the amount of alcohol consumed before driving (“drink count”; e.g., “Drive after you’d had three or more drinks of alcohol?”; Buckley et al., 2017), how much time elapsed after drinking before driving (“timeframe”; e.g., “How often have you driven within 4 hours of drinking alcohol in the past 6 months?”; Gruenewald et al., 2018), and a combination of the two (drink count + timeframe; e.g., “How often have you driven within an hour of drinking two or more standard drinks in the past 12 months?”; Armstrong et al., 2019). Two emergent codes describe feeling the effects of alcohol, like being dizzy, before driving (“alcohol effects”; e.g., “In the last 3 months, how often did you ever, at any time [no matter if your children were in the car or not], drive while you were buzzed, drunk, or light-headed from alcohol?”) (McDonald et al., 2018) and driving while feeling inebriated (“intoxicated”; e.g., “How often have you driven a vehicle while drunk?”; Beard & Wolff, 2022).
The combination of a priori and emergent codes yielded 10 unique codes that were used to group all identified items within self-report alcohol-impaired driving measures (Table 1). Each separate item in a reported measure was assigned a code, resulting in the assignment of multiple codes to any measure with more than one item assessing alcohol-impaired driving.
Table 1.
Codes developed for alcohol-impaired driving self-report measure analysis

| Code | Description |
|---|---|
| Alcohol effects | Driving while feeling the effects of alcohol (e.g., lightheaded or dizzy) |
| Any consumption | Driving after consuming any alcohol in general with no quantity specified |
| Drink count | The number of alcoholic beverages consumed before driving |
| Drink count + timeframe | The number of alcoholic beverages consumed before driving within a certain amount of time (e.g., drive within an hour after consuming two or more alcoholic drinks) |
| DUI | Arrest for drinking and driving |
| Intoxicated | Driving while suspecting oneself to be intoxicated or drunk |
| Legal limit | Driving while suspecting oneself to be over the legal blood alcohol limit, without being arrested |
| Open container | Consuming alcohol while operating a vehicle |
| Timeframe | Driving after drinking alcoholic beverages in a certain amount of time (e.g., drive within an hour after consuming alcohol) |
| Too much | Subjective evaluation of driving after consuming “too much” alcohol to drive safely |
Results
The initial search of the databases resulted in 1,023 articles. After the removal of 506 duplicates, the titles and abstracts of 517 articles were screened for initial inclusion based on the eligibility criteria. The remaining 125 articles were read in full and assessed for final inclusion according to the eligibility criteria. This resulted in 41 eligible articles included in the review (Supplemental Table 1). The Preferred Reporting Items for Systematic Reviews and Meta-Analyses (PRISMA) flow diagram for the identified studies and selection process is presented in Figure 2.
Figure 2.

Preferred Reporting Items for Systematic Reviews and Meta-Analyses (PRISMA) flow diagram outlining the article selection process. AID = alcohol-impaired driving.
The mode of data collection varied across the articles, with several studies using more than one mode. Although 31 of the articles used a self-administered survey as part of data collection, making up three quarters of included articles, 19 of these used an online survey and 16 included the use of an in-person survey. Five of the in-person surveys were electronic, in which participants completed a survey via a computer or tablet device; nine were completed via paper questionnaire; and the remaining two studies did not report the method of survey administration. One self-administered survey was a roadside survey. Eleven articles reported interviews as their data collection method: seven included in-person interviews, four had telephone interviews, and one involved an interview as part of a roadside survey.
From the 41 extracted articles and self-report measures, there were 79 items used in assessing alcohol-impaired driving. Some measures contained more than one item assigned to the same code, resulting in 65 total code assignments across the 41 measures. Figure 3 displays the count of items for each code, differentiated by whether coefficients of reliability or internal consistency were reported for the items. Of the 41 eligible articles, reliability and internal consistency were reported in 13. These 13 measures contained 23 items. No articles reported measures of validity. Table 2 lists the 13 articles with the reported coefficients for each self-report alcohol-impaired driving measure, along with the designated codes for the measure items.
Figure 3.

Count of alcohol-impaired driving (AID) self-report measure codes stratified by report of reliability or internal consistency. Some reported measures contain more than one item, resulting in multiple codes per evaluated measure. DUI = driving under the influence of alcohol.
Table 2.
Reported reliability and internal consistency coefficients

| Article | Measure code(s) | No. of items | Reported coefficient |
|---|---|---|---|
| Buckley, Bonar, Walton, Carter, Voloshyna, Ehrlich, | • Alcohol effects | 5 | Cronbach's a = .90 |
| & Cunningham (2017) | • Drink count | ||
| • Open container | |||
| de Campos, Pitombo, Delhomme, & Ferreira (2021) | • Any consumption | 2 | Cronbach's a = .812 |
| • Drink count | |||
| Freeman, Parkes, Lewis, Davey, Armstrong, | • Legal limit | 4 | Bivariate correlations: |
| & Truelove (2020) | Item 1 and 2, r = .810, p = .01 | ||
| Item 1 and 3, r = .60, p = .01 | |||
| Item 2 and 3, r = .59, p = .01 | |||
| Item 1 and 4, r = .31, p = .01 | |||
| Item 2 and 4, r = .30, p = .01 | |||
| Freeman, Parkes, Mills, Truelove, & Davey (2021) | • Legal limit | 3 | Bivariate correlations: |
| Item 1 and 2: r = .82, p < .01 | |||
| Item 1 and 3: r = .31, p < .01 | |||
| Item 2 and 3: r = .32, p < .01 | |||
| Freeman, Parkes, Truelove, Lewis, & Davey (2021) | • Legal limit | 4 | Bivariate correlations: |
| Item 1 and 2: r = .82, p < .01 | |||
| Item 1 and 3: r = .60, p < .01 | |||
| Item 1 and 4: r = .31, p < .01 | |||
| Item 2 and 3: r = .62, p < .01 | |||
| Item 2 and 4: r = .32, p < .01 | |||
| Item 3 and 4: r = .25, p < .01 | |||
| Gruenewald, LaScala, & Ponicki (2018) | • Timeframe | 2 | Intraclass correlation = .896 |
| • Too much | |||
| Mello, Baird, Lee, Strezsak, French, & | • Alcohol effects | 6 | Cronbach's a = .95 |
| Longabaugh (2016) | • Drink count | ||
| • Drink count + timeframe | |||
| • Open container | |||
| • Too much | |||
| Metzger, Blevins, Calhoun, Ritchwood, Gilmore, | • Any consumption | 2 | Bivariate correlation: |
| Stewart, & Bountress (2017) | Item 1 and 2: r = .63, p < .01 | ||
| Monroe, Nichols, Crew, Brown, & King (2020) | • Any consumption | 1 | Kappa statistic = 61.1 |
| Osilla, Paddock, McCullough, Jonsson, & | • Drink count + timeframe | 2 | Cronbach's a = .80, .86 |
| Watkins (2019) | |||
| Patel, Reed, MacKillop, & Amlung, M (2019) | • Any consumption | 2 | Bivariate correlation: |
| Item 1 and 2: r = .78, p < .05 | |||
| Shao, Yin, Yu, & Wang (2020) | • Any consumption | 4 | Cronbach's a = .622 |
| • Legal limit | |||
| Zhang, Ge, Qu, Zhang, & Sun (2018) | • Alcohol effects | 2 | Cronbach's a = .65 |
| • Intoxicated |
Note: No. = number.
The most common code overall was “legal limit,” with 19 total items. Four items reported a measure of reliability or internal consistency and 15 did not. The legal limit measures with relative reliability reported had some of the lowest coefficients, with bivariate correlation coefficients ranging from .25 to .82 (Freeman et al., 2020, 2021a, 2021b). The most common code with reliability reported, totaling five items, was “any consumption.” These items varied in their reported coefficients. For example, two any consumption items in a measure had a bivariate correlation coefficient of .63 (Metzger et al., 2017), another item had a κ statistic of 61.1 (Monroe et al., 2020), and the Cronbach's a for a measure with an any consumption item combined with a drink count item was .812 (de Campos et al., 2021).
Reported reliability and internal consistency coefficients were higher for alcohol-impaired driving measures with multiple items; however, this was seen mostly with measures containing items from different codes. For example, a measure containing four items all assigned the legal limit code saw a bivariate correlation coefficient between two items of .82, but the remaining coefficients between the items ranged from .25 to .60 (Freeman et al., 2021b). The bivariate correlation coefficient of .25 was the lowest for all items with a reported measure of reliability.
A combination of items with both objective and subjective codes—for instance, combining a drink count item with a too-much item—resulted in higher measures of reliability and internal consistency. Mello et al. (2016) reported a Cronbach's a of .95, the highest coefficient of internal consistency among all measures with reported coefficients, for their measure containing items with five different codes: alcohol effects, drink count, drink count + timeframe, open container, and too much. The next highest coefficients also followed this pattern. Combining a drink count item with an alcohol effects item and an open container item resulted in a Cronbach's a of .90 (Buckley et al., 2017), and combining a drink count item and an any consumption item had a Cronbach's a of .812 (de Campos et al., 2021). Measures with items from different codes that were both subjective had modest coefficients: A measure with an any consumption item and a legal limit item reported a Cronbach's a of .622 (Shao et al., 2020), and a measure with an alcohol effects item along with an intoxicated item had a Cronbach's a of .65 (Zhang et al., 2018).
Discussion
Measuring alcohol-impaired driving is essential for studies that examine the causes and consequences of this risky behavior. In this systematic review of survey studies published since 2016 that collected self-report information about alcohol-impaired driving, we found that 10 types of items have been used, that reliability and internal consistency were reported very infrequently, and that validity was not reported at all. We expected studies adopting existing measures from nationally representative panel surveys to have higher coefficients of validity and reliability; however, we found that measures using more than one item to measure alcohol-impaired driving had higher coefficients of reliability and internal consistency than those only using one item.
The frequency of codes among measure items varied. The most common code assigned to measure items assessed the legal limit (e.g., “How often do you drive when you think you may have been above the legal blood alcohol limit?”). However, items with this code reported some of the lowest reliability and internal consistency coefficients. There are several possibilities that may explain this pattern. Respondents may incorrectly recall the number of alcoholic beverages they consumed before driving, they might be unsure of how alcohol effects correspond with their blood alcohol concentration, and respondents might be unfamiliar with the legal blood alcohol concentration limit in their jurisdiction. Another explanation may be that when respondents respond to items of the same code in succession, they are more likely to exhibit recall bias as they continue to estimate their past behavior. Legal limit items, especially when used alone, may not be an especially reliable metric to study alcohol-impaired driving behaviors.
The next most frequent code, any consumption, had slightly higher reported reliability coefficients, but measures with multiple items across different codes performed the best with reliability. This is especially true when combining objective items (e.g., direct report of the number of drinks consumed before driving) and subjective items (e.g., feeling drunk while driving). Increasing the number of items in a measure in these cases appears to increase its reliability. The highest reliability coefficient among the articles was a Cron-bach's a of .95; the measure contained six items across five different codes (Mello et al., 2016). This pattern remains true for some similar measures (Buckley et al., 2017; de Campos, et al., 2021; Gruenewald et al., 2018), with higher coefficients reported for the combination of any consumption, drink count, and timeframe. There were other measures that contained multiple items across different codes that did not have a greater performance compared with others (Shao et al., 2020; Zhang et al., 2018), but this may be an indication of poor performance from the legal limit and intoxication codes in measuring alcohol-impaired driving behavior. These findings may also be related to respondents’ difficulty in assessing their own level of impairment when using subjective measures, as many of the extracted items used. Previous research has shown that when asked to subjectively rate their level of intoxication, respondents are likely to underestimate it relative to measured blood alcohol concentration (Kaestle et al., 2018) and overestimate their ability to drive after consuming alcohol (Köchling et al., 2021).
These findings for reliability must be viewed with caution in the absence of reports on validity. Higher coefficients of reliability show that here is a high correlation among items in a measure but do not indicate its validity. Determining the validity of self-report measures requires using a gold-standard measure of alcohol impairment while driving, most likely through the collection of respondents’ blood alcohol concentration. Previous surveys that collect blood alcohol concentration data have studied risk perception (MacLeod et al., 2017, 2020; Romano et al., 2019), alcohol use disorder (Furr-Holden et al., 2009), and feasibility (Foss et al., 1993; Roeper & Voas, 1998), although none have been used to validate a self-report measure. A few studies in the United States have evaluated alcohol-impaired driving using a gold standard, such as breath alcohol tests during roadside surveys that directly measure levels of alcohol intoxication while a respondent is driving (Fell et al., 2004; Foss et al., 1993; Furr-Holden et al., 2009; MacLeod et al., 2017, 2020; Roeper & Voas, 1998; Romano et al., 2019; Worden et al., 1989). For validation studies, this type of research requires self-report questionnaires that are assessed at the same time as the breath alcohol tests or follow-up surveys completed at a later time that assess alcohol-impaired driving behavior at the time of the roadside survey. Laboratory-based studies are another possibility for testing the validity of self-report alcohol-impaired driving measures. Driving simulators have been used in laboratory-based studies to safely investigate the relationship between alcohol impairment and driving performance (Yadav & Velaga, 2021). Combining a laboratory-based study with self-report alcohol-impaired items could provide a way to assess measure validity.
In addition to validity, future work should assess the use of a single item compared with scales in self-report alcohol-impaired driving measures. The higher reliability coefficients found for measures with multiple items across different codes, indicating high correlation among these items, could suggest that these items be used as a scale. Yet, self-report measures of alcohol-impaired driving are commonly single items, especially in national surveys investigating behavior related to alcohol. Although they present a lower burden to respondents and have often been shown to be as valid and reliable as multi-item scales, single-item measures may not be able to fully capture a complex behavior like alcohol-impaired driving (Allen et al., 2022). Comparing single-item and multi-item measures is a necessary component in determining the best performing self-report alcohol-impaired driving measure.
This review has several limitations. Only articles published in English were included. Although several articles included in this systematic review described studies that took place in non–English-speaking locations, the majority were from countries where English is the primary language. In addition, we did not have access to the survey data, which could potentially be used to assess reliability and validity. Similarly, some authors may have evaluated reliability or validity without reporting their findings.
In summary, this systematic review finds that reliability of self-report measures is higher for measures that use multiple items assessing distinct aspects of alcohol-impaired driving. Researchers interested in using self-report to investigate alcohol-impaired driving should use measures that contain at least two separate items to increase the reliability of their findings. Increasing the number of items in a measure is associated with an increase in reliability or internal consistency; however, this is only true if the items represent different facets of alcohol-impaired driving behavior. The best combination for measure reliability is asking respondents about feeling the effects of alcohol while driving and then having respondents report the count of drinks consumed before driving and the timeframe in which that alcohol consumption occurred. However, it must be taken into consideration that none of the included articles reported on validity, which is necessary for understanding the accuracy of a measure. Future studies assessing validity are required to determine the best performing self-report alcohol-impaired driving measure. Using both valid and reliable self-report survey measures of alcohol-impaired driving is essential for researchers seeking to examine the causes and consequences of a behavior with immense public health impacts in the United States and globally.
Footnotes
Research reported in this article was supported by National Institute on Alcohol Abuse and Alcoholism Award Numbers R01AA029112 and K01AA026327. The content is solely the responsibility of the authors and does not necessarily represent the official views of the National Institutes of Health.
References
- Abayomi O., Babalola O. R., Olakulehin O. A., Ighoroje M. Drink driving and risky behavior among university students in southwestern Nigeria—Implications for policy development. Traffic Injury Prevention. 2016;17:330–335. doi: 10.1080/15389588.2015.1077238. doi:10.1080/15389588.2015.1077238. [DOI] [PubMed] [Google Scholar]
- Alcohol Research Group. National Alcohol Surveys. 2022 Retrieved from https://arg.org/center/national-alcohol-surveys/ [Google Scholar]
- Allen M. S., Iliescu D., Greiff S. Single item measures in psychological science: A call to action [Editorial] European Journal of Psychological Assessment. 2022;38:1–5. doi:10.1027/1015-5759/a000699. [Google Scholar]
- Althubaiti A. Information bias in health research: Definition, pitfalls, and adjustment methods. Journal of Multidisciplinary Healthcare. 2016;9:211–217. doi: 10.2147/JMDH.S104807. doi:10.2147/JMDH.S104807. [DOI] [PMC free article] [PubMed] [Google Scholar]
- Armstrong K. A., Freeman J. E., Davey J. D., Kelly R. L. Drink driving engagement in women: An exploration of context, hazardous alcohol use, and behaviour. PLoS One. 2019;14:e0222195. doi: 10.1371/journal.pone.0222195. doi:10.1371/journal.pone.0222195. [DOI] [PMC free article] [PubMed] [Google Scholar]
- Arria A. M., Caldeira K. M., Bugbee B. A., Vincent K. B., O’Grady K. E. Energy drink use patterns among young adults: Associations with drunk driving. Alcoholism: Clinical and Experimental Research. 2016;40:2456–2466. doi: 10.1111/acer.13229. doi:10.1111/acer.13229. [DOI] [PMC free article] [PubMed] [Google Scholar]
- Bachani A. M., Risko C. B., Gnim C., Coelho S., Hyder A. A. Knowledge, attitudes, and practices around drinking and driving in Cambodia: 2010-2012. Public Health. 2017;144(Supplement):S32–S38. doi: 10.1016/j.puhe.2016.12.012. doi:10.1016/j.puhe.2016.12.012. [DOI] [PubMed] [Google Scholar]
- Beard S. J., Wolff J. M. The moderating role of positive peers in reducing substance use in college students. Journal of American College Health. 2022;70:1059–1070. doi: 10.1080/07448481.2020.1784907. doi:10.1080/07448481.2020.1784907. [DOI] [PubMed] [Google Scholar]
- Begg D., Brookland R., Connor J. Associations of repeated high alcohol use with unsafe driving behaviors, traffic offenses, and traffic crashes among young drivers: Findings from the New Zealand Drivers Study. Traffic Injury Prevention. 2017;18:111–117. doi: 10.1080/15389588.2016.1224345. doi:10.1080/15389588.2016.1224345. [DOI] [PubMed] [Google Scholar]
- Blincoe L. J., Miller T. R., Zaloshnja E., Lawrence B. A. Department U.S. of Transportation, National Highway Traffic Safety Administration; 2015. The economic and societal impact of motor vehicle crashes, 2010 (revised) (DOT HS 812 013) Retrieved from https://crashstats.nhtsa.dot.gov/Api/Public/ViewPublication/812013. [Google Scholar]
- Buckley L., Bonar E. E., Walton M. A., Carter P. M., Voloshyna D., Ehrlich P. F., Cunningham R. M. Marijuana and other substance use among male and female underage drinkers who drive after drinking and ride with those who drive after drinking. Addictive Behaviors. 2017;71:7–11. doi: 10.1016/j.addbeh.2017.02.016. doi:10.1016/j.addbeh.2017.02.016. [DOI] [PMC free article] [PubMed] [Google Scholar]
- Caetano R., Vaeth P. A. C., Romano E., Canino G. Drinking and driving in Puerto Rico. Substance Use & Misuse. 2018;53:1492–1500. doi: 10.1080/10826084.2017.1413394. doi:10.1080/10826084.2017.1413394. [DOI] [PMC free article] [PubMed] [Google Scholar]
- Centers for Disease Control and Prevention. Behavioral Risk Factor Surveillance System. 2022. May 4, Retrieved from https://www.cdc.gov/brfss/index.html.
- Cherpitel C. J., Ye Y., Stockwell T., Vallance K., Chow C. Recall bias across 7 days in self-reported alcohol consumption prior to injury among emergency department patients. Drug and Alcohol Review. 2018;37:382–388. doi: 10.1111/dar.12558. doi:10.1111/dar.12558. [DOI] [PMC free article] [PubMed] [Google Scholar]
- Compton R. P., Berning A.2015FebruaryDrug and alcohol crash risk (DOT HS 812 117). Department U.S. of Transportation, National Highway Traffic Safety Administration; Retrieved from https://nhtsa.gov/staticfiles/nti/pdf/812117-Drug_and_Alcohol_Crash_Risk.pdf [Google Scholar]
- Curtis A., Coomber K., Hyder S., Droste N., Pennay A., Jenkinson R., Miller P. G. Prevalence and correlates of drink driving within patrons of Australian night-time entertainment precincts. Accident Analysis & Prevention. 2016;95(Part A):187–191. doi: 10.1016/j.aap.2016.07.018. doi:10.1016/j.aap.2016.07.018. [DOI] [PubMed] [Google Scholar]
- Davis C. G., Thake J., Vilhena N. Social desirability biases in self-reported alcohol consumption and harms. Addictive Behaviors. 2010;35:302–311. doi: 10.1016/j.addbeh.2009.11.001. doi:10.1016/j.addbeh.2009.11.001. [DOI] [PubMed] [Google Scholar]
- de Campos C. I., Pitombo C. S., Delhomme P., Ferreira S.2021What are the risk behaviors of Brazilian and Portuguese drivers? An exploratory approach using self-reported data Case Studies on Transport Policy 91746–1756.doi:10.1016/j.cstp.2021.07.021 [Google Scholar]
- Foss R. D., Voas R. B., Beirness D. J. Using a passive alcohol sensor to detect legally intoxicated drivers. American Journal of Public Health. 1993;83:556–560. doi: 10.2105/ajph.83.4.556. doi:10.2105/AJPH.83.4.556. [DOI] [PMC free article] [PubMed] [Google Scholar]
- Freeman J., Parkes A., Lewis N., Davey J. D., Armstrong K. A., True-love V. Past behaviours and future intentions: An examination of perceptual deterrence and alcohol consumption upon a range of drink driving events. Accident Analysis & Prevention. 2020;137:105428. doi: 10.1016/j.aap.2019.105428. doi:10.1016/j.aap.2019.105428. [DOI] [PubMed] [Google Scholar]
- Freeman J., Parkes A., Mills L., Truelove V., Davey J. A study identifying the origins of different types of drink driving events through the lens of deterrence: Is it alcohol abuse or avoiding detection? Transportation Research Part F: Traffic Psychology and Behaviour. 2021a;79:157–169. doi:10.1016/j.trf.2021.04.016. [Google Scholar]
- Freeman J., Parkes A., Truelove V., Lewis N., Davey J. D. Does seeing it make a difference? The self-reported deterrent impact of random breath testing. Journal of Safety Research. 2021b;76:1–8. doi: 10.1016/j.jsr.2020.09.013. doi:10.1016/j.jsr.2020.09.013. [DOI] [PubMed] [Google Scholar]
- Freeman J., Szogi E., Truelove V., Vingilis E. The law isn't everything: The impact of legal and non-legal sanctions on motorists’ drink driving behaviors. Journal of Safety Research. 2016;59:53–60. doi: 10.1016/j.jsr.2016.10.001. doi:10.1016/j.jsr.2016.10.001. [DOI] [PubMed] [Google Scholar]
- Furr-Holden C. D., Voas R. B., Lacey J., Kelley-Baker T., Romano E., Smart M. Toward national estimates of alcohol use disorders among drivers: Results from the National Roadside Survey Pilot Program. Traffic Injury Prevention. 2009;10:403–409. doi: 10.1080/15389580903131498. doi:10.1080/15389580903131498. [DOI] [PMC free article] [PubMed] [Google Scholar]
- Goldenbeld C., Torfs K., Vlakveld W., Houwing S. Impaired driving due to alcohol or drugs: International differences and determinants based on E-Survey of Road Users’ Attitudes first-wave results in 32 countries. IATSS Research. 2020;44:188–196. doi:10.1016/j.iatssr.2020.07.005. [Google Scholar]
- Greene K. M., Hedstrom A. M., Murphy S. T. Driving/riding after alcohol and marijuana use among young adults: Is residing with family protective? Traffic Injury Prevention. 2019;20:679–684. doi: 10.1080/15389588.2019.1641597. doi:10.1080/15389588.2019.1641597. [DOI] [PMC free article] [PubMed] [Google Scholar]
- Gruenewald P. J., LaScala E. A., Ponicki W. R. Identifying the population sources of alcohol impaired driving: An assessment of context specific drinking risks. Journal of Studies on Alcohol and Drugs. 2018;79:702–709. doi: 10.15288/jsad.2018.79.702. doi:10.15288/jsad.2018.79.702. [DOI] [PMC free article] [PubMed] [Google Scholar]
- Hagemeister C., Kronmaier M. Alcohol consumption and cycling in contrast to driving. Accident Analysis & Prevention. 2017;105:102–108. doi: 10.1016/j.aap.2017.01.001. doi:10.1016/j.aap.2017.01.001. [DOI] [PubMed] [Google Scholar]
- Heale R., Twycross A. Validity and reliability in quantitative studies. Evidence-Based Nursing. 2015;18:66–67. doi: 10.1136/eb-2015-102129. doi:10.1136/eb-2015-102129. [DOI] [PubMed] [Google Scholar]
- Jannusch T., Shannon D., Völler M., Murphy F., Mullins M. Smartphone use while driving: An investigation of young novice driver (YND) behaviour. Transportation Research Part F: Traffic Psychology and Behaviour. 2021;77:209–220. doi:10.1016/j.trf.2020.12.013. [Google Scholar]
- Kaestle C. E., Droste N., Peacock A., Bruno R., Miller P. Perception of intoxication in a field study of the night-time economy: Blood alcohol concentration, patron characteristics, and event-level predictors. Addictive Behaviors. 2018;76:195–200. doi: 10.1016/j.addbeh.2017.08.018. doi:10.1016/j.addbeh.2017.08.018. [DOI] [PubMed] [Google Scholar]
- Kelley-Baker T., Villavicencio L., Arnold L. S., Benson A. J., Anorve V., Tefft B. C. Risky driving behaviors of drivers who use alcohol and cannabis. Transportation Research Record: Journal of the Transportation Research Board. 2021;2675:339–344. doi:10.1177/0361198121989727. [Google Scholar]
- Kerr W. C., Patterson D., Koenen M. A., Greenfield T. K. Alcohol content variation of bar and restaurant drinks in Northern California. Alcoholism: Clinical and Experimental Research. 2008;32:1623–1629. doi: 10.1111/j.1530-0277.2008.00741.x. doi:10.1111/j.1530-0277.2008.00741.x. [DOI] [PMC free article] [PubMed] [Google Scholar]
- Kerr W. C., Stockwell T. Understanding standard drinks and drinking guidelines. Drug and Alcohol Review. 2012;31:200–205. doi: 10.1111/j.1465-3362.2011.00374.x. doi:10.1111/j.1465-3362.2011.00374.x. [DOI] [PMC free article] [PubMed] [Google Scholar]
- Köchling J., Geis B., Chao C. M., Dieks J. K., Wirth S., Hensel K. O. The hazardous (mis)perception of Self-estimated Alcohol intoxication and Fitness to drivE-an avoidable health risk: The SAFE randomised trial. Harm Reduction Journal. 2021;18:122. doi: 10.1186/s12954-021-00567-4. doi:10.1186/s12954-021-00567-4. [DOI] [PMC free article] [PubMed] [Google Scholar]
- MacLeod K. E., Karriker-Jaffe K. J., Satariano W. A., Kelley-Baker T., Lacey J. H., Ragland D. R. Drinking and driving and perceptions of arrest risk among California drivers: Relationships with DUI arrests in their city of residence. Traffic Injury Prevention. 2017;18:566–572. doi: 10.1080/15389588.2017.1285022. doi:10.1080/15389588.2017.1285022. [DOI] [PMC free article] [PubMed] [Google Scholar]
- MacLeod K. E., Thorhauge M., Villalobos V., van Meijgaard J., Karriker-Jaffe K. J., Kelley-Baker T., Ragland D. R. To drive or not to drive? A study of travel behavior for a recent drinking occasion. Travel Behaviour & Society. 2020;20:74–82. doi: 10.1016/j.tbs.2020.02.008. doi:10.1016/j.tbs.2020.02.008. [DOI] [PMC free article] [PubMed] [Google Scholar]
- Malathesh B. C., Kumar C. N., Kandasamy A., Moirangthem S., Math S. B., Murthy P. Legal, social, and occupational problems in persons with alcohol use disorder: An exploratory study. Indian Journal of Psychological Medicine. 2021;43:234–240. doi: 10.1177/0253717620956466. doi:10.1177/0253717620956466. [DOI] [PMC free article] [PubMed] [Google Scholar]
- Martin R. J., Cox M. J., Chaney B. H., Knowlden A. P. Examination of associations between risky driving behaviors and hazardous drinking among a sample of college students. Traffic Injury Prevention. 2018;19:563–568. doi: 10.1080/15389588.2018.1476690. doi:10.1080/15389588.2018.1476690. [DOI] [PubMed] [Google Scholar]
- McDonald C. C., Kennedy E., Fleisher L., Zonfrillo M. R. Factors associated with cell phone use while driving: A survey of parents and caregivers of children ages 4-10 years. Journal of Pediatrics. 2018;201:208–214. doi: 10.1016/j.jpeds.2018.06.003. doi:10.1016/j.jpeds.2018.06.003. [DOI] [PubMed] [Google Scholar]
- Mello M. J., Baird J., Lee C., Strezsak V., French M. T., Long-abaugh R. A randomized controlled trial of a telephone intervention for alcohol misuse with injured emergency department patients. Annals of Emergency Medicine. 2016;67:263–275. doi: 10.1016/j.annemergmed.2015.09.021. doi:10.1016/j.annemergmed.2015.09.021. [DOI] [PMC free article] [PubMed] [Google Scholar]
- Metzger I. W., Blevins C., Calhoun C. D., Ritchwood T. D., Gilmore A. K., Stewart R., Bountress K. E. An examination of the impact of maladaptive coping on the association between stressor type and alcohol use in college. Journal of American College Health. 2017;65:534–541. doi: 10.1080/07448481.2017.1351445. doi:10.1080/07448481.2017.1351445. [DOI] [PMC free article] [PubMed] [Google Scholar]
- Monroe K., Nichols M., Crew M., Brown L., King W. Evaluating teen driving knowledge and behaviors following educational outreach. Injury Epidemiology. 2020;7(Supplement 1):30. doi: 10.1186/s40621-020-00255-0. doi:10.1186/s40621-020-00255-0. [DOI] [PMC free article] [PubMed] [Google Scholar]
- National Center for Statistics and Analysis. Department U.S. of Transportation, National Highway Traffic Safety Administration; 2021. Jun, Early estimates of motor vehicle traffic fatalities and fatality rate by sub-categories in 2020 (DOT HS 813 118) Retrieved from https://crash-stats.nhtsa.dot.gov/Api/Public/ViewPublication/813118. [Google Scholar]
- National Center for Statistics and Analysis. Department U.S. of Transportation, National Highway Traffic Safety Administration; 2022. Apr, Alcohol-impaired driving: 2020 data (DOT HS 813 294) Retrieved from https://crashstats.nhtsa.dot.gov/Api/Public/ViewPublication/813294. [Google Scholar]
- National Institute on Alcohol Abuse and Alcoholism. National Epidemiologic Survey on Alcohol and Related Conditions-III (NESARC-III) n.d.. Retrieved from https://www.niaaa.nih.gov/research/nesarc-iii. [PMC free article] [PubMed]
- Navas J. F., Martín-Pérez C., Petrova D., Verdejo-García A., Cano M., Sagripanti-Mazuquín O., Vilar-López R. Sex differences in the association between impulsivity and driving under the influence of alcohol in young adults: The specific role of sensation seeking. Accident Analysis & Prevention. 2019;124:174–179. doi: 10.1016/j.aap.2018.12.024. doi:10.1016/j.aap.2018.12.024. [DOI] [PubMed] [Google Scholar]
- Osilla K. C., Paddock S. M., McCullough C. M., Jonsson L., Watkins K. E. Randomized clinical trial examining cognitive behavioral therapy for individuals with a first-time DUI offense. Alcoholism: Clinical and Experimental Research. 2019;43:2222–2231. doi: 10.1111/acer.14161. doi:10.1111/acer.14161. [DOI] [PMC free article] [PubMed] [Google Scholar]
- Patel H., Reed D. D., MacKillop J., Amlung M. T. Clarifying the relation between alcohol demand and alcohol-related relative reinforcement and driving after drinking in a Canadian community sample. Canadian Journal of Addiction. 2019;10:16–23. doi:10.1097/CXA.0000000000000048. [Google Scholar]
- Patrick M. E., Graupensperger S., Dworkin E. R., Duckworth J. C., Abdallah D. A., Lee C. M. Intoxicated driving and riding with impaired drivers: Comparing days with alcohol, marijuana, and simultaneous use. Drug and Alcohol Dependence. 2021;225:108753. doi: 10.1016/j.drugalcdep.2021.108753. doi:10.1016/j.drugalcdep.2021.108753. [DOI] [PMC free article] [PubMed] [Google Scholar]
- Porta M. (Ed.)2008A dictionary of epidemiology (5th ed.). New York, NY: Oxford University Press; doi:10.1093/acref/9780195314496.001.0001 [Google Scholar]
- Revicki D.2014Internal consistency reliability In Michalos A. C. (Ed.), Encyclopedia of quality of life and well-being researchpp. 3305–3306.Dordrecht: Springer Netherlands [Google Scholar]
- Roeper P., Voas R. B. Alcohol consumption measured at roadside surveys and variations in traffic injury crashes. Accident Analysis & Prevention. 1998;30:409–416. doi: 10.1016/s0001-4575(98)00004-9. doi:10.1016/S0001-4575(98)00004-9. [DOI] [PubMed] [Google Scholar]
- Romano E., Kelley-Baker T., Hoff S., Eichelberger A., Ramírez A. Use of alcohol and cannabis among adults driving children in Washington state. Journal of Studies on Alcohol and Drugs. 2019;80:196–200. doi: 10.15288/jsad.2019.80.196. doi:10.15288/jsad.2019.80.196. [DOI] [PMC free article] [PubMed] [Google Scholar]
- Romano E., Sanchez M., Taylor E. P., Babino R. Driving while impaired and riding with an impaired driver among recent Latinx immigrants. Transportation Research Record: Journal of the Transportation Research Board. 2021;2675:1140–1150. doi:10.1177/03611981211014894. [Google Scholar]
- Schell T. L., Chan K. S., Morral A. R. Predicting DUI recidivism: Personality, attitudinal, and behavioral risk factors. Drug and Alcohol Dependence. 2006;82:33–40. doi: 10.1016/j.drugalcdep.2005.08.006. doi:10.1016/j.drugalcdep.2005.08.006. [DOI] [PubMed] [Google Scholar]
- Scott-Parker B., Oviedo-Trespalacios O. Young driver risky behaviour and predictors of crash risk in Australia, New Zealand and Colombia: Same but different? Accident Analysis & Prevention. 2017;99:30–38. doi: 10.1016/j.aap.2016.11.001. Part A. doi:10.1016/j.aap.2016.11.001. [DOI] [PubMed] [Google Scholar]
- Shao H., Yin J., Yu W., Wang Q. Aberrant driving behaviours on risk involvement among drivers in China. Journal of Advanced Transportation. 20202020:1–8. Article ID 8878711. doi:10.1155/2020/8878711. [Google Scholar]
- Substance Abuse and Mental Health Services Administration. National Survey on Drug Use and Health. n.d.. Retrieved from https://nsduhweb.rti.org/respweb/homepage.cfm.
- Szogi E., Darvell M., Freeman J., Truelove V., Palk G., Davey J., Armstrong K. Does getting away with it count? An application of Stafford and Warr's reconceptualised model of deterrence to drink driving. Accident Analysis & Prevention. 2017;108:261–267. doi: 10.1016/j.aap.2017.08.006. doi:10.1016/j.aap.2017.08.006. [DOI] [PubMed] [Google Scholar]
- Talwar A., Hill L. L., DiGuiseppi C., Betz M. E., Eby D. W., Molnar L. J., Strogatz D. Patterns of self-reported driving while intoxicated among older adults. Journal of Applied Gerontology. 2020;39:944–953. doi: 10.1177/0733464819854005. doi:10.1177/0733464819854005. [DOI] [PubMed] [Google Scholar]
- Veritas Health Innovation. Melbourne, Australia: Author; 2022. Covidence systematic review software. Retrieved from https://www.covidence.org. [Google Scholar]
- Voas R. B., Torres P., Romano E., Lacey J. H. Alcohol-related risk of driver fatalities: An update using 2007 data. Journal of Studies on Alcohol and Drugs. 2012;73:341–350. doi: 10.15288/jsad.2012.73.341. doi:10.15288/jsad.2012.73.341. [DOI] [PMC free article] [PubMed] [Google Scholar]
- Wallisch L., Zemore S. E., Borges G., Cherpitel C. J., Maxwell J. C. Prevalence and correlates of arrests or stops for drunk driving on both sides of the U.S.–Mexico border. Journal of Ethnicity in Substance Abuse. 2018;17:478–500. doi: 10.1080/15332640.2017.1288190. doi:10.1080/15332640.2017.1288190. [DOI] [PMC free article] [PubMed] [Google Scholar]
- Watling H., Armstrong K. A. Predicting self-reported drink driving among middle-aged women. Accident Analysis & Prevention. 2017;101:154–159. doi: 10.1016/j.aap.2017.02.008. doi:10.1016/j.aap.2017.02.008. [DOI] [PubMed] [Google Scholar]
- Watling H., Hooijer J., Armstrong K., Watling C. N. The influence of social factors and personality constructs on drink driving among young licenced drivers. Transportation Research Part F: Traffic Psychology and Behaviour. 2018;52:210–221. doi:10.1016/j.trf.2017.11.023. [Google Scholar]
- Watson-Brown N., Truelove V., Parker E., Davey J. Drink driving during the COVID-19 pandemic. Transportation Research Part F: Traffic Psychology and Behaviour. 2021;78:369–380. doi: 10.1016/j.trf.2021.02.020. doi:10.1016/j.trf.2021.02.020. [DOI] [PMC free article] [PubMed] [Google Scholar]
- Webster J. M., Tillson M., Dickson M. F., Staton M. Impaired driving among rural female drug-involved offenders. Traffic Injury Prevention. 2020;21:513–520. doi: 10.1080/15389588.2020.1810244. doi:10.1080/15389588.2020.1810244. [DOI] [PMC free article] [PubMed] [Google Scholar]
- Worden J. K., Flynn B. S., Merrill D. G., Waller J. A., Haugh L. D. Preventing alcohol-impaired driving through community self-regulation training. American Journal of Public Health. 1989;79:287–290. doi: 10.2105/ajph.79.3.287. doi:10.2105/AJPH.79.3.287. [DOI] [PMC free article] [PubMed] [Google Scholar]
- World Health Organization. Global status report on alcohol and health 2018 (Licence: CC BY-NC-SA 3.0 IGO) 2018a. Retrieved from https://www.who.int/publications/i/item/9789241565639.
- World Health Organization. Global status report on road safety 2018 (Licence: CC BYNC-SA 3.0 IGO) 2018b. Retrieved from https://www.ho.int/publications/i/item/9789241565684.
- Yadav A. K., Velaga N. R. A comprehensive review of the laboratory-based research investigating the influence of alcohol on driving behaviour. Transportation Research Part F: Traffic Psychology and Behaviour. 2021;81:557–585. doi:10.1016/j.trf.2021.07.010. [Google Scholar]
- Zador P. L., Krawchuk S. A., Voas R. B. Alcohol-related relative risk of driver fatalities and driver involvement in fatal crashes in relation to driver age and gender: An update using 1996 data. Journal of Studies on Alcohol. 2000;61:387–395. doi: 10.15288/jsa.2000.61.387. doi:10.15288/jsa.2000.61.387. [DOI] [PubMed] [Google Scholar]
- Zhang Q., Ge Y., Qu W., Zhang K., Sun X. The traffic climate in China: The mediating effect of traffic safety climate between personality and dangerous driving behavior. Accident Analysis & Prevention. 2018;113:213–223. doi: 10.1016/j.aap.2018.01.031. doi:10.1016/j.aap.2018.01.031. [DOI] [PubMed] [Google Scholar]