

Abstract
Background and Aims:
Management of alcohol use disorder (AUD) could be enhanced by effective remote treatments. Study tested whether supplementing intensive outpatient programs (IOPs) with continuing care delivered via: (1) telephone, (2) smartphone, or (3) their combination improves outcomes relative to (4) IOP only. Continuing care conditions were also compared.
Design:
Randomized controlled trial of 4 groups with 3, 6, 9, 12, and 18-month follow-ups.
Setting:
University research center in Philadelphia, Pennsylvania, USA.
Participants:
Participants (N=262) met DSM-V criteria for AUD, were largely male (71%) and African-American (82%).
Interventions and Comparator:
Telephone Monitoring and Counseling (TMC; N=59), Addiction Comprehensive Health Enhancement Support System (ACHESS; N=68), and TMC+ACHESS (N=70) provided for 12 months. The control condition received IOP only (TAU; N=65).
Measurement:
Primary outcome was percent days heavy drinking (PDHD) in months 1-12. Secondary outcomes were any drinking, any drug use, drinking consequences, and quality of life.
Findings:
Mean PDHD in months 1-12 was 10.29 in TAU, 5.41 in TMC, 6.80 in ACHESS, and 5.99 in TMC+ACHESS. PDHD was lower in TMC (d=.35, p=0.018, 95% confidence interval (CI) = [−1.42, −0.20]), ACHESS (d= .31, p= .031, 95% CI= [−1.27, −0.06]), and TMC+ACHESS (d= .36, p=0.009, 95% CI = [−1.40, −0.20]) than in TAU. Differences between TMC+ACHESS, TMC, and ACHESS were small (d≤ .06) and non-significant. Findings were inconclusive as to whether or not the treatment conditions differed on PDHD at 18 months. A significant effect was obtained on Any Drinking, which was higher in months 1-12 in TAU than in TMC (odds ratio (OR)= 3.02, standard error (SE)=0.43, 95% CI= [1.30, 6.99], p=0.01) and TMC+ACHESS (OR= 2.43, SE=0.39, 95% CI= [1.12, 5.27], p=0.03). No other significant effects were obtained on other secondary outcomes during or after treatment.
Conclusions:
A telephone-delivered intervention and a smartphone-delivered intervention, alone and in combination, provided effective remote continuing care for alcohol use disorder. The combination of both interventions was not superior to either alone and effects did not persist post-treatment.
Introduction
Individuals with alcohol use disorder (AUD) often require continuing care to achieve stable recoveries [1]. One challenge in providing continuing care is that many individuals cannot attend sessions at clinics, due to living in rural areas, employment or family responsibilities, lack of transportation, illness, or disabilities. Moreover, major events such as the COVID 19 pandemic can preclude clinic visits. Therefore, there is a need for remote interventions that provide effective follow-up care for individuals with AUD [2–5]. However, relatively little research has focused on remote delivery of this phase of care and no study has directly compared different remote interventions [6].
Two promising remote continuing care interventions for AUD are Telephone Monitoring and Counseling (TMC) and the Addiction Comprehensive Health Enhancement Support System (ACHESS), a smartphone program. TMC combines measurement-based care with elements of Cognitive Behavioral Therapy (CBT) [7,8], whereas ACHESS provides recovery support services with minimal monitoring by a care team [9]. The present study extends prior work by determining whether adding TMC, ACHESS, or an integrated combination of both interventions to intensive outpatient programs (IOPs) improves outcomes for AUD. Moreover, the study examines whether TMC and ACHESS differ, and whether the combination intervention is superior to the individual interventions.
Telephone Continuing Care
In IOP completers, TMC produced better alcohol use outcomes than clinic-based group counseling and relapse prevention continuing care [7]. Adding TMC while patients were attending IOP produced significantly less alcohol use than IOP alone during the 18-month intervention, but not during a six month post-treatment follow-up [8]. TMC is more effective for poorer prognosis patients, such as those who fail to achieve abstinence early in treatment, have poor social support, or low motivation [10–12].
Smart Phone-Based Recovery Support
Computer- and smartphone-delivered interventions for AUD fall into two categories: Digitized versions of existing interventions such as CBT and packages that include a variety of components and tools thought to provide support and reduce risk of relapse [13]. ACHESS, an example of this latter category, is a smartphone system that offers access to 12 components tailored to meet patients’ recovery needs, with minimal monitoring by clinical staff [9].
In a controlled trial, patients with AUD who completed residential treatment were randomized to receive ACHESS for 8 months or standard continuing care. Patients receiving ACHESS reported 49% fewer risky drinking days at 4, 8, and 12 month follow-ups. Rates of alcohol abstinence were higher in ACHESS than in TAU at 8 and 12 months [9]. In another study, ACHESS nearly doubled retention for women in treatment [14]. In a review that identified studies of six smart phone apps designed to reduce alcohol use, ACHESS was one of only two interventions that demonstrated efficacy [15].
Integration of Counselor-Delivered and Smartphone Recovery Supports
Smart phone technology can bridge periods between continuing care sessions. It provides recovery support during the evenings and on weekends when counselors are often unavailable [16–20]. In a review of studies where smart phones were added to psychotherapy for behavioral disorders [21], effects favoring the smart phone interventions were in the moderate-to-large range. Effective interventions featured better integration of telephone technology with psychotherapy, smart phone protocols that supported psychotherapy goals, and face-to-face introductions to the program [21]. An important challenge for the alcohol treatment field is to determine how best to integrate smartphone app recovery supports and counselor-delivered continuing care. The combination of two remote interventions with complementary features, such as TMC and ACHESS, could be a particularly effective package.
Study Hypotheses
TMC, ACHESS, and TMC+ACHESS were predicted to be superior to standard care (i.e., IOP plus clinic-based continuing care only) on the primary outcome, frequency of heavy drinking days during the 12-month treatment period. Comparative effectiveness analyses examined differences between TMC and ACHESS, and between TMC+ACHESS and TMC and ACHESS. Secondary outcomes examined were any drinking, any drug use, negative consequences of alcohol use, and quality of life. A biological measure of heavy drinking [disialo carbohydrate-deficient transferrin (%dCDT)] was obtained to validate self-reports of alcohol use. Outcomes at an 18 month follow-up were also examined in secondary analyses.
Methods
Design
The study had a 4 group design in which treatments were compared during the 12 month treatment phase and at post-treatment follow-up (18 months post-baseline). Follow-ups were at 3, 6, 9, 12, and 18 months. The trial protocol was registered at https://clinicaltrials.gov/ct2/show/NCT02681406?id=NCT02681406&draw=2&rank=1, and published elsewhere [22].
Participants were randomized to either: TMC (N= 59), ACHESS (N= 68), TMC+ ACHESS (N= 70), or TAU (N= 65). The allocation sequence was provided by SAS PROC PLAN, blocking on groups of 16. Randomization was stratified by site, gender, and co-occurring drug use. The latter two factors were included because these factors have often predicted outcome and differential treatment response in our prior studies, as well as other studies of AUD treatment. Dr. Lynch, the study statistician, provided the random sequences, and the allocations by other study staff. Although efforts were made to blind research personnel conducting follow-up assessments to treatment condition, it was ultimately not possible to do so. Most participants at some point during the lengthy treatment phase asked research staff questions during a follow-up about the intervention they were receiving or equipment provided (e.g., smartphone, data plan, telephone), and it was therefore not feasible to maintain complete blinding to condition.
Participants
Participants were 262 adults recruited from four publicly funded IOPs in Philadelphia. Criteria for participation were: DSM-V diagnosis of current, moderate to severe AUD; completed 3 weeks of IOP; 18 to 75 years of age; no current psychotic disorder or dementia; no acute medical problem requiring inpatient treatment; and not receiving other addiction treatment. Participants had to provide the name, verified telephone number, and address of ≥ 2 contacts willing to provide participant locator information to aid in follow-up; and be functionally literate.
Of 634 patients screened, 269 were eligible and were enrolled (7 pilots who were not included in the analyses and 262 randomized participants) (see Figure 1). Primary reasons for failure to enter the study were: Not reached after initial screening (132 of 365 not eligible, or 36%); no show for scheduled baseline assessment and unable/unwilling to reschedule (121, or 33%); no current moderate or severe AUD (58, or 16%); and in treatment longer than 6 weeks (36, or 10%).
Figure 1:
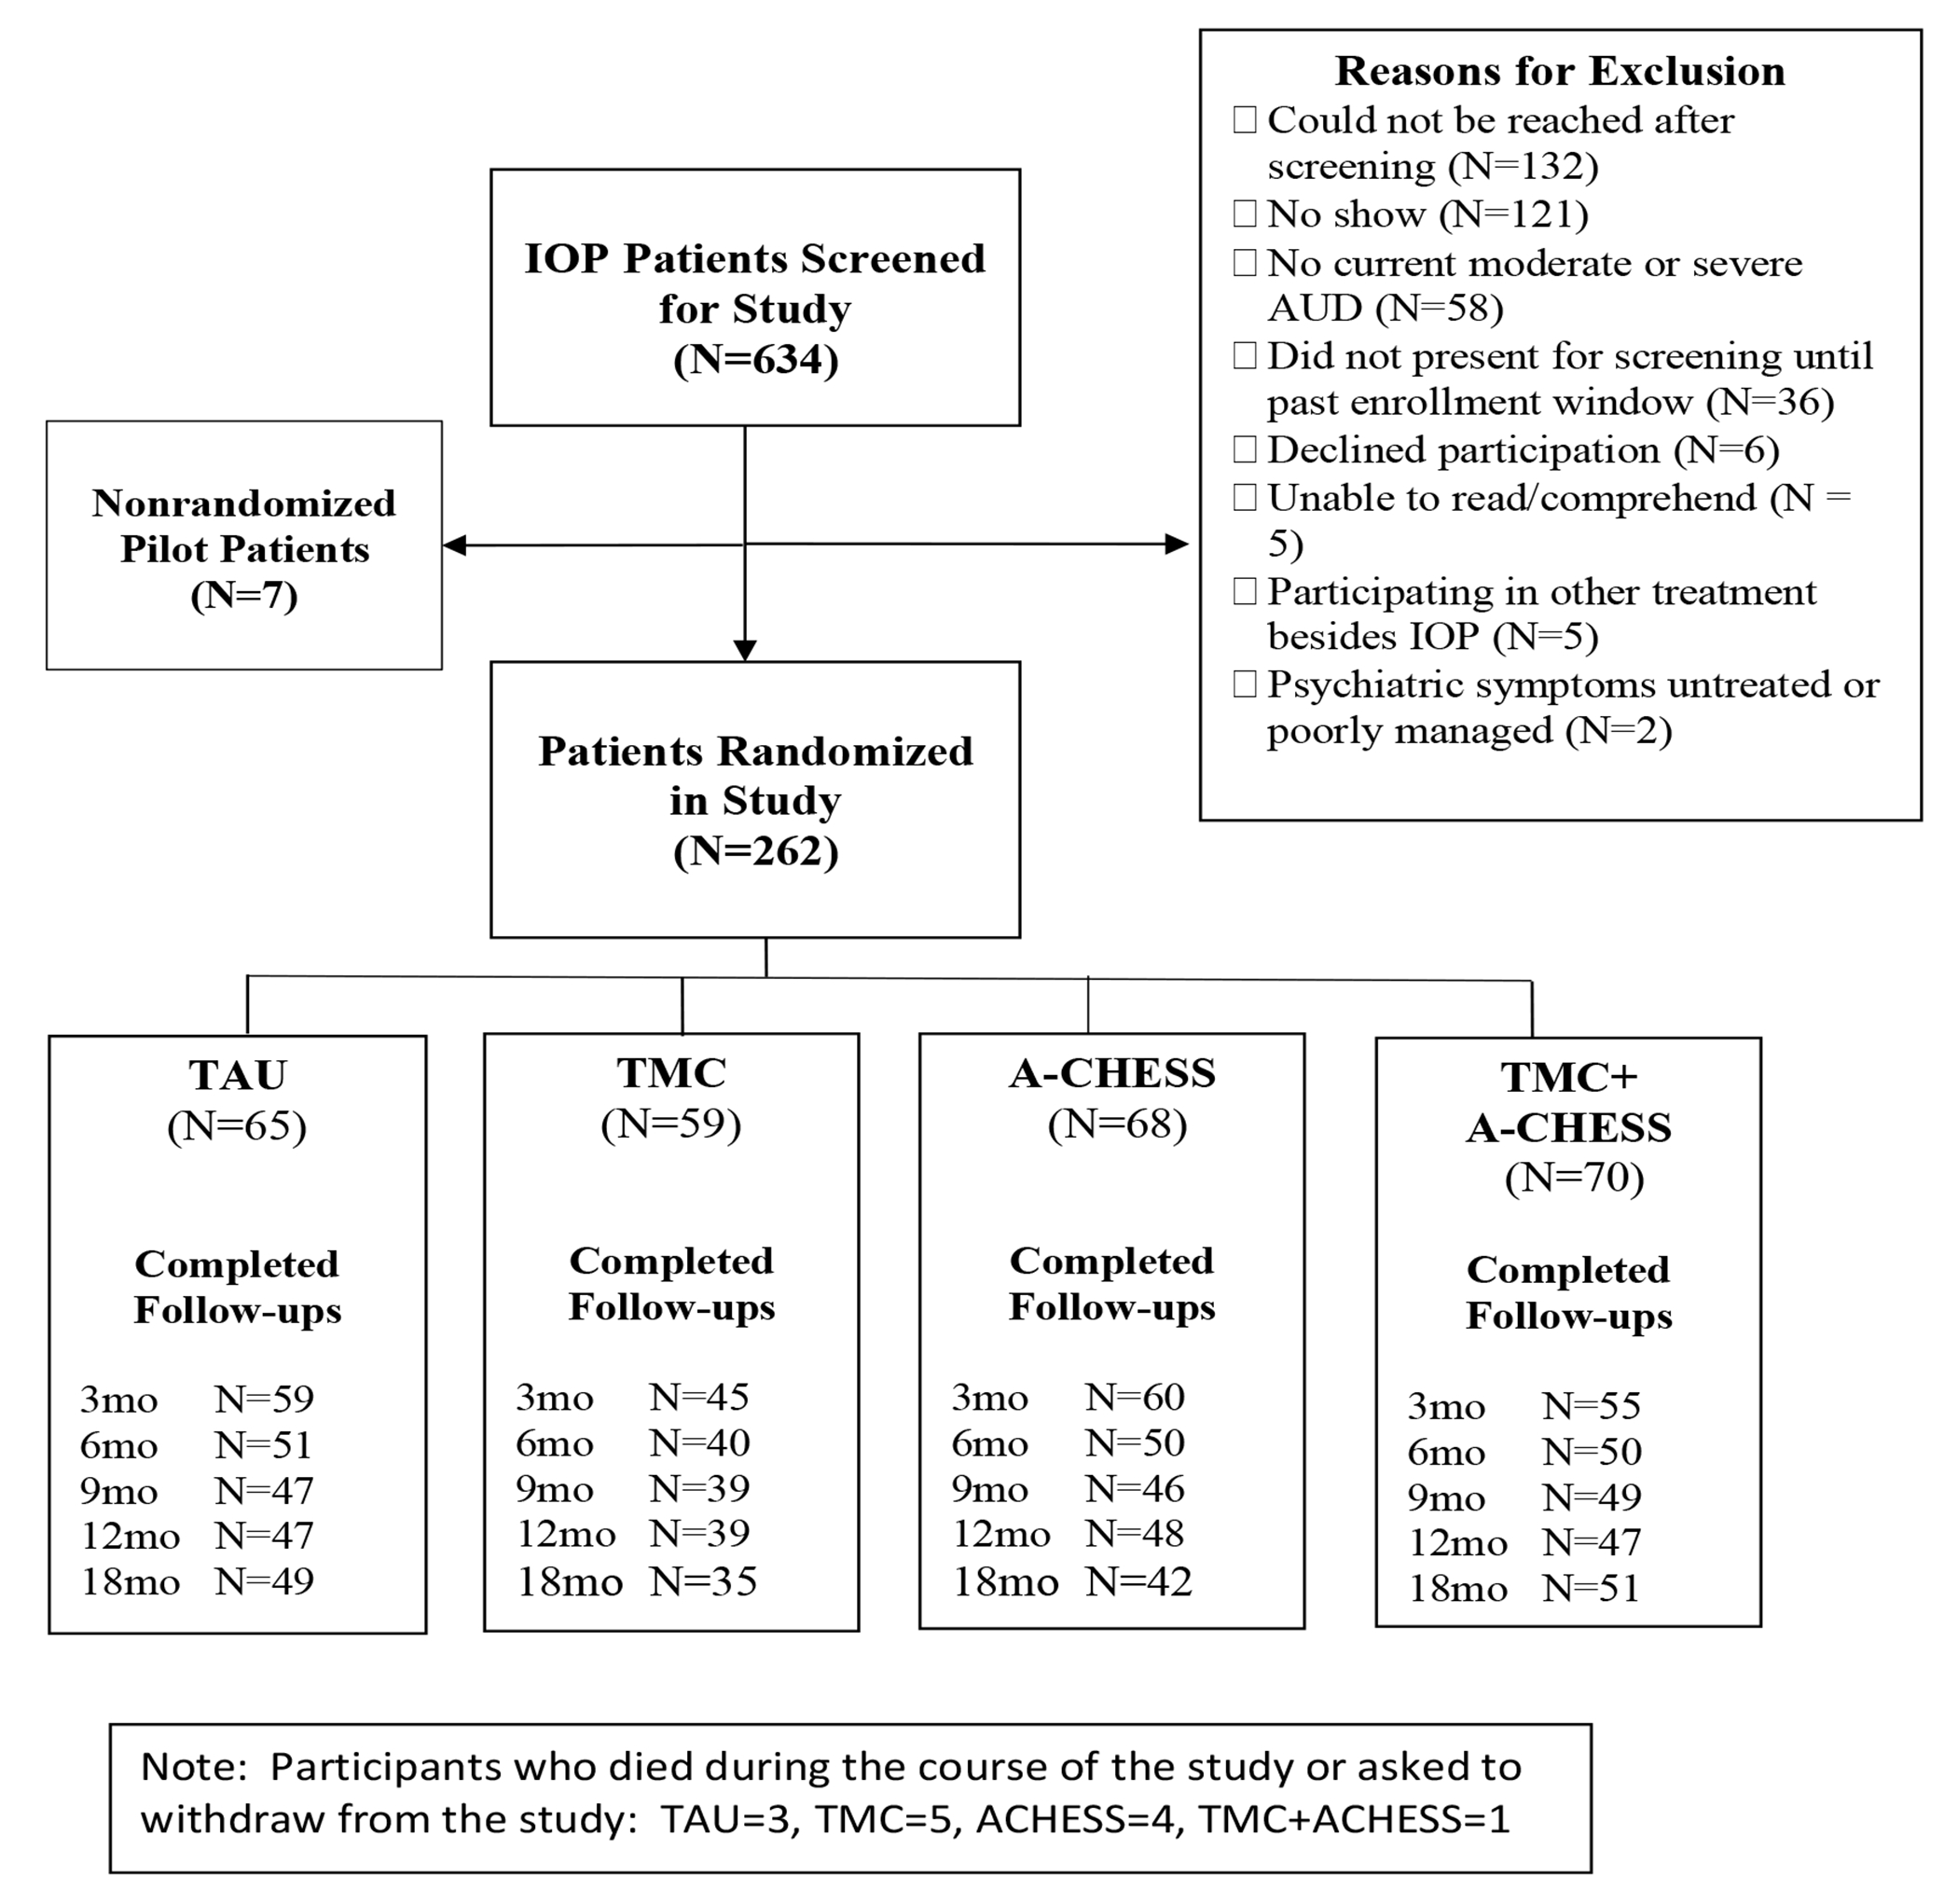
Consort Diagram
Participants were on average 46.9 (sd= 7.4) years old with 11.6 (sd= 1.8) years of education. The majority were male (71%), African American (82%), and never married (67%). Current co-occurring disorders included cocaine (39%), anxiety (35.0%), and major depression (26%). Participants used alcohol on 45.0% (sd=30.7) of the days in the three months prior to baseline (i.e., 39.6 days, sd= 25.8), which included 3-4 weeks of IOP (See Table 1).
Table 1:
Characteristics of Participants at Baseline
| Total (n=262) |
TAU (n=65) |
TMC Only (n=59) |
ACHESS only (n=68) |
TMC + ACHESS (n=70) |
||||||
|---|---|---|---|---|---|---|---|---|---|---|
| Variable | M/% | SD | M/% | SD | M/% | SD | M/% | SD | M/% | SD |
| Age | 46.90 | 10.08 | 46.70 | 9.93 | 46.07 | 10.15 | 48.00 | 9.21 | 46.72 | 11.03 |
| Male (%) | 70.61 | 45.64 | 67.69 | 47.13 | 67.80 | 47.13 | 77.94 | 41.77 | 68.57 | 46.76 |
| Never Married (%) | 66.79 | 47.19 | 70.77 | 45.84 | 64.41 | 48.29 | 66.18 | 47.66 | 65.71 | 47.81 |
| African-American (%) | 82.44 | 38.12 | 81.54 | 39.10 | 83.05 | 37.84 | 86.76 | 34.14 | 78.57 | 41.33 |
| High School Educ (%) | 70.61 | 45.64 | 66.15 | 47.69 | 72.88 | 44.84 | 67.65 | 47.13 | 75.71 | 43.19 |
| Cocaine use disorder (%) | 42.25 | 49.49 | 38.46 | 49.03 | 37.29 | 48.77 | 53.85 | 50.24 | 39.13 | 49.16 |
| Cannabis use disorder (%) | 29.62 | 45.74 | 32.31 | 47.13 | 25.42 | 43.92 | 29.41 | 45.90 | 30.88 | 46.54 |
| Current Major Dep Dx (%) | 26.34 | 44.13 | 29.23 | 45.84 | 32.20 | 47.13 | 19.12 | 39.62 | 25.71 | 44.02 |
| Current Anxiety Dx (%) | 35.50 | 47.94 | 33.85 | 47.69 | 35.59 | 48.29 | 33.82 | 47.66 | 38.57 | 49.03 |
| PHQ-9 Total Scorea | 11.25 | 6.84 | 11.08 | 5.96 | 10.76 | 7.18 | 10.32 | 7.09 | 12.71 | 6.99 |
| Years regular alcohol use | 23.09 | 11.64 | 21.43 | 10.85 | 22.69 | 10.62 | 25.09 | 11.72 | 23.03 | 12.99 |
| Number prior alcohol txs | 3.57 | 4.01 | 3.85 | 4.38 | 2.67 | 2.46 | 3.75 | 3.91 | 3.90 | 4.70 |
| TLFB % Days Drinkingb | 44.00 | 28.62 | 41.35 | 29.40 | 45.34 | 28.52 | 46.36 | 28.59 | 46.86 | 30.45 |
| TLFB % Days Heavy Drnk | 38.14 | 29.00 | 34.46 | 29.65 | 37.84 | 28.83 | 42.09 | 27.97 | 40.08 | 30.44 |
| TLFB % Days Cocaine | 10.84 | 19.21 | 7.90 | 16.16 | 10.90 | 21.10 | 15.10 | 23.63 | 10.29 | 17.13 |
| SIP-R Total Scorec | 11.81 | 3.75 | 11.35 | 3.88 | 11.47 | 3.69 | 11.96 | 4.00 | 12.36 | 3.43 |
| SF-12 MH Scored | 62.93 | 33.65 | 57.69 | 34.21 | 70.69 | 31.81 | 62.50 | 34.69 | 61.79 | 33.17 |
| SF-12 PH Scored | 52.54 | 22.47 | 50.58 | 23.43 | 53.88 | 22.73 | 55.33 | 19.35 | 50.54 | 24.21 |
Patient Health Questionnaire. Higher scores indicated greater depression
Time-Line Follow-Back. Higher scores indicate more frequent alcohol or drug use
Short Inventory of Problems. Higher scores indicate more negative consequences for drinking
Short Form Survey Mental Health and Physical Health. Higher scores indicate better mental or physical health
Interested patients were referred to research technicians, who obtained informed consent to collect eligibility screening information. Patients were given appointments for the baseline assessment after three weeks of IOP. Patients who chose to not participate in the study continued to receive treatment as usual. At the baseline assessment, patients signed a second informed consent after passing an informed consent quiz that demonstrated an understanding of the study. Patients then completed the remainder of the baseline assessments and were randomly assigned to one of the four treatment conditions [22].
Interventions
All participants received IOP, which provided 9 hours of group counseling per week for up to 3 months, plus up to 3 months of weekly continuing care. Treatment was based on 12-step principles. In publicly funded SUD treatment programs in Philadelphia, patients often start treatment at the IOP level, due to the chronic nature of their alcohol or drug problems, high rates of psychiatric comorbidity, and lack of social support and structure in their lives.
TMC.
Participants had one face-to-face session to develop rapport with counselors. Telephone calls occurred weekly in month 1, twice monthly in months 2-4, monthly in months 5-7, and every other month in months 8-12 (i.e., 16 possible calls). Each call lasted 15-30 minutes. At the beginning of each call, participants completed a brief assessment of substance use and risk and protective factors. CBT-based counseling was linked to the results of that assessment and addressed anticipated risky situations. Potential coping strategies and behaviors were rehearsed, and reinforcement of positive behaviors and encouragement for involvement in pro-recovery activities were provided. Participants without reliable access to a telephone were given a mobile phone (i.e., not a smart phone) [22,23].
ACHESS.
Participants were provided with a smart phone, data plan, and ACHESS for 12 months. Technicians trained participants to use ACHESS. Protocols programmed into the smartphone defined what happened when participants entered high risk situations or pressed the panic button to alert supports. Following 7 days of inactivity, ACHESS sent a message to participants and alerted ACHESS support staff, who encouraged use of ACHESS via SMS. Technical support for ACHESS operation was available via phone.
ACHESS collected information on confidence for maintaining abstinence (daily) and on 10 risk and protective factors (weekly). When data indicated relapse risk was high, participants were encouraged via text messages to seek additional support. ACHESS offered relaxation exercises, games for distraction, connections to online peer support, access to audio and written information on addiction, web links, GPS driven information on self-help meetings, and inspirational messages [9,22].
TMC+ACHESS.
TMC and ACHESS were provided as described above. In addition, when participants reported worrisome information on ACHESS, alerts were sent directly to counselors. A graph with current and past assessment scores could be seen by counselors in the clinician dashboard [22]. These features were intended to facilitate faster outreach to patients when risk increased.
Treatment as Usual (TAU).
Participants who completed IOP where eligible to receive weekly clinic-based continuing care for 2-3 months.
Therapists.
Eight therapists with 2 to 25 years of experience treating substance use disorders delivered TMC and TMC+ACHESS. Six therapists were employed by the three participating IOPs (N= 56 patients) and two therapists were Penn staff (N=73 patients). Supervision was provided by the senior level Penn therapist.
Measures
The Structured Clinical Interview for DSM-IV (SCID) [24] and MINI [25] determined DSM-IV substance use disorders and other psychiatric diagnoses, respectively. The Addiction Severity Index (ASI) [26] obtained demographics, alcohol and drug use, and treatment history at baseline. The Time-Line Follow-Back (TLFB) [27] assessed frequency of alcohol, heavy alcohol, and cocaine use. The reliability and validity of the TLFB has been repeatedly demonstrated [28–30]. The Short Inventory of Problems (SIP) [31] assessed negative consequences of alcohol use. Quality of life was obtained with the Short Form Survey (SF-12) [32]. Urine toxicology assessed other drug use (e.g., cocaine, amphetamines, opiates, barbiturates, benzodiazepines, and THC). The TLFB, ASI, SIP, SF-12, and urine toxicology were obtained at baseline and 3, 6, 9, 12, and 18 month follow-ups. %dCDT [33] provided a biological measure of heavy drinking over the past few months at baseline and 18 months.
The primary outcome measure was percent days of heavy drinking (PDHD; i.e., ≥5 drinks/day for men, ≥4 drinks/day for women) during the 12 month treatment phase. PDHD has been identified as the optimal measure of alcohol treatment outcome [34]. Secondary outcomes were: PDHD at 18 months; and any alcohol use within a given follow-up period (yes/no), any drug use within a given follow-up period (yes/no, as determined by self-report measures and urine drug screens), alcohol use related negative consequences (SIP), and quality of life (SF-12) during months 3, 6, 9, and 12, and at 18 months. These measures were selected to provide a fuller picture of overall substance use severity and health outcome.
Data Analyses
TLFB data on PDHD were aggregated into a 3-month pretreatment-baseline period, and five 3-month periods post-randomization (Months 1-3, 4-6, 7-9, 11-12, 16-18). Urine toxicology and ASI drug use self-reports were obtained at baseline and 3, 6, 9, 12, and 18 months, and were combined with TLFB to create a secondary outcome indicating absence or presence of drug use.
For the primary outcome of PDHD during the treatment phase, mixed effects models were used to compare treatment conditions [35]. PDHD was square-root transformed because of high levels of positive skewness. All models included the stratification variables (e.g., a four-level categorical variable for site, binary variables for gender and baseline drug use), a four-level categorical variable for treatment group, and a centered version of the square-root transformed baseline PDHD variable as a baseline covariate. Pairwise contrasts were used to compare the treatment conditions, with the primary comparisons of each intervention with TAU unadjusted for multiplicity (i.e. tested at the 5% level), and the other three comparisons tested at adjusted levels (p< .017).
Secondary outcomes for the treatment phase were analyzed in a similar way, using linear mixed effects models for the SIP and SF12 Mental Health and Physical Functioning scales, and mixed effects logistic regression models for the binary responses of Any Drinking and Any Drug Use. Baseline version of the outcome was included as a covariate, except for Any Drinking, for which baseline percent days drinking was used. Secondary analyses were not adjusted for multiplicity [36].
For the secondary analyses of the outcomes at the 18-month time point, linear and logistic regression models were used, again with baseline versions of outcomes included as covariates, using robust standard errors. In addition, %dCDT at baseline and 18 months was compared in participants reporting none vs. any heavy drinking in the prior month to provide confirmation of self-reported TLFB drinking data.
Missing data in longitudinal studies are classified in three ways [37]: Missing completely at random (MCAR), indicating that missing values are statistically independent of any other variables, observed or unobserved; missing at random (MAR), where the missing values may depend on observed variables (baseline and available longitudinal variables); and not missing at random (NMAR), where missing values may depend on unobserved data. The mixed effects models described above give valid estimates under MAR, while generalized estimating equation (GEE) models give valid estimates under MCAR. To examine sensitivity of the primary analyses to missing data, GEE models were also used to compare the groups. In addition, a pattern-mixture analysis [37–38] was also performed, using time to dropout as a categorical indicator of missing data pattern, to provide results under one type of a not missing at random (NMAR) assumption.
To evaluate the sensitivity of the results to random imbalances of the distributions of prognostic variables across the treatment groups, further analyses were performed for the treatment phase. For each outcome, the variables listed in Table 1 were evaluated as predictors and were included as covariates in the mixed effects models described above if they were significant at the 5% level.
Methods of Hedeker et al. [39] were used to determine sample size. Based on previous studies in these populations [7,8,11], we assumed 25% loss to follow up between baseline and month 18, with approximately equal rates of dropout across the treatment groups, and a within-subject correlation of approximately r=0.35. The baseline sample of 262 then provided 80% power, at a 5% significance level, for an effect size of Cohen’s d=0.35 for the primary pairwise comparisons on the three intervention groups to the TAU group.
Results
Participation in TMC and A-CHESS
Mean number of telephone sessions was 8.1 in TMC and 10.7 in TMC+ACHESS. In participants who completed the orientation session, means were 10.2 in TMC (N= 43) and 11.00 in TMC+ACHESS (N=60). In ACHESS the system was used an average of 20 days per month in months 1 and 2 and declined thereafter to around 14 days per month. In TMC+ACHESS, the system was used 16 days per month in months 1 and 2 and declined thereafter to around 10 days per month.
During Treatment Outcomes
Primary outcome.
A total of 771 follow-ups were made at months 3, 6, 9, and 12 (73.57% of the planned 1048 follow-ups). For the four treatment conditions, the average number of follow-ups (out of four) was 3.12 (SD=1.31) for TAU, 2.76 (SD=1.61) for TMC, 2.99 (SD=1.42) for ACHESS, and 2.98 (SD=1.44) for TMC+ACHESS. An overdispersed Poisson regression model showed no significant effect of treatment condition on the number of follow-ups made (x2(3)=2.11, p=0.55), or significant pairwise differences between the conditions (p-values > 0.18).
Mean PDHD in months 1-12 was 10.29 (SE=1.79) in TAU, 5.41 (SE=1.68) in TMC, 6.80 (SE=1.95) in ACHESS, and 5.99 (SE=1.35) in TMC+ACHESS (see Figure 2, Table 2). Table 3 shows the model-based estimates for pairwise contrasts between the interventions during the 12-month treatment period, together with effect size estimates, under the three sets of missing data assumptions. For the MAR analyses, the group by time interaction was not significant (F(534)=0.80, p=0.50), so the effects are for treatment pooled over time. There was a significant overall effect of treatment condition on levels of PDHD during the treatment phase (F(3,537)=2.95, p=0.03). PDHD was lower in TMC (d=.35, p=0.018), ACHESS (d= .31, p= .031), and TMC+ACHESS (d= .36, p=0.009]) than in TAU. There were no significant differences between the three intervention groups during treatment, with effect sizes of d ≤ 0.06.
Figure 2:

Percent Days Heavy Drinking (PDHD) in each treatment condition at Baseline and 3, 6, 9, 12, and 18 month follow-ups
NOTE: SEs at Month 0 range from 3.32 to 3.75, and from 1.32 to 3.76 for the other months
Table 2:
Primary and Secondary Outcomes at All Follow-ups
| Months 1-12 |
Month | ||||||
|---|---|---|---|---|---|---|---|
| Response | Group | 3 | 6 | 9 | 12 | 18 | |
| (M/SE) | (M/SE) | (M/SE) | (M/SE) | (M/SE) | (M/SE) | ||
| Primary | |||||||
| PDHDa | TAU | 10.29 (1.79) | 12.92 (3.08) | 11.59 (2.63) | 7.56 (2.47) | 11.62 (3.48) | 8.10 (2.74) |
| TMC | 5.41 (1.68) | 6.15 (2.16) | 6.40 (2.35) | 2.68 (1.58) | 4.72 (1.74) | 9.97 (3.33) | |
| ACH | 6.80 (1.95) | 4.65 (1.85) | 11.32 (3.31) | 3.09 (1.32) | 5.55 (1.90) | 8.79 (3.76) | |
| TMC+ACH | 5.99 (1.35) | 5.43 (1.92) | 5.65 (2.22) | 4.15 (1.42) | 6.03 (2.20) | 5.49 (1.79) | |
| Secondary | |||||||
| Any Alcoholb | TAU | 59.32 (6.45) | 56.86 (7.00) | 59.35 (7.43) | 63.83 (7.08) | 51.02 (7.22) | |
| TMC | 37.78 (7.31) | 42.50 (7.92) | 35.90 (7.78) | 46.15 (8.09) | 50.00 (8.70) | ||
| ACH | 54.24 (6.54) | 50.00 (7.14) | 43.48 (7.39) | 47.92 (7.29) | 44.19 (7.66) | ||
| TMC+ACH | 43.64 (6.75) | 44.00 (7.09) | 42.00 (7.05) | 53.19 (7.36) | 43.14 (7.00) | ||
| Drug Usec | TAU | 57.63 (6.49) | 58.82 (6.96) | 52.17 (7.45) | 68.09 (6.87) | 65.31 (6.87) | |
| TMC | 51.11 (7.54) | 60.00 (7.84) | 53.85 (8.09) | 61.54 (7.89) | 61.76 (8.46) | ||
| ACH | 52.54 (6.56) | 58.00 (7.05) | 60.87 (7.28) | 54.17 (7.27) | 55.81 (7.56) | ||
| TMC+ACH | 45.45 (6.78) | 52.00 (7.34) | 56.00 (7.09) | 44.68 (7.33) | 49.02 (7.07) | ||
| SIP Totald | TAU | 16.12 (1.95) | 13.63 (2.00) | 9.91 (1.72) | 12.55 (2.01) | 12.58 )1.98) | |
| TMC | 13.24 (2.01) | 12.45 (2.57) | 6.38 (1.83) | 10.46 (2.37) | 13.00 (2.70) | ||
| ACH | 11.95 (1.85) | 11.78 (1.95) | 11.17 (1.82) | 10.04 (1.91) | 12.30 (2.27) | ||
| TMC+ACH | 11.98 (1.90) | 13.04 (2.14) | 10.28 (1.89) | 12.15 (2.24) | 12.69 (2.09) | ||
| SF-12 MHe | TAU | 64.83 (2.73) | 62.50 (3.34) | 63.59 (3.58) | 65.96 (3.26) | 67.75 (3.16) | |
| TMC | 59.17 (3.47) | 64.38 (3.81) | 60.58 (3.66) | 61.22 (3.78) | 61.43 (4.39) | ||
| ACH | 58.69 (2.85) | 64.75 (2.74) | 62.50 (3.25) | 63.80 (3.19) | 64.49 (3.33) | ||
| TMC+ACH | 60.45 (2.84) | 58.00 (3.00) | 61.50 (3.59) | 60.11 (4.03) | 61.76 (3.44) | ||
| SF-12 PHe | TAU | 60.17 (4.65) | 58.33 (5.32) | 65.22 (4.94) | 63.83 (5.26) | 65.50 (4.51) | |
| TMC | 67.78 (4.54) | 62.50 (6.00) | 66.67 (4.80) | 64.10 (4.64) | 73.57 (4.69) | ||
| ACH | 61.44 (4.50) | 61.00 (4.75) | 62.50 (4.71) | 64.58 (4.76) | 63.64 (5.17) | ||
| TMC+ACH | 56.82 (5.00) | 59.50 (5.24) | 59.00 (5.48) | 57.98 (5.38) | 67.65 (4.71) | ||
Percent days heavy drinking (≥5 drinks/day for men, ≥4 drinks/day for women). Primary outcome months 1-12; secondary outcome month 18
Percent of participants with any alcohol use
Percent of participants with any indication of use of cocaine, amphetamines, opiates, barbiturates, benzodiazepines, or THC from urine toxicology or self-report (1=positive, 0= negative)
Short Inventory of Problems. Higher scores indicate more negative consequences for drinking
Short Form Survey. Higher scores indicate better mental health (MH) or physical health (PH)
Table 3:
Treatment contrasts on Primary Outcome: PDHD Months 1-12
| Mixed Effects MAR Analysis |
Pattern Mixture NMAR Analysis |
GEE MCAR Analysis |
|||||
|---|---|---|---|---|---|---|---|
| Contrast | Estimate (95% CI) |
P-value | Cohen’s d | Estimate (95% CI) |
P-value | Estimate (CI 95%) |
P-value |
| TAU - TMC | 0.78 (0.13, 1.43) |
0.018 | 0.35 | 0.82 (0.17 1.47) |
0.013 | 0.78 (0.13 1.43) |
0.017 |
| TAU - ACHESS | 0.67 (0.06, 1.28) |
0.031 | 0.31 | 0.69 (0.08 1.30) |
0.027 | 0.67 (0.04 1.30) |
0.038 |
| TAU – TMC+ACH | 0.80 (0.19, 1.41) |
0.009 | 0.36 | 0.83 (0.22 1.44) |
0.007 | 0.80 (0.19 1.41) |
0.009 |
| TMC - ACHESS | −0.11 (−0.76, 0.54) |
0.732 | −0.04 | −0.14 (−0.79 0.51) |
0.676 | −0.11 (−0.72 0.50) |
0.717 |
| TMC – TMC+ACH | 0.02 (−0.63, 0.67) |
0.947 | 0.02 | 0.01 (−0.64 0.66) |
0.977 | 0.02 (−0.55 0.59) |
0.939 |
| ACHESS – TMC+ACH | 0.13 (−0.48, 0.74) |
0.661 | 0.06 | 0.15 (−0.46 0.76) |
0.631 | 0.13 (−0.44 0.70) |
0.645 |
Treatment contrast analyses controlled for recruitment site, gender, any drug use at baseline, and baseline PDHD
PDHD: Percent Days Heavy Drinking
In the pattern-mixture mixed-effects model, the interaction between the group and pattern variables was not significant (F(6,538)=1.18, p=0.31), while there was a significant overall effect for treatment (F(3,538)=3.14,p=0.02), and a similar pattern of pairwise contrasts. For the GEE model under an MCAR assumption, the overall treatment effect was not significant (Chi-square (3)=7.45, p=0.059), while the pairwise comparisons again showed the same pattern of significant results observed for the MAR and NMAR analyses. As the results under the three assumptions were very similar, it appears that missing data did not greatly influence the primary treatment comparisons.
Supplementary Table 5 shows the pairwise comparisons when predictive baseline variables (e.g., years of alcohol use, and percent days abstinence from alcohol and cocaine use) were included in these analyses. The pattern is similar to that of the main analyses, with the only difference being that the ACHESS vs. TAU comparison is no longer significant (p= 0.057 to 0.067 across models).
Secondary Outcomes.
There was a significant treatment effect on Any Drinking (F(3, 538)=2.65. p=0.048), which was higher in TAU than in TMC (OR= 3.02, SE=0.43, 95% CI= [1.30, 6.99], p=0.01) and TMC+ACHESS (OR= 2.43, SE=0.39, 95% CI= [1.12, 5.27], p=0.03), with non-significant results in the same direction for ACHESS (OR= 1.90, SE=0.40, 95% CI= [0.87, 4.14), p=0.38]. There were no significant treatment effects for the Overall Drug Use (F(3,538)=0.45, p=0.72), SIP Total (F(3,537)=0.35, p=0.79), SF-12MH (F(3,535)=0.79, p=0.50) or SF-12PH (F(3,535)=0.88, p=0.45) measures, and no pairwise differences among treatment levels (see Tables 2 and 4).
Table 4:
Treatment contrasts for all secondary outcomes
| Treatment Outcomes (Months 1-12) |
Follow-up Outcomes (Month 18) |
||||||
|---|---|---|---|---|---|---|---|
| Outcome | Contrast | Estimate | 95% CI | P-value | Estimate | 95% CI | P-value |
| Square-root PDHDa | TAU - TMC | -- | -- | -- | −0.32 | (−1.46, 0.82) | 0.576 |
| TAU - ACHESS | -- | -- | -- | 0.16 | (−0.86, 1.18) | 0.764 | |
| TAU – TMC+ACH | -- | -- | -- | 0.37 | (−0.55, 1.29) | 0.434 | |
| TMC - ACHESS | -- | -- | -- | 0.48 | (−0.66, 1.62) | 0.405 | |
| TMC – TMC+ACH | -- | -- | -- | 0.69 | (−0.33, 1.71) | 0.187 | |
| ACHESS – TMC+ACH | -- | -- | -- | 0.21 | (−0.73, 1.15) | 0.663 | |
| Any Drinkingb | TAU - TMC | 1.10 | (0.26, 1.94) | 0.010 | −0.17 | (−1.09, 0.75) | 0.715 |
| TAU - ACHESS | 0.64 | (−0.14, 1.42) | 0.108 | −0.48 | (−1.36, 0.40) | 0.291 | |
| TAU – TMC+ACH | 0.89 | (0.13, 1.65) | 0.025 | −0.48 | (−1.34, 0.38) | 0.275 | |
| TMC - ACHESS | −0.46 | (−1.30, 0.38) | 0.276 | −0.31 | (−1.25, 0.63) | 0.520 | |
| TMC – TMC+ACH | −0.22 | (−1.04, 0.60) | 0.607 | −0.31 | (−1.21, 0.59) | 0.500 | |
| ACHESS – TMC+ACH | 0.25 | (−0.51, 1.01) | 0.526 | −0.00 | (−0.88, 0.88) | 0.996 | |
| Drug Usec | TAU - TMC | −0.03 | (−0.87, 0.81) | 0.938 | 0.23 | (−0.75, 1.21) | 0.653 |
| TAU - ACHESS | 0.20 | (−0.58, 0.98) | 0.610 | −0.44 | (−1.36, 0.48) | 0.347 | |
| TAU – TMC+ACH | 0.38 | (−0.40, 1.16) | 0.340 | −0.48 | (−1.34, 0.38) | 0.281 | |
| TMC - ACHESS | 0.24 | (−0.58, 1.06) | 0.573 | −0.67 | (−1.69, 0.35) | 0.200 | |
| TMC – TMC+ACH | 0.42 | (−0.40, 1.24) | 0.321 | −0.70 | (−1.66, 0.26) | 0.152 | |
| ACHESS – TMC+ACH | 0.18 | (−0.60, 0.96) | 0.651 | −0.03 | (−0.95, 0.89) | 0.945 | |
| SIP-R Totald | TAU - TMC | 1.82 | (−2.16, 5.80) | 0.370 | −1.37 | (−7.49, 4.75) | 0.661 |
| TAU - ACHESS | 1.59 | (−2.13, 5.31) | 0.403 | 1.24 | (−4.66, 7.14) | 0.681 | |
| TAU – TMC+ACH | 1.35 | (−2.37, 5.07) | 0.478 | 0.42 | (−5.17, 6.01) | 0.882 | |
| TMC - ACHESS | −0.23 | (−4.21, 3.75) | 0.910 | 2.61 | (−4.23, 9.45) | 0.454 | |
| TMC – TMC+ACH | −0.47 | (−4.41, 3.47) | 0.816 | 1.79 | (−4.56, 8.14) | 0.581 | |
| ACHESS – TMC+ACH | −0.24 | (−3.96, 3.48) | 0.900 | −0.82 | (−6.94, 5.30) | 0.793 | |
| SF12 MHe | TAU - TMC | 4.31 | (−1.84, 10.46) | 0.170 | 8.62 | (−1.30, 18.54) | 0.088 |
| TAU - ACHESS | 2.95 | (−2.75, 8.65) | 0.313 | 3.84 | (−4.90, 12.58) | 0.389 | |
| TAU – TMC+ACH | 3.58 | (−2.10, 9.26) | 0.217 | 5.95 | (−3.03, 14.93) | 0.194 | |
| TMC - ACHESS | −1.36 | (−7.48, 4.76) | 0.663 | −4.78 | (−14.72, 5.16) | 0.347 | |
| TMC – TMC+ACH | −0.73 | (−6.83, 5.37) | 0.816 | −2.67 | (−12.63, 7.29) | 0.598 | |
| ACHESS – TMC+ACH | 0.64 | (−5.08, 6.36) | 0.827 | 2.10 | (−7.13, 11.33) | 0.656 | |
| SF12 PHe | TAU - TMC | 2.93 | (−5.95, 11.81) | 0.518 | −4.04 | (−16.68, 8.60) | 0.531 |
| TAU - ACHESS | −0.61 | (−8.82, 7.60) | 0.885 | 1.62 | (−10.10, 13.34) | 0.786 | |
| TAU – TMC+ACH | 5.45 | (−2.74, 13.64) | 0.193 | −1.72 | (−12.52, 9.08) | 0.755 | |
| TMC - ACHESS | −3.54 | (−12.40, 5.32) | 0.434 | 5.67 | (−7.72, 19.06) | 0.407 | |
| TMC – TMC+ACH | 2.51 | (−6.25, 11.27) | 0.574 | 2.32 | (−9.93, 14.57) | 0.710 | |
| ACHESS – TMC+ACH | 6.05 | (−2.14, 14.24) | 0.148 | −3.35 | (−15.09, 8.39) | 0.576 | |
Analyses controlled for recruitment site, gender, any drug use at baseline, and the baseline version of the outcome variable (except PDHD was used for Any Drinking). The two binary outcomes, Any Drinking and Any Drug Use, have log-odds-ratios (LOR) in the Estimates column.
Percent days heavy drinking (≥5 drinks/day for men, ≥4 drinks/day for women). Primary outcome months 1-12; secondary outcome month 18
Percent of participants with any alcohol use
Percent of participants with any indication of use of cocaine, amphetamines, opiates, barbiturates, benzodiazepines, or THC from urine toxicology or self-report (1=positive, 0= negative)
Short Inventory of Problems. Higher scores indicate more negative consequences for drinking
Short Form Survey. Higher scores indicate better mental health (MH) or physical health (PH)
Post-Treatment Secondary Outcomes
There were no significant differences between the treatment conditions on PDHD (GEE x2(3)=1.86, p=0.60), Any Drinking (x2(3)=1.72, p=0.63), Any Drug Use (x 2(3)=3.00, p=0.39), SIP (x2(3)=0.58, p=0.90), SF-12MH (x2(3)=3.14, p=0.37), or SF-12PH (x 2(3)=0.75, p=0.86) at 18 months (see Table 2 and pairwise comparisons in Table 4).
Confirmation of Self-reported Alcohol Use Data
Participants who reported any heavy drinking in month 18 had higher %dCDT scores than those who reported no heavy drinking in that month (Heavy drinking: n=34, m=1.97, sd=1.30 vs. No heavy drinking: n=79, m=1.40, sd=0.53: 95% CI = [−0.91, −0.23], p=0.001). The same pattern was observed at baseline (Heavy drinking: n=118, m=1.75, sd=1.28 vs. No heavy drinking: n=84, m=1.42, sd=0.81: 95% CI = [−0.64, −0.02}, p=0.027). Therefore, the pattern of results with the %dCDT data support the validity of the TLFB data.
Other Analyses
Analyses comparing the two Penn and six IOP counselors found no difference on PDHD (x2(1)=0.12, p=0.72). The treatment conditions did not differ at any follow-up on participation in 12-step programs (all p> 0.42).
Discussion
In the management of alcohol use disorder, it is crucial that effective recovery support services are available that can be provided remotely to individuals who are unable to attend clinic-based care. Effective remote services are even more essential during crises such as the COVID-19 pandemic [2–5]. This study confirmed prior research [7–9] that found that TMC and ACHESS improved alcohol use outcomes when added to treatment as usual. In addition, this study was the first to compare these two approaches, and the first to determine whether an integrated package that combined both interventions improved outcomes over either intervention alone. Therefore, the study focused both on efficacy and comparative effectiveness.
With regard to efficacy, TMC, ACHESS, and TMC+ACHESS produced lower scores on the primary outcome, frequency of heavy drinking days (PDHD), than TAU. An examination of the data from Figure 2, indicates that PDHD increased in TMC and ACHESS after the 12 month treatment period. This erosion of treatment effects after TMC ended has been observed in one prior trial [8] but not in others [7,11]. TMC and TMC+ACHESS were also superior to TAU on one of the secondary outcomes, any alcohol use, during the treatment phase. However, there were no effects on the other secondary outcome measures either during treatment or at 18 months. With regard to comparative effectiveness, the differences between the three continuing care interventions were small in magnitude (d≤ 0.06), and did not approach significance, either during or after treatment. Given these very small effect sizes, the lack of significant differences between the three experimental conditions is likely not due to insufficient power to find clinically meaningful differences.
These findings raise the intriguing possibility that extended continuing care for AUD provided via a smartphone program may be as efficacious as continuing care delivered by counselors via telephone sessions. However, it should be noted that in this and other studies [9], the provision of ACHESS has included monitoring by trained personnel of substance use and other data produced by the system, with SMS based outreach to users when warranted. Therefore, ACHESS is not entirely without a human component. In addition, TMC produced lower rates of any drinking compared to TAU, whereas ACHESS did not. The results also raise the question of whether providing TMC or ACHESS over longer periods might sustain positive effects.
There are several possible explanations for why TMC+ACHESS was not more effective than either intervention alone. Given the efficacy of each intervention, ceiling effects may have been present. Counselors may not have utilized the information provided in the dashboard to speed up responses to participants who were struggling. The information generated by ACHESS may not have captured relapse vulnerability, due to missing data or inaccurate reports. Although the interventions presumably have different mechanisms of action, combining them may not have the additive or synergistic effect that was anticipated.
The study had important strengths, including interventions shown to be efficacious in prior research, a strong active control condition, appropriate sample size, well-validated outcome measures, multiple follow-ups over 18 months, biological corroboration of self-reports of alcohol use, and analyses demonstrating minimal if any impact of missing data. At the same time, the study had limitations. Over 80% of participants were African American, which is representative of clients in treatment for substance use disorders in publicly funded programs in Philadelphia, USA, but not outside of major urban areas. While there is no reason to believe that these effects would not generalize to other IOP patients, different findings might be obtained in patients who had not attended IOP for several weeks. Significant effects were found only on the heavy drinking primary outcome and one secondary, any drinking, and were moderate in size. However, reductions in heavy drinking days are seen as a key goal of treatment for alcohol use disorder [34,40], and the control condition was strong—a full course of IOP plus standard clinic-based continuing care. Biological measures of drinking outcome were obtained only at the 18-month follow-up. Finally, it was not possible to fully blind the study personnel conducting follow-ups to treatment condition.
Conclusion
Adding TMC, ACHESS, and the combination of TMC and ACHESS to intensive outpatient treatment reduced heavy drinking by approximately 50% over 12 months, while the interventions were provided, with positive effects deteriorating over the following six months in TMC and ACHESS but not TMC+ACHESS. However, the combined intervention was not more effective than either TMC or ACHESS alone.
Supplementary Material
Footnotes
Declarations of competing interests: Drs. Gustafson and Quanbeck have shareholder interest in CHESS Health, a public benefit corporation that disseminates technology-based health care interventions for patients and family members struggling with addiction. This relationship is extensively managed by the author and the University of Wisconsin–Madison’s Conflict of Interest Committee. No other disclosures were reported.
Clinical trial registration: Clinicaltrials.gov NCT02681406
https://clinicaltrials.gov/ct2/show/NCT02681406?id=NCT02681406&draw=2&rank=1
References
- 1.McKay JR. Treating substance use disorders with adaptive continuing care. Washington DC: American Psychological Association; 2009. [Google Scholar]
- 2.Lin L, Fernandez AC, Bonar EE. Telehealth for substance-using populations in the age of Coronavirus disease 2019: Recommendations to enhance adoption. JAMA Psychiatry, Published online July 1, 2020. doi: 10.1001/jamapsychiatry.2020.1698. [DOI] [PMC free article] [PubMed] [Google Scholar]
- 3.Holmes EA, O’Connor RC, Perry VH, et al. Multidisciplinary research priorities for the COVID-19 pandemic: a call for action for mental health science. Lancet Psychiatry. 2020; published online April 15. 10.1016/S2215-0366(20)30168-1. [DOI] [PMC free article] [PubMed] [Google Scholar]
- 4.American Psychiatric Association. Practice guidelines for Covid-19. July 24, 2020. (updated Aug 3, 2020). [Google Scholar]
- 5.Centers for Disease Control. Using telehealth to expand access to essential health services during the COVID-19 pandemic. June 10, 2020. [Google Scholar]
- 6.Blodgett JC, Maisel NC, Fuh IL, Wilbourne PL, Finney JW. How effective is continuing care for substance use disorders? A meta-analytic review. Journal of Substance Abuse Treatment. 2014;46:87–97. [DOI] [PMC free article] [PubMed] [Google Scholar]
- 7.McKay JR, Lynch KG, Shepard DS, Pettinati HM. The effectiveness of telephone-based continuing care for alcohol and cocaine dependence: 24-month outcomes. Archives of General Psychiatry. 2005;62:199–207. [DOI] [PubMed] [Google Scholar]
- 8.McKay JR, Van Horn DH, Oslin DW, et al. A randomized trial of extended telephone-based continuing care for alcohol dependence: Within-treatment substance use outcomes. Journal of Consulting and Clinical Psychology. 2010;78:912–923. [DOI] [PMC free article] [PubMed] [Google Scholar]
- 9.Gustafson DH, McTavish FM, Chih M-Y, et al. A smartphone application to support recovery from alcoholism: A randomized controlled trial. JAMA Psychiatry. 2014;71:566–572. [DOI] [PMC free article] [PubMed] [Google Scholar]
- 10.McKay JR, Van Horn DHA, Oslin D, et al. Extended telephone-based continuing care for alcohol dependence: 24 month outcomes and subgroup analyses. Addiction. 2011;106:1760–1769. [DOI] [PMC free article] [PubMed] [Google Scholar]
- 11.McKay JR, Van Horn DHA, Lynch KG, et al. An adaptive approach for identifying cocaine dependent patients who benefit from extended continuing care. Journal of Consulting and Clinical Psychology. 2013;81:1063–1073. [DOI] [PMC free article] [PubMed] [Google Scholar]
- 12.McKay JR, Van Horn DHA, Lynch KG, et al. Who benefits from extended continuing care? Addictive Behaviors. 2014;39:660–668. [DOI] [PMC free article] [PubMed] [Google Scholar]
- 13.Nesvag S, McKay JR. Digital interventions to support people in recovery from substance use disorders: A review of feasibility and effects. Journal of Medical Internet Research. 2018; 20: e255. [DOI] [PMC free article] [PubMed] [Google Scholar]
- 14.Muroff J, Robinson W, Chassler, et al. An Outcome Study of the CASA-CHESS Smartphone Relapse Prevention Tool for Latinx Spanish-Speakers with Substance Use Disorders. Substance Use and Misuse. 2019;54:1438–1449. doi: 10.1080/10826084.2019.1585457 [DOI] [PubMed] [Google Scholar]
- 15.Meredith SE, Alessi SM, Petry NM. Smartphone applications to reduce alcohol consumption and help patients with alcohol use disorder: A state-of-the-art review. Adv Health Care Technol. 2015;1:47–54. [DOI] [PMC free article] [PubMed] [Google Scholar]
- 16.Boschen MJ, Casey LM. The use of mobile telephones as adjuncts to cognitive behavioral psychotherapy. Professional Psychology: Research and Practice. 2008;39:546- 552. [Google Scholar]
- 17.Cohn AM, Hunter-Reel D, Hagman BT, Mitchell J. Prompting behavior change from alcohol use through mobile technology: The future of ecological momentary assessment. Alcoholism: Clinical & Experimental Research. 2011;35:1–7. [DOI] [PMC free article] [PubMed] [Google Scholar]
- 18.Galloway GP, Didier R, Garrison K, Mendelson J. Feasibility of ecological momentary assessment using cellular telephones in methamphetamine dependant subjects. Substance Abuse: Research and Treatment. 2008;1:9–14. [DOI] [PMC free article] [PubMed] [Google Scholar]
- 19.Gustafson DH, Boyle MG, Shaw BR, et al. An E-health solution for people with alcohol problems. Alcohol Research and Health. 2011;33:227–237. [PMC free article] [PubMed] [Google Scholar]
- 20.Gustafson DH, Shaw BR, Isham A, Baker T, Boyle MG, Levy M. Explicating an evidence-based, theoretically informed, mobile technology-based system to improve outcomes in people in recovery for alcohol dependence. Substance Use & Misuse. 2011;49:96–111. [DOI] [PMC free article] [PubMed] [Google Scholar]
- 21.Clough BA, Casey LM. Technological adjuncts to enhance current psychotherapy practices: A review. Clinical Psychology Review. 2011;31:279–23. [DOI] [PubMed] [Google Scholar]
- 22.McKay JR, Gustafson DH, Ivey M, et al. Effects of automated smart phone recovery support and telephone continuing care in the treatment of alcohol use disorder: Study protocol for a randomized controlled trial. Trials. 2018;19:82. doi: 10.1186/s13063-018-2466-1. [DOI] [PMC free article] [PubMed] [Google Scholar]
- 23.McKay JR, Van Horn D, Morrison R. Telephone Continuing Care Therapy for Adults. Center City, MN: Hazelden; 2010. [Google Scholar]
- 24.First MB, Spitzer RL, Gibbon M, Williams JBW. Structured Clinical Interview for DSM-IV-TR Axis I Disorders, Research Version, Patient Edition. (SCID-I/P) (New York, Biometrics Research, New York State Psychiatric Institute; ), 2002. [Google Scholar]
- 25.Sheehan DV, Lecrubier Y, Sheehan KH, et al. The Mini-International Neuropsychiatric Interview (M.I.N.I.): the development and validation of a structured diagnostic psychiatric interview for DSM-IV and ICD-10. J Clin Psychiatry. 1998;59 Suppl 20:22–57. [PubMed] [Google Scholar]
- 26.McLellan A, Kushner H, Metzger D, et al. The fifth edition of the Addiction Severity Index. Journal of Substance Abuse Treatment. 1992;9:199–213. [DOI] [PubMed] [Google Scholar]
- 27.Sobell LC, Brown J, Leo GI, Sobell MB. The reliability of the Alcohol Timeline Followback when administered by telephone and by computer. Drug Alcohol Depend. 1996;42:49–54. [DOI] [PubMed] [Google Scholar]
- 28.Maisto SA., Sobell LC, Sobell MB. Comparison of alcoholics’ self-reports of drinking behavior with reports of collateral informants. Journal of Consulting and Clinical Psychology. 1979;47:106–122. [PubMed] [Google Scholar]
- 29.Stout RL, Beattie MC, Longabaugh R, Noel N. Factors affecting correspondence between patient and significant other reports of drinking [abstract]. Alcoholism: Clinical and Experimental Research. 1989;12:336. [Google Scholar]
- 30.Del Boca FK, Darkes J. The validity of self-reports of alcohol consumption: state of the science and challenges for research. Addiction.2003;98s2:1–12. 10.1046/j.1359-6357.2003.00586.x [DOI] [PubMed] [Google Scholar]
- 31.Feinn R, Tennen H, Kranzler HR. Psychometric properties of the short index of problems as a measure of recent alcohol-related problems. Alcohol Clin Exp Res. 2003;27:1436–1441. [DOI] [PubMed] [Google Scholar]
- 32.Ware JE, Kosinski M, Keller SD. A 12-Item Short-Form Health Survey: Construction of scales and preliminary tests of reliability and validity. Medical Care. 1996;34:220–233. [DOI] [PubMed] [Google Scholar]
- 33.Helander A, Wielders JP, Jeppsson JO, et al. Toward standardization of carbohydrate-deficient transferrin (CDT) measurements: II. Performance of a laboratory network running the HPLC candidate reference measurement procedure and evaluation of a candidate reference material. Clin Chem Lab Med. 2010:48(11):1585–1592. [DOI] [PubMed] [Google Scholar]
- 34.Sobell LC, Sobell MB, Connors GJ, Agrawal S. Assessing drinking outcomes in alcohol treatment efficacy studies: Selecting a yardstick of success. Alcoholism: Clinical and Experimental Research. 2003;27:1661–1666 [DOI] [PubMed] [Google Scholar]
- 35.Fitzmaurice GM, Laird NM, Ware JH. Applied Longitudinal Analysis (Second Edition), Wiley Series in Probability and Statistics, New York, 2011. [Google Scholar]
- 36.Guowei L, Taljaard M, Van den Heuvel E,et al. An introduction to multiplicity issues in clinical trials: The what, why, when, and how. International Journal of Epidemiology. 2017, 746–755. [DOI] [PubMed] [Google Scholar]
- 37.Molenberghs G, Verbeke G. Models for discrete longitudinal data, Springer Series in Statistics, 2005. [Google Scholar]
- 38.Thijs H, Molenberghs G, Michiels B, Verbeke G, Curran D. Strategies to fit pattern-mixture models, Biostatistics. 2002;3:245–265. [DOI] [PubMed] [Google Scholar]
- 39.Hedeker D, Gibbons RD, Waternaux C. Sample size estimation for longitudinal designs with attrition. Journal of Educational and Behavioral Statistics. 1999;24:70–93. [Google Scholar]
- 40.Falk D, Wang XQ, Liu L, et al. Percentage of subjects with no heavy drinking days: Evaluation as an efficacy endpoint for alcohol clinical trials. Alcoholism: Clinical and Experimental Research. 2010;34:2022–2034. [DOI] [PubMed] [Google Scholar]
Associated Data
This section collects any data citations, data availability statements, or supplementary materials included in this article.