

Abstract
Protein-energy wasting (PEW) is a key cause of functional impairment and poor health outcomes in people with chronic kidney disease. While PEW can be mitigated with nutrition therapy, it is a complex myriad of disorders with numerous interacting etiologies and corresponding presentations, which make it difficult to diagnose and manage in practice. A variety of scoring rubrics have been developed to facilitate malnutrition assessment. Although these tools have greatly benefited the recognition and treatment of PEW, the typical format of grading specified PEW indicators has the potential to overlook or overstate highly relevant individual-specific factors. This review presents a simple framework for malnutrition assessment that can be used to complement and evaluate conventional assessment tools. Unlike standard tools, which are designed to identify and rate malnutrition risk and severity, the malnutrition framework is conceptual model that organizes PEW assessment into three distinct, but interacting facets of PEW risk: nutrient balance, nutrition status, and malnutrition risk. The new framework encourages critical thinking about PEW risk that may help clinicians plan and interpret assessments to efficiently and effectively manage this condition.
Keywords: Malnutrition, protein-energy wasting, assessment, diagnosis, chronic kidney disease
Introduction
“Nutrition assessment is the first step in the treatment of malnutrition.” This first sentence of the seminal paper by Blackburn et al. (1977), Nutritional and metabolic assessment of the hospitalized patient,1 appropriately marks the beginning of the ongoing efforts to develop methods for assessing disease-related malnutrition. Since this time, a variety of composite nutritional indices have been developed for assessing and diagnosing malnutrition (e.g., subjective global assessment (SGA)). Although these tools have been widely adopted in clinical practice for assessing protein-energy wasting (PEW), a unique form of disease-related malnutrition in people with chronic kidney disease (CKD), PEW continues to be a major problem in this population.
Because PEW has many potential causal factors that can combine in complex ways to produce a variety of malnutrition phenotypes (e.g., acute vs chronic), it is difficult to devise standardized methods and instruments for its assessment. Adding to the sheer number of risk factors is that many of the key risk factors have low sensitivity for PEW. For instance, although inflammation is a well-established cause of PEW,2 not all patients with inflammation develop PEW. Moreover, many consequences of PEW are nonspecific and can be confounded by other factors. For example, diminished muscle mass or strength can be caused by malnutrition, but may also be related to nondietary factors (e.g., physical inactivity).3
For the most part, composite nutritional indices are rubrics that define and grade PEW by specifying and scoring measurement criteria associated with it. Measurement criteria typically span the full spectrum of PEW from upstream risk factors (e.g., inflammation) to downstream consequences (e.g., impaired function). However, the use of standardized rubrics to assess PEW has notable drawbacks (Table 1). A major problem stems from the fact that the scoring criteria are usually organized based on the type of measurement (e.g., physical exam, biochemical) rather than how they relate to PEW, thereby divorcing PEW indicators from its pathophysiology. Depending on how the scoring criteria are distributed, assessment tools can be skewed toward measuring certain aspects of PEW risk with the potential to overlook or overstate individual-specific factors. This feature may help explain the wide range in the estimated prevalence of PEW.4
Table 1.
Potential Drawbacks of Conventional Malnutrition Assessment Tools
| Drawback | Description | Example |
|---|---|---|
|
| ||
| Redundancy | Multiple scoring criteria measuring similar aspects of malnutrition | AND/A.S.P.E.N. tool has three separate scoring criteria for assessing nutrition status (physical exams of subcutaneous fat and muscle, function tests)18 |
| Inconsistency | Scoring criterion with multiple measurement parameters from different aspects of malnutrition | ISRNM tool weight scoring criterion includes indicators of nutrient balance (weight loss), and nutrition stores (weight status)13 |
| Weighting | Number (proportion) of scoring criteria that include indicators of nutrient balance, nutrition status and malnutrition risk | Fewer scoring criteria for nutrient balance (2/10) than nutrition status and malnutrition risk (4/10 each) in MIS tool21 |
| Scoring | Malnutrition assessed based on sum of scoring criteria (often unweighted) | AND/A.S.P.E.N. tool diagnosis of malnutrition based on 2/6 scoring criteria18 |
AND, academy of nutrition and dietetics; A.S.P.E.N., American Society for parenteral and enteral nutrition; ISRNM, International society of renal nutrition and metabolism; MIS, malnutrition inflammation score.
Composite nutritional indices undoubtedly capture key aspects of PEW and are useful for identifying and rating PEW risk and supporting a formal diagnosis. However, one of the main purposes of assessing PEW in clinical practice is to inform nutrition care plans that address the root cause(s) of PEW, if possible, and reflect the unique needs and circumstances of the patient. Standard scoring rubrics are not designed for this purpose, as it depends on understanding the clinical relevance of assessment parameters and how they fit together to define the nature of PEW risk. To help navigate this aspect of PEW assessment, we propose organizing PEW assessment into three subassessments of PEW pathophysiology. Such framework provides a conceptual model that can help clinicians plan and interpret PEW assessment, and researchers develop, evaluate, and refine composite nutritional indices. Although the framework was developed from the perspective of PEW, it may apply to other forms of disease-related malnutrition.
Putting Malnutrition Assessment in Context
The pathogenesis on PEW is complex and highly individualized. However, as with most forms of disease-related malnutrition, PEW progression has three main components, or phases. First, CKD-related factors cause dietary intakes to become inadequate by impairing the intake and bioavailability of nutrients, altering nutrient utilization and storage, and/or increasing nutrient losses. Second is the subclinical phase of malnutrition where nutrient intakes are inadequate to meet needs, but the body has sufficient stores to maintain essential nutrient functions. If the deficiency persists and nutrient stores become depleted, the third and final clinical phase of malnutrition develops with characteristic loss of functions. The three components of PEW are related and often correlated but can also be independent from one another. Indeed, a person with kidney failure can be in negative nutrient balance but still have ample nutrient stores and vice versa. Because each component informs a distinct aspect of PEW risk, they provide a logical framework for organizing its assessment (Fig. 1).
Figure 1.
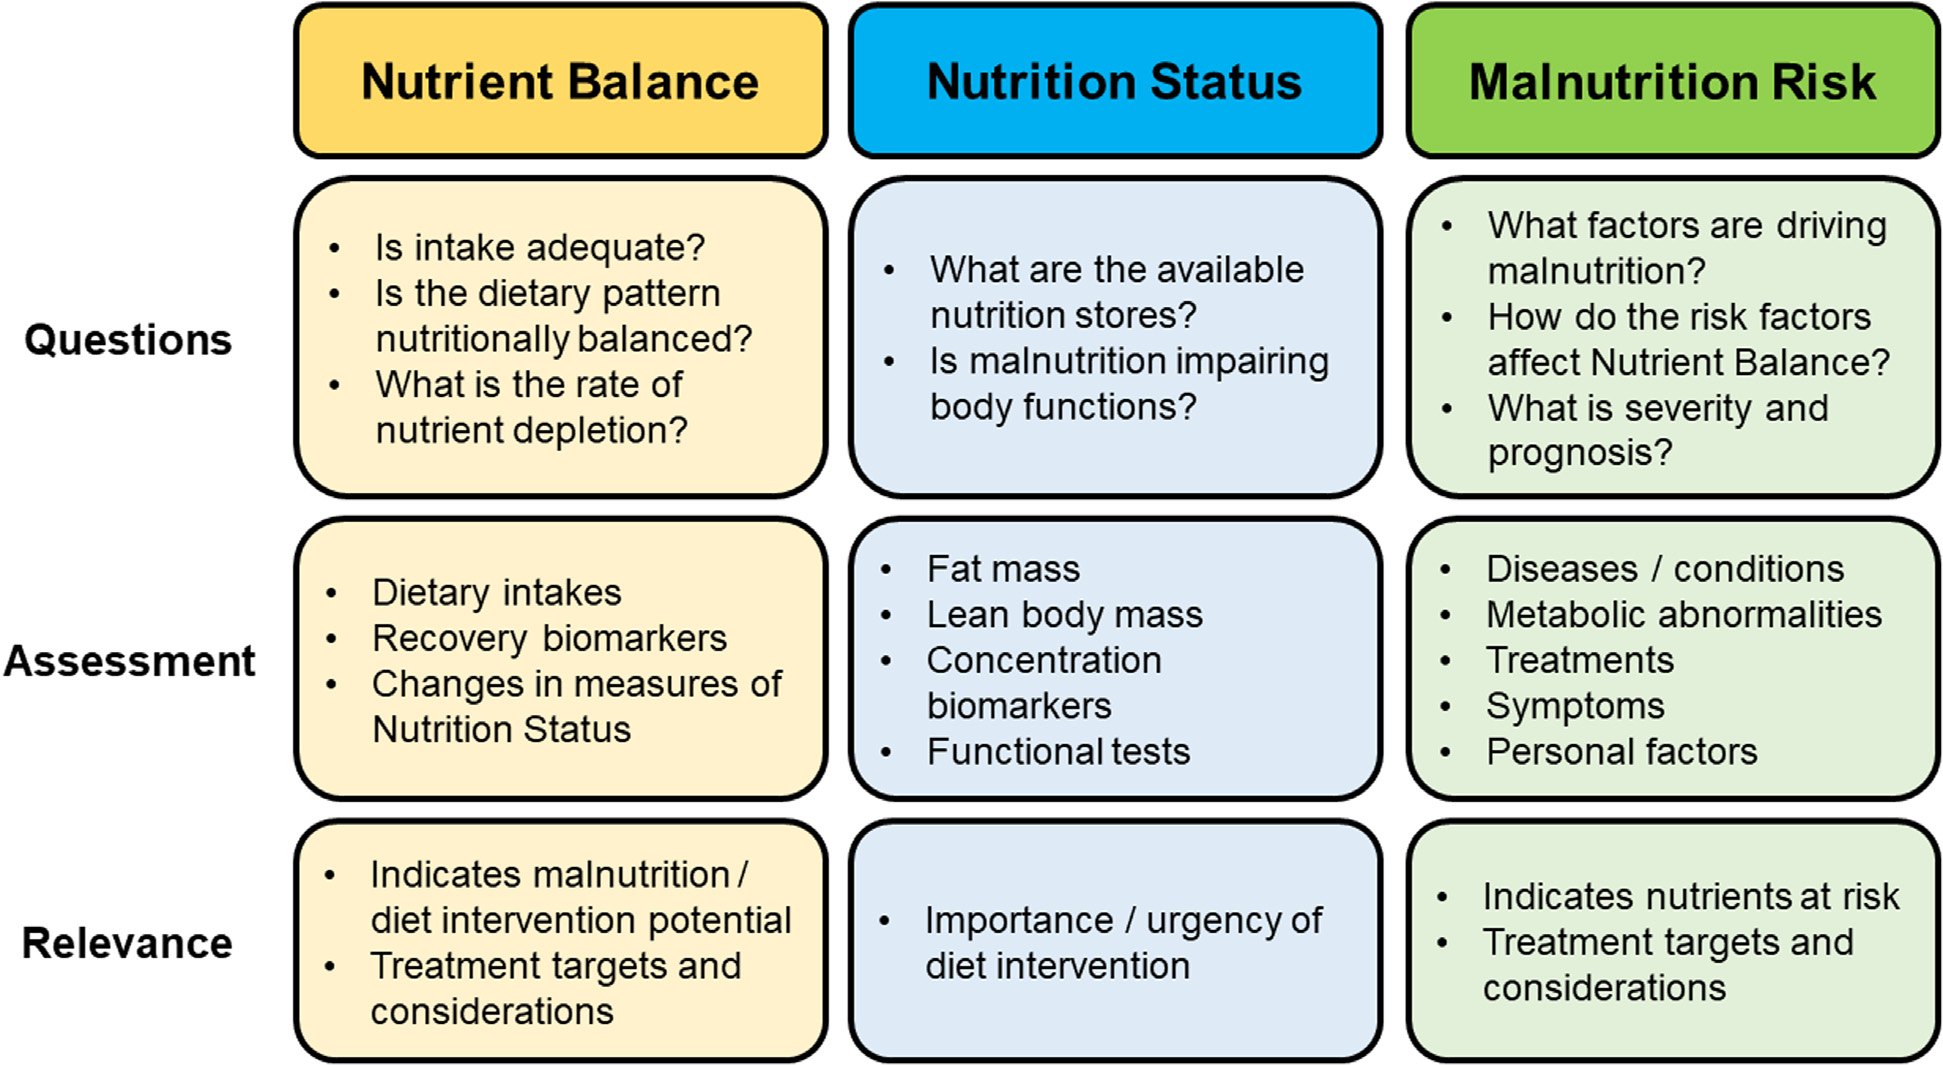
Malnutrition framework, Figure Legend. The malnutrition framework breaks down PEW assessment into three subassessments based on related, but distinct components of PEW pathophysiology: 1) Nutrient Balance, 2) Nutrition Status, and 3) Malnutrition Risk. Figure 1 provides an overview of each subassessment, including the key information gleaned (Questions), types of measurements (Assessment), and clinical utility (Relevance).
The following sections summarize how to assess and interpret the different components of PEW. As many features of PEW can be analyzed in a variety of ways, each with their own strength and weaknesses, assessment components are described broadly rather than promoting a one-size-fits-all approach. This flexibility is based on the understanding that clinicians apply critical thinking and clinical judgment to tailor individual assessments to the patient and modify assessments in response to findings in a reflective manner. As a general rule, the decision to obtain additional and more resource-intensive (precise) measurements should be based on a perceived need and understanding that it will inform patient care or follow-up (i.e., just because a clinician has access to dual-energy X-ray absorptiometry, or a metabolic cart does not mean that they should be performed in every patient).
Nutrient Balance
Nutrient balance represents the adequacy of nutrient intakes. This is the most central, defining phase of PEW, and best indicator of nutrition therapy potential. Indeed, a person can have significant risk factors for PEW and low nutrition stores, but if they are in nutrient balance, interventions to address risk factors may improve health outcomes and quality of life and prevent future PEW but are unlikely to produce immediate nutritional benefits. Nutrient balance can be evaluated directly based on dietary intakes and recovery biomarkers, or indirectly through changes in indicators of nutrition status (Table 2).
Table 2.
Indicators of Nutrient Balance, and Their Considerations
| Indicator | Key Considerations |
|---|---|
|
| |
| Reported dietary intakes | • Underreporting of dietary intakes9 biases assessment toward undernutrition |
| • 24-hour diet recalls | • Limited to detecting relatively severe nutrient deficits |
| • Food records | • Time-intensive to collect and analyze |
| • Provides a snapshot of energy and protein adequacy on days of measurement | |
| • Requires skilled examiner | |
| Recovery biomarkers | • Many sources of measurement error (e.g., nitrogen balance, sampling accuracy, urea losses in urine (nPNA)) |
| • UUN | |
| • nPNA | • Cannot distinguish low protein intakes from lack of protein in the diet vs. low overall energy intake |
| • Provides a snapshot of protein adequacy on days of measurement | |
| • Multiple days of measurement rarely available, but generally needed to obtain accurate estimate | |
| Δ Nutrition status (Table 2) | • Changes in body composition are more sensitive over longer periods of time (e.g., months) |
| • Anthropometric | • Vary in reliability for serial measurements |
| • Functional | • Key considerations of nutrition status indicators (Table 4) |
| • Concentration biomarkers | |
nPNA, normalized protein nitrogen appearance; UUN, urinary urea nitrogen; Δ, change.
Assessing Energy Balance
Energy occupies a unique role in nutrition as the master regulator of how much we eat and corresponding principal determinant of nutrient intake.5 With the exception of water, energy is the only dietary constituent for which intake is closely regulated to maintain adequacy. As a result, most nutrients, and especially energy-containing macronutrients such as protein, are closely tied to energy such that inadequate energy intake leads to inadequate nutrient intakes.5 Although the attributable fraction of PEW due to inadequate energy intake is uncertain, the fact that anorexia is commonly associated with PEW suggests that dysregulation of energy homeostasis is an important factor.6
One of the main methods for assessing energy balance is comparing estimates of energy intake with estimates of energy requirements. In practice, energy intake is typically assessed using 24-hour diet recalls or food records, and energy requirements are typically assessed using disease-specific prediction equations.7 Because the assessment window for recalls and records tends to be short-term, and energy intake and requirements are measured with considerable error with energy intake estimates being biased toward underreporting,8,9 this method is prone to overestimating the presence and severity of PEW, and is primarily useful for detecting current, severe negative energy balance.
Inadequate energy intake results in breakdown of body fat and protein, which can also be used to detect negative energy balance. This approach notably compliments dietary assessment. Whereas dietary assessment provides a snapshot of energy balance on the day(s) of measurement, changes in body mass represent cumulative energy balance in the time between measurements. As cumulative energy balance is proportional to the duration of the measurement window, and the limits of detection for changes in body mass and composition are relatively fixed, the sensitivity of this method increases with time. For example, assuming that a measurement could reliably detect energy deficits of ≥7,000 kcal (~2 lbs), it could detect a severe negative energy balance of 500 kcal/day within 2 weeks, or a mild negative energy balance of 100 kcal/day within 10 weeks. Consequently, changes in body mass and composition are primarily useful for evaluating chronic PEW, particularly as fluid shifts in this population from edema and dialysis can confound many anthropometric measurements.
The field of anthropometry has developed numerous methods for assessing fat mass and lean body mass. However, in most cases, changes in body weight are readily available and sufficient for evaluating long-term energy balance. Other anthropometric methods have a theoretical advantage of distinguishing fat mass loss from the more clinically relevant lean body mass loss and may be less impacted by changes in fluid status. But, unless changes in body weight are deemed unreliable, additional measurements of body composition are likely to produce diminishing returns. The problem is two-fold. For one, absolute changes in fat mass and lean body mass are typically smaller than changes in total body mass (Δ body weight = Δ fat mass + Δ lean body mass), resulting in lower limits of detection. Adding to this, many of the methods that can reasonably be used in clinical practice to assess changes in fat and lean body mass (e.g., physical examination, skinfold thickness, body circumferences) have relatively low precision and reliability for serial monitoring compared to body weight.10 Two potential methods for quantifying loss of lean body mass and muscle strength that are increasingly accessible are bioelectrical impedance analysis (BIA) and handgrip dynamometry, respectively. However, if caused by malnutrition, changes in BIA measurements and handgrip strength are expected to be highly correlated with weight loss. Moreover, loss of lean body mass and muscle strength can be the result of nondietary factors (e.g., sarcopenia from aging, atrophy from disuse).11
Assessing Protein Balance
The methods for evaluating protein balance are similar to energy balance with the notable exception that protein intake can also be measured objectively in CKD using recovery biomarkers methods (e.g., urinary urea nitrogen output, normalized protein nitrogen appearance). When evaluating protein intake adequacy, it is important to distinguish between low protein intake from consuming a low-protein diet and low protein intake due to low energy intake, as increasing protein intake is unlikely to overcome anabolic resistance caused by negative energy balance.12 Similar to energy balance, it is possible to evaluate cumulative protein balance through changes in lean body mass and function; however, this approach cannot distinguish protein from energy balance, or other causal factors.
Nutrition Status
One of the main concerns with PEW is loss of nutrient-dependent body functions. As noted, most nutrients’ biological functions are tied to nutrition status because nutrient stores provide a source of nutrients during periods of inadequate intake. As a result, it is important to consider the intersection of nutrient balance (rate of nutrient depletion) and nutrition status (available nutrient stores) when evaluating PEW risk and severity (Table 3).
Table 3.
Protein-Energy Wasting Risk Interactions Between Nutrient Balance and Nutrition Status
| Inadequate Nutrition Status | Adequate Nutrition Status | |
|---|---|---|
|
| ||
| Negative Nutrient Balance | • High risk | • Moderate risk |
| • Urgent, aggressive intervention | • Intervention | |
| Adequate Nutrient Balance | • Low risk | • Very low risk |
| • Closely monitor | • Follow-up per normal schedule | |
Despite broad agreement that measures of energy and protein status are an important part of PEW assessment, their roles in defining PEW is complex. A key debate is the extent to which negative energy and protein balance are a concern in patients with ample energy and protein stores (i.e., can a person with obesity be malnourished?). One problem is that while the body has a near limitless capacity to build energy stores, most essential micronutrients have limited storage that can easily become depleted in people with inadequate dietary intakes. This concern with PEW can often be mitigated with micronutrient supplementation. However, the larger issue of whether or not negative energy and protein balance are independently harmful remains. On the one hand, intentional calorie restriction has been shown to improve physiologic and metabolic factors associated with obesity that contribute to PEW and poor health. At the same time, unlike energy and many nutrients, the body does not possess nonfunctional protein stores; ergo, any loss of body protein has the potential to impair function to some extent. Ultimately, negative nutrient balance in people with CKD that is unintentional is fundamentally pathological, so delaying treatment until body fat and protein become depleted is inappropriate.
The interpretation of nutrition status is further complicated by the fact that the levels of energy and protein stores that denote impaired nutrition status are unclear and may differ between patients.7 For instance, the International Society of Renal Nutrition and Metabolism (ISRNM) expert panel proposed a body mass index (BMI) cutoff of, 23 kg/m2 for indicating PEW risk based on the observation that mortality risk in maintenance dialysis patients increases below this point.13 Contrasting this, the 2020 updated KDOQI Clinical Practice Guideline for Nutrition in CKD suggested that BMI must be much lower to support a diagnosis of PEW (,18 kg/m2).7 Although the more stringent KDOQI threshold relates to the isolated interpretation of BMI rather than as part of a composite nutritional index such as ISRNM, the substantial difference in proposed BMI cutoffs highlights the broad range of interpreting inadequate nutrition status.
Nutrition status can be assessed directly through physical exam, anthropometric measurements and concentration biomarkers, or indirectly by functional tests (Table 4). Given the broad range for defining impaired nutrition status, a brief physical examination can reasonably classify most people at the extremes of nutrition status. However, in cases where physical exam results are inconclusive or indicate low nutrition status that requires careful monitoring, anthropometric and functional measurements such as BMI, BIA, and handgrip dynamometry provide a more precise and quantifiable estimate of nutrition stores. Although certain biochemical parameters are associated with and have been used as indicators of nutrition status (e.g., low cholesterol, albumin, and prealbumin),1 their clinical relevance and utility as concentration biomarkers for energy and protein status is limited and largely refuted. Most notably, despite the long history of hypoalbuminemia being interpreted as a marker of low protein status, it is more indicative of inflammation and metabolic stress.7,14
Table 4.
Indicators of Nutrition Status and Their Considerations
| Indicator | Key considerations |
|---|---|
|
| |
| Physical exam | • Relatively quick and easy to obtain |
| • Body habitus | • Low precision, useful for crude classification of low and high energy and protein stores |
| • Subcutaneous fat stores | • Should assess multiple sites (head-to-toe examination) |
| • Muscle stores | • Requires skilled examiner |
| Anthropometric* | • More precise, quantified and standardized than physical exam methods |
| • Weight-height indices (e.g., BMI) | • May be confounded by fluid overload and shifts in CKD |
| • Circumferences | • Many require equipment and/or skilled examiner |
| • Skinfold thickness | |
| • BIA | |
| • Urine creatinine output | |
| Concentration biomarkers | • Hepatic transport proteins are better indicators of malnutrition risk (Table 5) |
| • Total cholesterol | |
| • Hepatic transport proteins (e.g., albumin) | |
| Function tests | • Function can be assessed qualitatively as part of physical exam (e.g., strength, mobility, muscle tone) |
| • Dynamometry | |
| • Frailty tests/indices | • Many require equipment and/or skilled examiner |
| • Function affected by training and physical activity | |
BMI, body mass index; BIA, bioelectrical impedance analysis.
Advanced anthropometric measurements such as densitometry, dual x-ray absorptiometry, and imaging and isotope methods are excluded, as impractical for PEW assessment in clinical practice.
Malnutrition Risk
People with CKD do not develop PEW spontaneously and without reason. Several factors are causing PEW in this population. Understanding the circumstances surrounding and factors driving PEW helps to determine which nutrients are most affected and how, as well as the likely prognosis. More importantly, as many of these factors are modifiable, they represent key targets for tailoring nutrition therapy to address PEW at its source.5 Despite their importance, it is beyond the scope of this review to provide more than a summary of the common types of PEW risk factors, which have been discussed in more detail elsewhere in the literature (Table 5).15,16 Because the list of factors potentially contributing to PEW is so vast and constantly expanding with new research, malnutrition risk should ideally be assessed comprehensively using an unbiased, systematic approach that considers key CKD-related factors such as CKD stage, comorbidities, conditions, treatments, metabolic abnormalities, and clinical symptoms, as well as personal factors such as socioeconomic status, health habits, and mental state and function.
Table 5.
Indicators of Malnutrition Risk and Their Considerations
| Indicator | Key considerations |
|---|---|
|
| |
| Disease | • Consider mechanism of effects on nutrient balance (e.g., impairs intake, increases requirements) |
| • Disease (e.g., stage of CKD) | |
| • Conditions (e.g., edema) | • Priority should be given to symptoms that are directly related to nutrient balance |
| • Metabolic abnormalities (e.g., metabolic acidosis) | |
| • Treatments (e.g., HD) | |
| • Symptoms (e.g., anorexia) | |
| Personal | • Often not modifiable with dietary intervention, but may impact efficacy |
| • Demographics | |
| • Socioeconomic status | |
| • Health habits (e.g., physical activity) | |
| • Mental state and function (e.g., depression) | |
CKD, chronic kidney disease; HD, hemodialysis.
Although malnutrition risk has the most considerations, it is usually a relatively smaller portion of conventional malnutrition assessment tools. This make sense, as the cumulative effects of risk factors on PEW are difficult to quantify and arguably better represented by measuring energy and nutrient balance, particularly as risk factors tend to be abundant, and have low sensitivity and/or specificity for PEW. When assessing malnutrition risk, it is important to consider the severity of risk factors, their relationships to one another and nutrition, and chronicity. In general, factors that are temporally linked to the onset of inadequate intake and clinical manifestations that more directly lead to negative energy and nutrient balance (e.g., anorexia, gastrointestinal abnormalities) should be weighed more heavily than medical factors that are indirectly related (e.g., metabolic acidosis, inflammation).
Appraisal of Malnutrition Assessment Tools
The complexities of PEW that make it difficult to develop composite nutritional indices also make evaluating and comparing them a challenge. Ideally, validity would be determined based on their ability to improve important aspects of care, notably patient outcomes, compared to some other tool, or other appropriate reference condition. However, this method is resource-intensive and ethically questionable if using an unassessed reference group. In lieu of this standard, nutritional indices are often validated based on their ability to predict health outcomes such as hospitalization risk/length and mortality, and their associations with other scoring systems and malnutrition indicators.7,17 Although these methods can provide useful information (e.g., prognostic value), neither approach evaluates the extent to which malnutrition assessment tools actually measure PEW (i.e., true validity).
The malnutrition framework provides a model for examining the validity of nutritional indices. By reorganizing the measurement parameters in these indices according to the malnutrition framework, they generally assess similar aspects of malnutrition, but differ from one another in the parameters used, and the relative weighting of nutrition balance, nutrition status, and malnutrition risk in defining malnutrition. To demonstrate this, several tools used in CKD were examined according to the proposed malnutrition framework (Table 6), as described below. Tools include the Academy of Nutrition and Dietetics/American Society for Parenteral and Enteral Nutrition (AND/A.S.P.E.N.) criteria,18 Global Leadership Initiative on Malnutrition criteria (GLIM),19 7-point SGA,20 Malnutrition Inflammation Score (MIS),21 and ISRNM PEW score.13
Table 6.
Organization of Malnutrition Assessment Tool Measurement Parameters According to the Malnutrition Framework
| Measurement Parameters |
||||
|---|---|---|---|---|
| Tool (Assessment) | Scoring Criteria | Nutrient Balance | Nutrition Status | Malnutrition Risk |
|
| ||||
| AND/A.S.P.E.N. | Inflammation | |||
| • Inflammation scoring criteria used to classify malnutrition type (starvation, acute disease/injury, chronic disease) | Laboratory | • Marked negative nitrogen balance | • Low albumin | |
| • Low transferrin | ||||
| • Low prealbumin | ||||
| • High CRP | ||||
| • Malnutrition scoring criteria used to assess malnutrition | • High glucose | |||
| • Low/high WBC count | ||||
| • Diagnosis: ≥2 abnormal criteria | • High neutrophils | |||
| • Low platelets | ||||
| Clinical | • Conditions (diagnoses) | |||
| • Fever | ||||
| • Hypothermia | ||||
| • Infection (urinary, sepsis, wound/incision, pneumonia) | ||||
| • Abscess | ||||
| Malnutrition | ||||
| Weight change | • Weight loss | |||
| Dietary intake | • Inadequate energy intake | |||
| Fat mass | • Reduced subcutaneous fat mass | |||
| Muscle mass | • Reduced muscle mass | |||
| Fluid accumulation | • Edema/ascites | |||
| Functional capacity | • Reduced handgrip strength | |||
| • Reduced function (other tests) | ||||
| GLIM | Phenotypic | |||
| • Phenotypic scoring criteria used to assess severity of malnutrition | Weight change | • Weight loss | ||
| Body mass | • Low BMI | |||
| Muscle mass | • Reduce muscle mass | |||
| • Etiologic scoring criteria used to classify malnutrition type (starvation, acute disease/injury, chronic disease ± inflammation) | • Reduced function (supportive) | |||
| Etiologic | ||||
| Dietary intake | • Inadequate energy intake | • GI symptoms or conditions impairing food assimilation/absorption | ||
| • Diagnosis: ≥1 abnormal phenotypic and etiologic criteria | Inflammation | • Conditions (diagnoses) | ||
| • High CRP (supportive) | ||||
| 7-Point SGA | History | |||
| • Scoring criteria rated on 7-point Likert scale as very mild risk to well nourished (6–7), mild-moderate (3–5), or severely malnourished (1–2). | Weight change | • Weight loss | ||
| Dietary intake | • Inadequate energy and protein intake | |||
| • Reduced diet type (e.g., liquid) | ||||
| GI symptoms | • GI symptoms | |||
| • Diagnosis: Overall rating subjectively determined based on scoring criteria ratings. | • Anorexia | |||
| Functional capacity | • Reduced function (ambulation, activity) | |||
| Disease state | • Conditions (diagnoses) | |||
| • Increased nutrition requirements | ||||
| • Metabolic stress | ||||
| Physical exam | ||||
| Fat mass | • Reduced subcutaneous fat mass | |||
| Muscle mass | • Reduced muscle mass | |||
| Fluid accumulation | • Edema | |||
| MIS | Medical history | |||
| • Scoring criteria rated on 4-point Likert scale as normal (0), mild (1), moderate (2), or severe (3). | Weight change | • Weight loss | ||
| Dietary intake | • Inadequate dietary intake | |||
| • Reduced diet type (e.g., liquid) | ||||
| GI symptoms | • GI symptoms | |||
| • Diagnosis: Rated as the unweighted sum of scoring criteria (0–30); no established cutoff for diagnosis, but proposed cutoff values range from 4 to 10/30.29–33 | • Anorexia | |||
| Functional capacity | • Reduced function (ambulation, fatigue, activity) | |||
| Comorbidity | • Conditions | |||
| • Dialysis vintage | ||||
| Physical exam | ||||
| Fat mass | • Reduced subcutaneous fat mass | |||
| Muscle mass | • Reduced muscle mass | |||
| Body mass | • Low BMI | |||
| Laboratory tests | ||||
| Serum albumin | • Low albumin | |||
| TIBC | • Low TIBC | |||
| ISRNM | Serum chemistry | • Low albumin | ||
| • Diagnosis: Abnormalities in ≥3/4 scoring criteria; optimally on three occasions (2–4 wks apart) | • Low prealbumin | |||
| • Low cholesterol | ||||
| Body mass | • Weight loss | • Low BMI | ||
| • Reduced fat mass | ||||
| Muscle mass | • Muscle loss | • Low creatinine appearance | ||
| Dietary intake | • Inadequate energy and protein intake | |||
AND/A.S.P.E.N., Academy of Nutrition and Dietetics/American Society for Parenteral and Enteral Nutrition; CRP, C-reactive protein; GLIM, Global Leadership Initiative on Malnutrition; GI, gastrointestinal; ISRNM, International Society of Renal Nutrition and Metabolism; MIS, Malnutrition-Inflammation Score; SGA, Subjective Global Assessment; TIBC, total iron binding capacity.
Nutrient Balance
Weighting of nutrient balance ranged from 1/5 criteria in MIS up to 3/4 criteria in ISRNM. Adequacy of dietary energy intake and weight loss was the main indicators of nutrient balance, represented in all indices. Several indices also included measurement parameters for diet type (SGA, MIS), inadequate dietary protein intake (SGA, ISRNM), and loss of muscle mass (ISRNM). In all three indices with specified scoring cutoffs (AND/A.S.P.E.N., GLIM, ISRNM), ratings on nutrient balance criteria alone were sufficient to diagnose PEW. At the same time, PEW could be diagnosed in people with normal nutrient balance ratings, suggesting that it was not considered a necessary component of PEW (see Supplementary Materials, case 2). This is surprising, as inadequate intake is a fundamental characteristic of PEW and main impetus for nutrition therapy.
Nutrition Status
Nutrition status was usually weighted similar to nutrient balance, ranging from 1/3 criteria (SGA) to 1/2 criteria (AND/A.S.P.E.N., ISRNM). However, measurements of nutrition status were far less uniform, highlighting the diverse variety of methods available for assessing this aspect of PEW. Indeed, nutrition status criteria included biochemical parameters (ISRNM), measurements of weight status (GLIM, MIS, ISRNM), fat mass (AND/A.S.P.E.N., SGA, MIS, ISRNM) and lean body mass (AND/A.S.P.E.N., GLIM, SGA, MIS), and functional tests (AND/A.S.P.E.N., SGA, MIS). Ratings on nutrition status criteria alone were sufficient to diagnose PEW in 1 out of three tools (AND/A.S.P.E.N.), but like nutrient balance, abnormal ratings on nutrition status were not necessary to diagnose PEW. The fact that low nutrition status was often weighted similarly to nutrient balance, and was enough to support a diagnosis of PEW in the AND/A.S.P.E.N. tool is noteworthy, as low nutrient stores are primarily a concern when paired with negative nutrient balance (Table 3).
Malnutrition Risk
The relative weighting of malnutrition risk tended to be slightly lower, ranging from 1/6 criteria (AND/A.S.P.E.N.) to 1/2 criteria (SGA). As expected, tools tended to capture only a small fraction of potential PEW risk factors, including biochemical parameters (MIS, ISRNM), anorexia and gastrointestinal symptoms (SGA, MIS), edema (SGA, AND/A.S.P.E.N.), and diagnosis of diseases and conditions (GLIM, SGA, MIS). The presence of malnutrition risk factors alone was not sufficient or necessary for diagnosing PEW. As noted previously, the relatively limited representation of malnutrition risk in diagnosing PEW makes sense. However, if PEW is identified or suspected, a more comprehensive assessment of its potential cause(s) should be performed, as it is critical to guiding patient-centered care and addressing PEW at its source.
Discussion
Malnutrition has long been recognized as a grim, but preventable consequence of chronic diseases such as CKD. It was nearly half a century ago that Butterworth (1974) infamously warned that clinicians “shouldn’t be surprised to find a skeleton behind the first door they open”.25 Left unchecked, PEW depletes the body of vitality and function, potentially exacerbating CKD pathology and complications, diminishing quality of life, and worsening the human and health care costs of CKD.22–24 Assessment is the foremost step in addressing the burden of PEW.
Since the skeleton in the hospital closet was first described, research has greatly enhanced understanding of the etiologies, pathogeneses and consequences of PEW. And yet, composite nutritional indices for PEW assessment are remarkably similar to those that were initially developed in the 1980s,26 with the major limitations and uncertainties still being largely unaddressed. In fact, the 7-point SGA, which received the highest grading of evidence of the composite nutritional indices evaluated in the 2020 updated KDOQI Clinical Practice Guideline for Nutrition in CKD (1B),7 is nearly identical to the original SGA,26 primarily replacing the three-level scale (A, B, C) with a 7-point rating scale (1–7).20 The framework presented in this paper provides a conceptual model for assessing PEW. Unlike standard indices, which rate PEW risk based on the presence and/or severity of select PEW-related factors organized measurement type, this framework describes PEW risk based on the interaction of three distinct aspects of PEW pathophysiology, which ask the questions (Fig. 1).
How adequate is energy and protein intake? (Nutrient Balance),
What are the available energy and protein stores? (Nutrition Status), and
What are the disease-related and patient-related factors that may contribute to PEW? (Malnutrition Risk).
This framework can help interpret, evaluate and compare the findings from standard nutritional indices (Table 5). Measurement parameters included in these tools generally fit into one of the three aspects of PEW outlined in the framework, suggesting that it was able to account for, and group standard indicators of PEW risk. Our analysis showed that composite nutritional indices often include similar scoring criteria and measurement parameters, particularly for assessing nutrient balance and nutrition status, but differ considerably in the relative weighting of the aspects of PEW. For example, there are more scoring criteria assessing nutrition status than malnutrition risk in the AND/A.S.P.E.N. and ISRNM tools, whereas the proportions are equal in the GLIM, SGA, and MIS tools. Because the relative weighting of the aspects of PEW in defining PEW risk is highly subjective, and may differ by patients, the clinical relevance of these differences is uncertain, but warrants careful consideration. To demonstrate the utility of the malnutrition framework in PEW assessment relative to standard composite nutritional indices in assessing PEW, two clinical cases of people with CKD were developed and analyzed (see Supplementary Materials).
Practical Aspects
Assessment plays a critical role in preventing, diagnosing, and treating PEW in people with CKD. Conventional composite nutritional indices are useful tools for identifying and rating PEW risk but may overlook key patient-specific factors and require careful interpretation to guide nutrition therapy. This review introduces a framework that organizes PEW assessment according to the aspect of PEW pathophysiology being assessed. This framework provides useful context that is not inherent to standard nutritional indices, which enhance understanding and can help clinicians interpret PEW assessment to plan appropriate nutrition interventions to address the underlining cause(s) of PEW. Additional research is needed to evaluate the appropriateness of grouping indicators of nutrient balance, nutrition status, and malnutrition risk in defining PEW risk, and to examine the efficacy of the malnutrition framework in guiding care and improving patient outcomes.
Supplementary Material
Financial Disclosure:
The authors declare that they have no relevant financial interests.
Support:
D.E.S. receives research support from the Nevada Agricultural Experiment Station in the College of Agriculture, Biotechnology & Natural Resources at the University of Nevada, Reno.
Footnotes
Supplementary Data
Supplementary data related to this article can be found at https://doi.org/10.1053/j.jrn.2023.04.002.
References
- 1.Blackburn GL, Bistrian BR, Baini BS, Schlamm HT, Smith MF. Nutritional and metabolic assessment of the hospitalized patient. J Parenter Enteral Nutr. 1977;1:11–22. [DOI] [PubMed] [Google Scholar]
- 2.Carrero JJ, Kistler B, Stenvinkel P. Inflammation in chronic kidney disease. In: Kopple JD, Massry SG, Kalantar-Zadeh K, Fouque D, eds. Nutritional Management of Renal Disease. 4th ed Academic Press; 2022:91–105. [Google Scholar]
- 3.Storer TW. Exercise training for individuals with advanced chronic kidney disease. In: Kopple JD, Massry SG, Kalantar-Zadeh K, Fouque D, eds. Nutritional Management of Renal Disease. 4th ed Academic Press; 2022:937–970. [Google Scholar]
- 4.Gracia-Iguacel C, Gonzalez-Parra E, Mahillo I, Ortiz A. Criteria for classification of protein-energy wasting in dialysis patients: impact on prevalence. Br J Nutr. 2019;121:1271–1278. [DOI] [PubMed] [Google Scholar]
- 5.St-Jules DE, Fouque D. A novel approach for managing protein-energy wasting in people with kidney failure undergoing maintenance hemodialysis: rationale and call for trials. Am J Kidney Dis. 2022;80:277–284. [DOI] [PubMed] [Google Scholar]
- 6.Kalantar-Zadeh K, Block G, McAllister CJ, Humphreys MH, Kopple JD. Appetite and inflammation, nutrition, anemia, and clinical outcome in hemodialysis patients. Am J Clin Nutr. 2004;80:299–307. [DOI] [PubMed] [Google Scholar]
- 7.Ikizler TA, Burrowes JD, Byham-Gray LD, et al. KDOQI Nutrition in CKD Guideline Work Group. KDOQI clinical practice guideline for nutrition in CKD: 2020 update. Am J Kidney Dis. 2020;76:S1–S107. [DOI] [PubMed] [Google Scholar]
- 8.Shah A, Bross R, Shapiro BB, Morrison G, Kopple JD. Dietary energy requirements in relatively healthy maintenance hemodialysis patients estimate from long-term metabolic studies. Am J Clin Nutr. 2016;103:757–765. [DOI] [PMC free article] [PubMed] [Google Scholar]
- 9.Kim E, Fenyi JO, Kim J, et al. Comparison of total energy intakes estimated by 24-hour recall with total energy expenditure measured by the doubly labeled water method in adults. Nutr Res Pract. 2022;15:645–657. [DOI] [PMC free article] [PubMed] [Google Scholar]
- 10.Ulijaszek SJ, Kerr DA. Anthropometric measurement error and the assessment of nutritional status. Br J Nutr. 1999;82:165–177. [DOI] [PubMed] [Google Scholar]
- 11.Isoyama N, Qureshi AR, Avesani CM, et al. Comparative associations of muscle mass and muscle strength with mortality in dialysis patients. Clin J Am Soc Nephrol. 2014;9:1720–1728. [DOI] [PMC free article] [PubMed] [Google Scholar]
- 12.Slomowitz LA, Monteon FJ, Grosvenor M, Laidlaw SA, Kopple JD. Effect of energy intake on nutritional status in maintenance hemodialysis patients. Kidney Int. 1989;35:704–711. [DOI] [PubMed] [Google Scholar]
- 13.Fouque D, Kalantar-Zadeh K, Kopple J, et al. A proposed nomenclature and diagnostic criteria for protein-energy wasting in acute and chronic kidney disease. Kidney Int. 2008;73:391–398. [DOI] [PubMed] [Google Scholar]
- 14.Evans DC, Corkins MR, Malone A, et al. , ASPEN Malnutrition Committee. The use of visceral proteins as nutrition markers: an ASPEN position paper. Nutr Clin Pract. 2021;36:22–28. [DOI] [PubMed] [Google Scholar]
- 15.Carrero JJ, Stenvinkel P, Cuppari L, et al. Etiology of the protein-energy wasting syndrome in chronic kidney disease: a consensus statement from the international society of renal nutrition and metabolism (ISRNM). J Ren Nutr. 2013;32:77–90. [DOI] [PubMed] [Google Scholar]
- 16.Sumida K, Kovesdy CP. Causes and treatment of protein-energy wasting in kidney disease. In: Kopple JD, Massry SG, Kalantar-Zadeh K, Fouque D, eds. Nutritional Management of Renal Disease. 4th ed Academic Press; 2022:191–206. [Google Scholar]
- 17.Avesani CM, Sabatino A, Buerra A, et al. A comparative analysis of nutritional assessment using global leadership initiative on malnutrition verses subjective global assessment and malnutrition inflammation score in maintenance hemodialysis patients. J Ren Nutr. 2022;32:476–482. [DOI] [PubMed] [Google Scholar]
- 18.Malone A, Hamilton C. The Academy of nutrition and Dietetics/the American society for Parenteral and Enteral nutrition consensus malnutrition characteristics: Application in practice. Nutr Clin Pract. 2013;28:639–650. [DOI] [PubMed] [Google Scholar]
- 19.Cederholm T, Jensen GL, Correia MITD, et al. GLIM criteria for the diagnosis of malnutrition – a consensus report from the global clinical nutrition community. J Cachexia Sacropenia Muscle. 2019;10:207–217. [DOI] [PMC free article] [PubMed] [Google Scholar]
- 20.Steiber AL, Kalantar-Zadeh K, Secker D, McCarthy M, Sehgal A, McCann L. Subjective global assessment in chronic kidney disease: a review. J Ren Nutr. 2004;14:191–200. [PubMed] [Google Scholar]
- 21.Kalantar-Zadeh K, Kopple JD, Block G, Humphreys MH. A malnutrition-inflammation score is correlated with morbidity and mortality in maintenance hemodialysis patients. Am J Kidney Dis. 2001;38:1251–1263. [DOI] [PubMed] [Google Scholar]
- 22.Martins VS, Adragao T, Aguiar L, et al. Prognostic value of the malnutrition-inflammation score in hospitalization and mortality on long-term hemodialysis. J Ren Nutr. 2022;32:569–577. [DOI] [PubMed] [Google Scholar]
- 23.Chao C, Tang C, Cheng RW, Wang MY, Hung K. Protein-energy wasting significantly increases healthcare utilization and costs among patients with chronic kidney disease: a propensity-score matched cohort study. Curr Med Res Opin. 2017;33:1705–1713. [DOI] [PubMed] [Google Scholar]
- 24.Guenzani D, Muoli M, Caldiroli L, et al. Malnutrition and inflammation are associated with severity of depressive and cognitive symptoms of old patients affected by chronic kidney disease. J Psychosom Res. 2018;125:109783. [DOI] [PubMed] [Google Scholar]
- 25.Butterworth CE. The skeleton in the hospital closet. Nutr Hosp. 2005;20:302–307. [PubMed] [Google Scholar]
- 26.Detsky AS, McLaughlin JR, Baker JP, et al. What is subjective global assessment of nutrition status? J Parent Ent Nutr. 1987;11:8–13. [DOI] [PubMed] [Google Scholar]
Associated Data
This section collects any data citations, data availability statements, or supplementary materials included in this article.