

Abstract
INTRODUCTION:
To investigate the correlation between retinal thickness and optic tract integrity in subjects with autosomal dominant Alzheimer’s Disease (ADAD) causing mutations.
METHODS:
Retinal thicknesses and diffusion tensor images (DTI) were obtained using OCT and MRI, respectively. The association between retinal thickness and DTI measures was adjusted for age, gender, retinotopy and correlation between eyes.
RESULTS:
Optic tract mean diffusivity and axial diffusivity were negatively correlated with retinotopically defined ganglion cell-inner plexiform thickness (GCIPL). Fractional anisotropy was negatively correlated with retinotopically defined retinal nerve fiber layer thickness. There was no correlation between outer nuclear layer (ONL) thickness and any DTI measure.
DISCUSSION:
In ADAD, GCIPL thickness is significantly associated with retinotopic optic tract DTI measures even in minimally symptomatic subjects. Similar associations were not present with ONL thickness or when ignoring retinotopy. We provide in vivo evidence for optic tract changes resulting from ganglion cell pathology in ADAD.
Keywords: autosomal dominant Alzheimer’s disease, Latino, optical coherence tomography, retinal thickness, ganglion cell layer, inner plexiform layer, outer nuclear layer, diffusion tensor imaging
1. Background:
Late Onset Alzheimer’s disease (LOAD) is the most common cause of dementia.1 Retinal histopathology in humans with LOAD has demonstrated retinal thinning2,3, optic nerve atrophy4, and amyloid β-protein (Aβ)5–9. Specifically, a significant increase in Aß42 isoforms, intraneuronal Aß oligomers, and upregulation of inflammatory pathways have been demonstrated9. In vivo human retinal imaging using optical coherence tomography (OCT) has demonstrated variable thinning of the retinal nerve fiber layer (RNFL) and ganglion cell inner plexiform layer (GCIPL) in LOAD10–12. Especially in early stages of disease, it is not clear whether these changes represent independent degenerative or inflammatory events throughout the white and grey matter, or if they represent a pattern of change that is predictable13–15.
In less than 1% of patients, Alzheimer’s Disease (AD) is inherited in an autosomal dominant fashion (ADAD)16. In carriers of ADAD mutations, the development of disease is almost certain and the age of symptom onset is relatively young and somewhat predictable17–19. Although there are differences20,21, the clinical and pathological phenotype of ADAD is similar to LOAD. For example, comparisons of cerebrospinal fluid Aβ−42, Aβ−40, tau, and phosphorylated-tau between carriers of pathogenic variants of ADAD and subjects with LOAD demonstrate similar biomarker profiles and rates of cognitive decline22. Retinal imaging of asymptomatic ADAD subjects also demonstrates thinning that is similar to RNFL and GCIPL thinning in MCI and LOAD23,24. Therefore, ADAD is a valuable model for studying AD biomarkers particularly because subjects with ADAD are young and lack confounding comorbid disease observed in LOAD.
The RNFL projections from the retina form the optic nerve, optic tracts, and chiasmal projections within the CNS in a retinotopic manner. Approximately 53% of the total axons, predominantly from nasal retina, decussate and continue in the contralateral optic tract along with a minority of axons from the contralateral temporal retina25. RGC layer thickness is significantly associated with optic tract fiber cross-sectional area26. Histopathology of LOAD subjects show retinotopic degeneration of axons in the superior optic nerve corresponding to the RGC and RNFL degeneration observed in the superior retina7,27. Therefore, thinning of the RGC and RNFL layer as well as its corresponding dendritic fields in the inner plexiform layer suggest that AD-related retinal changes may be reflected in other portions of the CNS in a retinotopic manner. A priori knowledge of the retinotopic organization of the visual system and the ability to resolve RGC thickness at near cellular level resolution using OCT provides a unique opportunity to explore the association between changes at the level of ganglion cell soma and their corresponding optic tracts projections in the white matter as a biomarker of early AD related degeneration in vivo.
In this study, we hypothesize that ADAD causing mutations cause retinotopically organized structural changes in the visual system in early disease. We test this hypothesis by examining the associations between retinal sublayer thickness and the integrity of optic tracts in carriers of ADAD mutations. While DTI has confirmed white matter changes in LOAD,28,29 and ADAD30,31, the pathogenesis of this is incompletely defined. Such changes could represent a direct effect of inflammation32 or vascular changes33 on white matter or it could represent antero- or retrograde degeneration of projections due to primary pathology in neuronal cell bodies. An association between measures of the integrity of ganglion cells and their projections would support pathology at the level of the cell soma being causative of down-stream changes in white matter. For the first, time we leverage high-resolution retinal OCT imaging and MRI connectomic imaging in the Human Connectome Protocol34 to explore the association between retinal sublayer thickness and DTI in relatively young human subjects whose only known disease risk is attributable to ADAD mutations. Such an association in vivo during the presymptomatic stages of AD could be a novel biomarker of early disease and support the hypothesis that neuronal changes secondary to ADAD mutations have a predictable pattern in the visual system.
2. Methods:
2.1. Human Subjects
This cross-sectional study was conducted according to the tenets of the Declaration of Helsinki and approved by the Institutional Review Board of the University of Southern California and Johns Hopkins University. Informed consent was obtained from all participants. Participants of the study were Latinos affected by or at 50% risk for inheriting pathogenic ADAD mutations (F388S or A431E substitutions in PSEN135,36 or V717I substitution in APP37).
All participants underwent full ophthalmic examination including best-corrected visual acuity, intraocular pressure, slit-lamp examination, and ophthalmoscopy. Subjects were excluded if they had any major psychiatric illness, history of non-AD neurological disorder, cerebrovascular accident, glaucoma, retinal surgery, notable media opacity (e.g. cataracts) or any history of significant vascular disease such as diabetes or hypertension. All subjects underwent comprehensive neurological and neuropsychological evaluation at the USC Alzheimer’s Disease Research Center (ADRC) including Global clinical dementia rating (CDR) and sum of boxes (CDR-SOB). CDR and CDR-SOB are widely used clinical assessments of cognitive and functional capacity where a score of 0 represents no symptoms and 18 greatest disease severity38.
2.2. Genotyping
Genotyping for the presence of mutations (APP V717I, PSEN1 A431E, and PSEN1 F388S) was performed on genomic DNA isolated from whole blood samples (Quick-DNA™ Miniprep Kit, Zymo Research, Cat. No. D3025) using Sanger sequencing of polymerase chain reaction (PCR) amplified coding exons. Approximately 50ng DNA was amplified in a 25μL reaction mixture with AccuPrime™ Taq DNA Polymerase, high fidelity (Thermo Fisher Scientific, Cat No. 12346086). For APP V717I, the forward and reverse primers were 5′-CAACCAGTTGGGCAGAGAAT-3′ and 5′-AGCATCATGGAAGCACACTG-3′, respectively. For PSEN1A431E, the forward and reverse primers were 5′-TTCCAGATTGAATGAACGTCT-3′ and 5′-CGCAGTGTCAGTGAAATCGT-3′, respectively. For PSEN1 F388S, the forward and reverse primers were 5′- CAGCAGCATCTACAGTTAAGACTCCA −3′ and 5′- CAGAACTGCCTTAAAGGGACTGTGTAA −3′, respectively. Before sequencing, the polymerase chain reaction (PCR) products were purified using a one-step ExoSAPITTM PCR product cleanup reagent (Cat. No. 78200, Thermo Fisher Scientific, Cat. No. 78200).
2.3. Optical coherence tomography (OCT)
Spectral-domain OCT (Spectralis, Heidelberg Engineering, Germany) was used to image the macular region of both eyes of all subjects39. Automated retinal layer segmentation was performed using OCT Eye Explorer (Iowa City, IOWA, version 3.8.0)40 with layers defined as shown in Figure 1a. Retinal thicknesses for the entire retina as well sublayers including RNFL, GCL, IPL, and ONL were obtained for the entire standard ETDRS grid. Due to the proscribed organization of the standard ETDRS grid, the nasal and temporal quadrants only represent partial retinotopic organization of the retina with respect to the visual pathways41. To more accurately capture the retinotopic organization of the retina, we used a modified ETDRS grid (Figure 1b) that divides the OCT in half along a vertical line with respect to the foveal center. For simplicity we present the data from the modified, retinotopically accurate ETDRS grid (hereafter called rETDRS), in the figures of the manuscript. We provide the figures from the standard ETDRS grid analysis in supplemental figures (eFigures 1 and 2) unless otherwise indicated.
Figure 1:
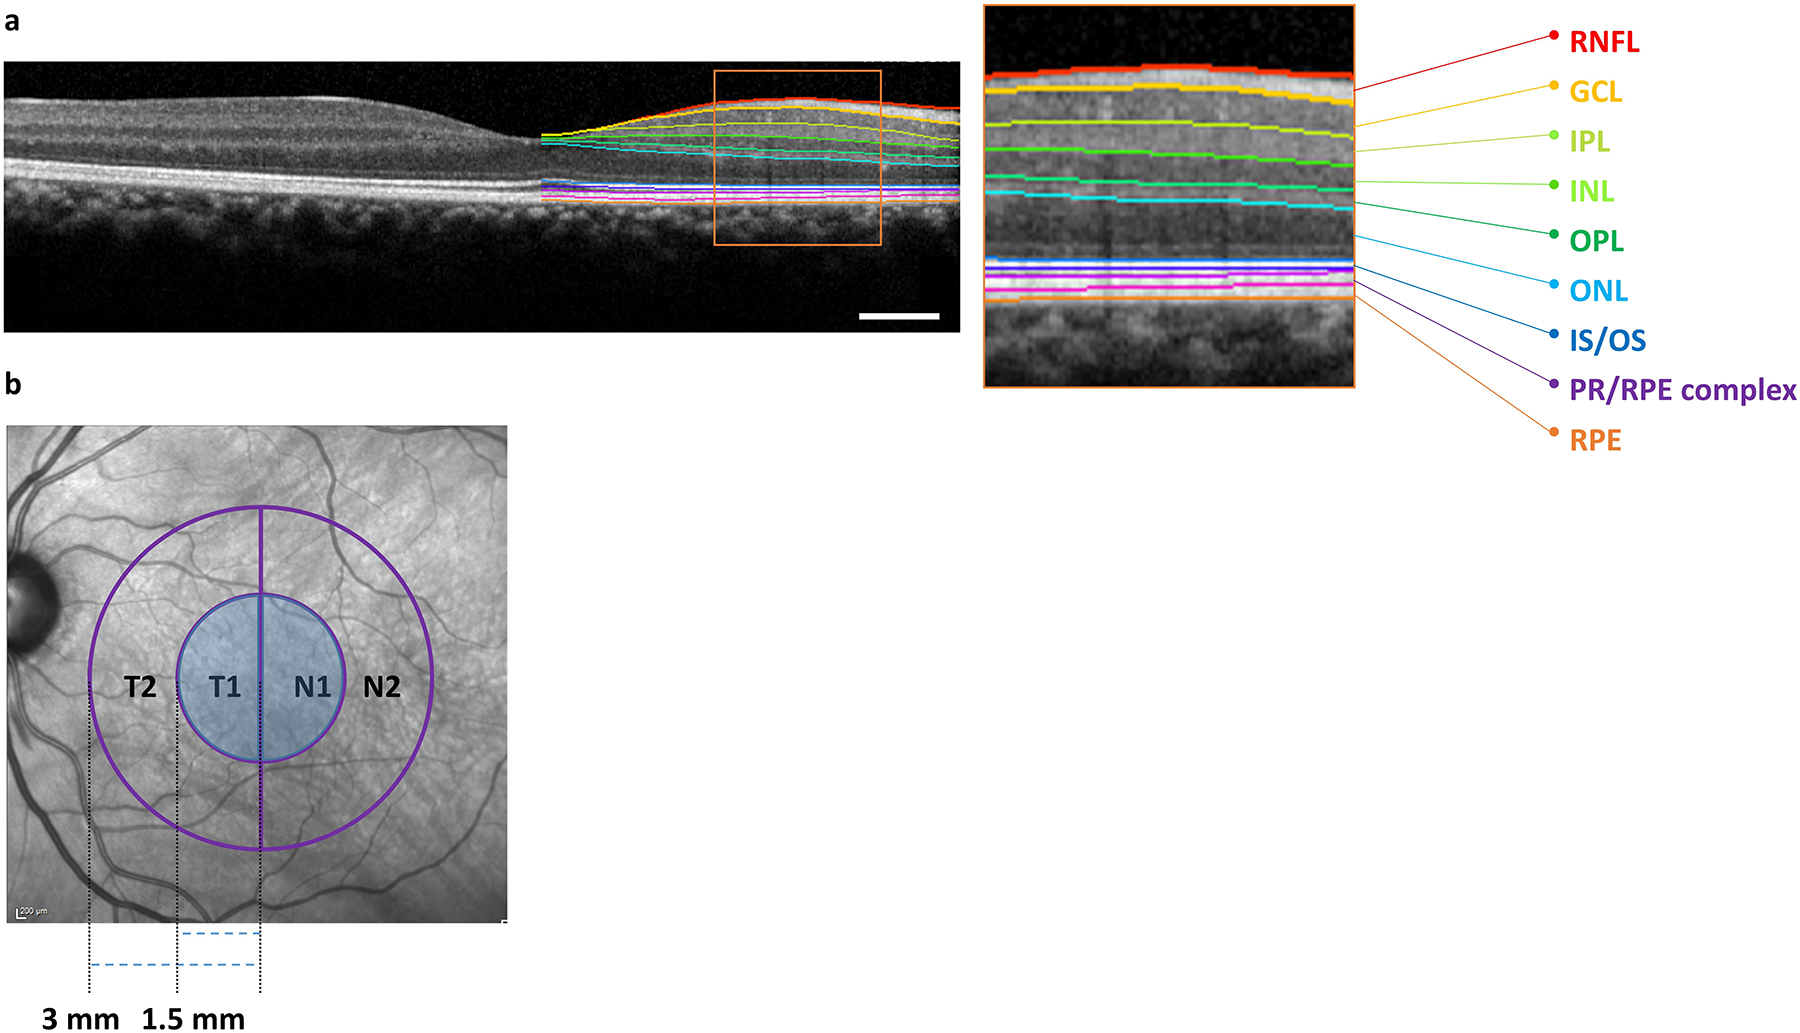
Spectral Domain Optical Coherence Tomography Imaging and Analyses Paradigm. (A) Illustration of retinal layer segmentation overlayed on a macular OCT scan. The region inside the orange box in the figure is enlarged to better visualize the individual retinal layers. The colored lines on the image allow visualization of native layer boundaries from top to bottom in order: retinal nerve fiber layer (RNFL), ganglion cell layer (GCL), inner plexiform layer (IPL), inner nuclear layer (INL), outer plexiform layer (OPL), outer nuclear layer (ONL), inner segment-outer segment junction (IS/OS), photoreceptor and retinal pigment epithelium (RPE) complex, and RPE. The RNFL, GCL, IPL, and ONL boundaries were used in this study; Scale bar: 0.50 mm. (B) Illustration of the modified ETDRS grid (hereafter called rETDRS) that respects the retinotopic organization of RGC. The rETDRS grid was divided into inner nasal (N1) and temporal (T1) and corresponding outer N2 and T2 halves. Retinal thickness measurements from regions labeled T1 and N1 (shaded regions) were used.
2.4. Diffusion tensor imaging (DTI)
2.4.1. MRI acquisition
MRI was acquired on a 3T Prisma scanner (32-channel head coil) following a Human Connectome Project protocol34. T1-weighted MRI was acquired with the magnetization prepared gradient-echo (MPRAGE) sequence with a duration of 6:38 min. Each diffusion MRI (dMRI) was acquired with two opposite phase encoding directions (anterior to posterior and posterior to anterior) and from 98 gradient directions over two shells with b-values 1500 and 3000 s/mm2. Each dMRI image has a size of 140×140×92 and an isotropic spatial resolution of 1.5mm.
2.4.2. Image processing
T1-weighted and dMRI images were processed with HCP-pipeline version 4.3.0. The lateral geniculate nuclei (LGN) was automatically segmented with the thalamic segmentation algorithm42 from FreeSurfer version 7.1.1 and was used as the inclusion ROI. The LGN mask was transformed to dMRI image space with a linear registration between the T1-weighted and dMRI image.
With the MNI152 template as the reference image, a semi-optic-chiasm mask from the tail of the optic tract to the optic chiasm was manually delineated for each hemisphere for optic tract reconstruction. To exclude extra bundles during the fiber tracking procedure, a four slices square mask in the mid-brain area in the coronal view of MNI152 template was also manually drawn.
By registering the T1-weighted MRI and MNI152 template using the ANTS software,43 we transformed the left and right semi-optic-chiasm mask together with the exclusion square mask into the T1-weighted image space of each subject. After that, these masks were transformed to the dMRI image space with the linear transformation obtained from the previous step. To ensure the LGN mask adequately covered the optic tract, a dilation with a sphere kernel size of 2 was applied.
The optic tract streamlines for each hemisphere were finally reconstructed separately with the software for probabilistic parallel transport tractography44. The average values of diffusivity measures for each tract were then calculated for statistical analyses, including fractional anisotropy (FA), mean diffusivity (MD), radial diffusivity (RD), and axial diffusivity (AxD).
2.5. Adjusted-Age
The age of disease onset in ADAD varies between mutations but is relatively consistent within a mutation. Therefore, it is useful to standardize subject age with regards to their mutation-specific age of disease onset using adjusted-age19. Adjusted-age is a measure of estimated years until or since diagnosis of dementia. For subjects meeting criteria for dementia, adjusted-age was the age on the date of imaging minus the age of initial diagnosis of dementia (or best estimate based on clinical information). For these subjects, adjusted-age was greater than or equal to zero. For subjects not yet meeting the criteria for dementia, adjusted-age was defined as age at the time of imaging minus the median age at which persons with the same mutation are diagnosed with dementia. For these participants, adjusted-age was less than zero.
2.6. Statistical analysis
2.6.1. Non-retinotopic Analysis
We initially examined the correlation between retinal thickness and DTI measures of optic tract integrity without regard to retinotopic organization of the visual system. In this analysis, a multivariable generalized estimating equations (GEE) model was used where DTI measures (FA, MD, RD, AxD) of both optic tracts was the dependent variable and the mean full thickness and sublayer thickness (ONL, GCL, IPL, and GCIPL) values of both retina were independent variables. P < 0.05 was statistically significant for all analyses. SAS (version 9.4; SAS Institute Inc.) was used for all analyses.
2.6.2. Retinotopic Analysis Using Modified ETDRS Grid with Retinal Halves
To more accurately account for the retinotopic organization of the retina, we used our modified rETDRS grid (Figure 1b) where retinal regions used to define thickness measures were divided in half with respect to the fovea (Figure 2). In this GEE analysis, a DTI measure (FA, MD, AxD, RD) of one optic tract was the dependent variable and the full thickness and sublayer thickness (ONL, GCL, IPL and GCIPL) values of the corresponding retinotopically related retinae were the independent variables. The equations of the GEE model were as follows:
| (1) |
| (2) |
| (3) |
| (4) |
| (5) |
| (6) |
| (7) |
| (8) |
Where, R=right eye, L=Left eye, N=Nasal, T=Temporal and i=individual subject. β1, β2, β3 and β4 are estimate values. Similar equations were used for the other DTI measures (MD, AxD and RD). MD, RD and AxD values were multiplied by 10000 to scale with retinal thickness measures. The relationship between an individual optic tract and corresponding retinal halves is illustrated in Figure 2.
Figure 2:
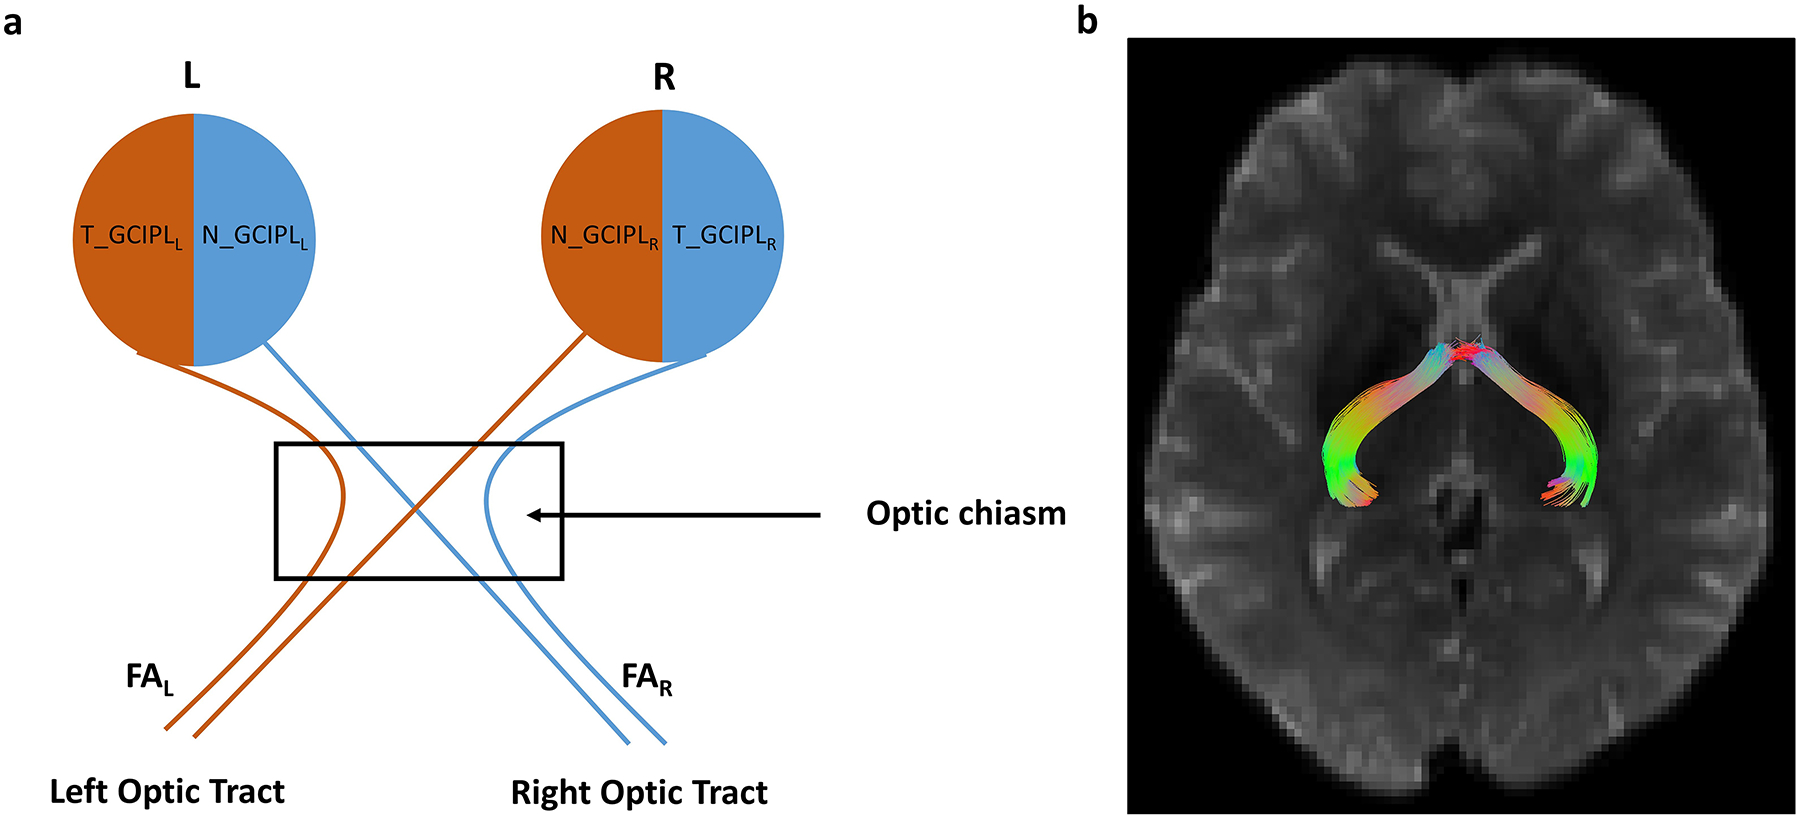
Schematic diagram of the visual system with variable labels. Panel (a) shows the schematic with variable names illustrating the association of left optic tract with the left temporal retina and right nasal retina and vice-versa. The nasal fiber decussation takes place at the optic chiasm. R = right eye, L = Left eye, N = Nasal, T = Temporal, GCIPL = Ganglion Cell Inner Plexiform Layer thickness. An analogous set of variables was used for all the other DTI measures (MD, RD, AxD) and other retinal and retinal sublayer thicknesses (RNFL, GCL, IPL, ONL). Panel (b) shows a representative tractography image showing the reconstructed optic tracts.
3. Results:
Data from 17 males and 10 females (n = 27, mean age 36.4±9.8) were available for analysis (Table 1). Twenty-three of the 27 subjects were ADAD mutation carriers and 4 were non-carriers. Non-carriers served as controls for some analyses as indicated below. Among the carriers, 18 had the A431E substitution in PSEN1, 2 had F388S substitution in PSEN1 and 3 had V717I mutation in APP. The mean adjusted-age for the cohort was −5.6±8.9. Eight of the carriers had CDR-SOB score of 0 (9 of the carriers had Global CDR score of 0) indicating they were in the prodromal stages of the disease (clinically asymptomatic).
Table 1.
Summary of subject characteristics
| Demographics | |||
|---|---|---|---|
| Number of subjects | 27 | ||
| Mutations (number of subjects affected) | A431E PSEN1 (18), V717I APP (3) F388S PSEN1 (2), No mutation (4) |
||
| Male Gender, n (%) | 17 (62.96%) | ||
| Age, mean±SD (Range) | 36.4±9.8 (22 to 57) years | ||
| Adjusted age, mean±SD (Range)a | −5.6±8.9 (−21 to +4) years | ||
| Retinal layer and sublayer thickness (mean ± standard deviation)b | |||
| Carriers | Non-carriers | All Subjects | |
| RNFL | 27.26±1.94 | 26.43±1.98 | 27.14±1.97 |
| GCL | 46.26±4.38 | 47.37±4.84 | 46.42±4.47 |
| IPL | 40.45±4.18 | 40.19±1.44 | 40.41±3.90 |
| GCIPL | 86.71±6.18 | 87.56±5.46 | 86.84±6.09 |
| ONL | 87.41±8.33 | 89.67±8.63 | 87.74±8.41 |
| Total retina | 337.66±13.56 | 337.62±8.40 | 337.65±12.93 |
| DTI measures (mean ± standard deviation)c | |||
| Carriers | Non-carriers | All Subjects | |
| FA | 0.3725±0.0340 | 0.3743±0.0115 | 0.3728±0.03 |
| MD (×10000) | 9.0941±0.4988 | 8.5582±0.1881 | 9.0147±0.50 |
| RD (×10000) | 7.2657±0.5492 | 6.8021±0.1014 | 7.1971±0.5344 |
| AxD (×10000) | 12.7508±0.5335 | 12.0704±0.3763 | 12.6500±0.5673 |
| CDR-SOB score for mutation carriers | |||
| CDR-SOB score range | Number of mutation carriers | ||
| 0 | 8 | ||
| 0.5–4.0 | 5 | ||
| 4.5–9.0 | 5 | ||
| 9.5–15.5 | 4 | ||
| 16.0–18.0 | 1 | ||
Note:
Adjusted-age is a measure of estimated years until or since diagnosis of dementia. For subjects meeting criteria for dementia, adjusted-age was the age on the date of imaging minus the age of initial diagnosis of dementia (or best estimate based on clinical information).
The unit of all the retinal layers thickness values is in microns (μm).
The unit of RD, MD and AxD is mm2/s; FA is unitless.
3.1. Univariate Association of Retinal Thickness with Adjusted-Age and Clinical Disease Severity
Adjusted-age, a measure of estimated years until or since diagnosis of dementia is a measure that tracks with clinical severity of ADAD. There was a significant univariate association between RNFL thickness and adjusted-age (R=0.31, P=0.03), and between GCIPL thickness and adjusted-age (R=−0.29, P=0.04) among mutation carriers (eFigure3). In contrast, the relationship between ONL thickness and adjusted-age was not significant (R=−0.14, P>0.05).
In order to further demonstrate if these associations were related to the clinical stage of ADAD, we examined the association of retinal thickness measures and CDR-SOB using a non-parametric test (eFigure 4). There was a significant association between GCIPL thickness and CDR-SOB (R=−0.43, P=0.04). However, the relationship between RNFL thickness and CDR-SOB (R=0.35, P>0.05), and between ONL thickness and CDR-SOB was not significant (R=−0.23, P>0.05).
These findings confirm that subclinical retinal changes are significantly associated with pre-clinical and clinical features of ADAD.
3.2. Univariate Association of Retinal Thickness with White Matter Integrity of Optic Tracts
Diffusion tensor imaging (DTI) studies have confirmed white matter changes in LOAD,27,28 and ADAD30,31. Therefore, we examined if there was an association between retinal thickness and white matter integrity of the optic tracts. Figure 3a–d illustrate these associations using the rETDRS grid described in Figure 1b and 2. In this analysis, the associations between GCIPL and MD and between GCIPL and AxD were significant (β=−0.0112, P=0.04; β=−0.0139, P=0.03 respectively). The associations between ONL and MD and between ONL and AxD were not significant (β=−0.0045, P>0.05; β=−0.0058, P>0.05 respectively) in either analysis. In contrast, the univariate association of DTI measures with GCIPL and ONL thickness using the standard ETDRS grid which do not accurately reflect the retinotopy of the visual system were less robust. In this latter analysis, only the association between GCIPL and MD was significant (β=−0.0247, P=0.04; see eFigure5).
Figure 3:
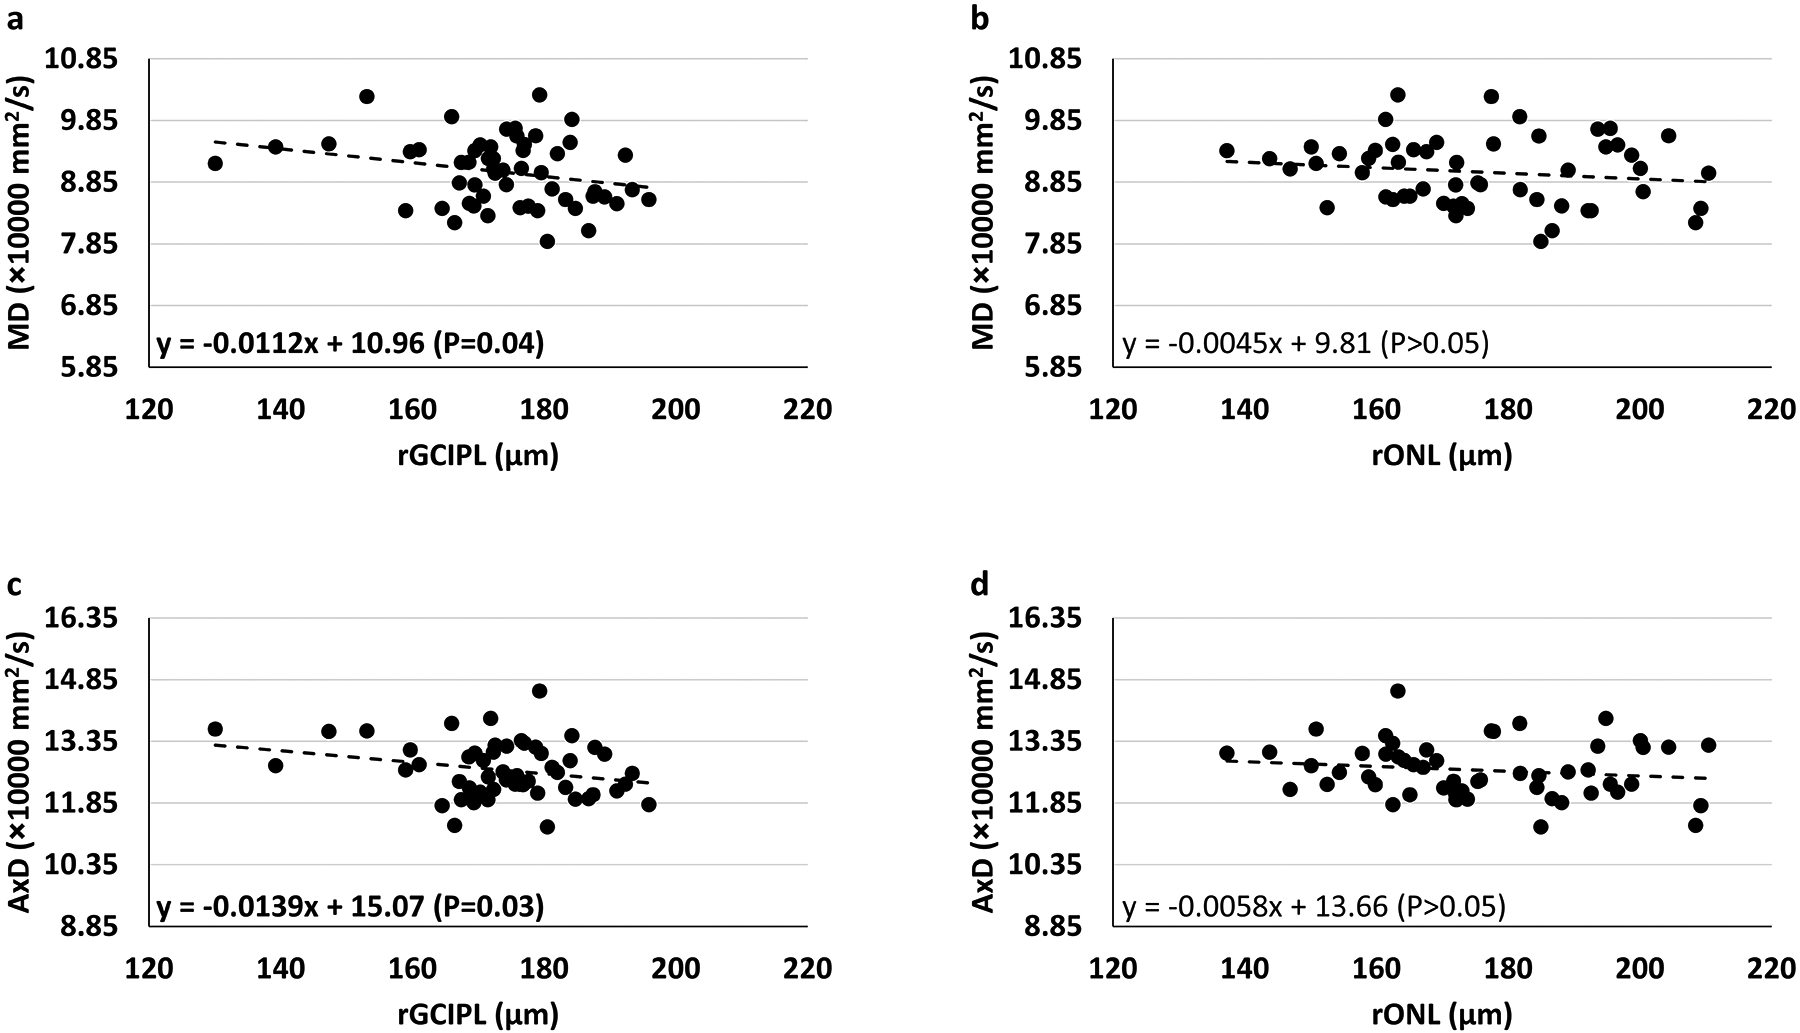
Univariate association of Mean Diffusivity (MD) and Axial Diffusivity (AxD) of the optic tract with retinal sublayer thickness with respect to retinotopic organization. The association between retinal thickness and DTI is represented by two points for each subject, one for each optic tract and corresponding retinal regions in each eye. In this analysis, the associations between GCIPL and MD, and GCIPL and AxD were significant. Other associations were insignificant (rGCIPL = retinotopically defined GCIPL, rONL = retinotopically defined ONL).
3.3. Multivariable Association of Overall Retinal Thickness and White Matter Integrity of Optic Tracts
We performed a multivariable analysis examining the association of retinal thickness measures from the standard ETDRS grid of both eyes with DTI measures from both optic tracts of each subject. In this analysis, the correlation between AxD and total retinal thickness was significant (β=−0.0147, P=0.01). There were also significant correlations between MD and GCIPL thickness (β=−0.0247, P=0.04), as well as RD and GCIPL thickness (β=−0.0258, P=0.04). None of the other correlations were significant (Table 2a). When adjusted-age was included as a covariate, only the correlation between AxD and total retinal thickness remained significant (β=−0.0116, P=0.02) suggesting that disease stage accounted for the previous significant correlations.
Table 2:
Multivariable generalized estimating equation analysis of retinal thickness and DTI measures
| a) Aggregate DTI measuresi
| ||||
|---|---|---|---|---|
| Fractional Anisotropy (FA) β-estimate (P-value) |
Radial Diffusivity (RD) β-estimate (P-value) |
Mean Diffusivity (MD) β-estimate (P-value) |
Axial Diffusivity (AxD) β-estimate (P-value) |
|
| RNFL | −0.0040 | 0.0466 | 0.0388 | 0.0233 |
| GCL | 0.0010 | −0.0276 | −0.0255 | −0.0211 |
| IPL | 0.0006 | −0.0266 | −0.0268 | −0.0271 |
| GCIPL | 0.0008 | −0.0258 (0.04) | −0.0247 (0.04) | −0.0225 |
| ONL | −0.0002 | −0.0063 | −0.0096 | −0.0162 |
| Total Retina | −0.0004 | −0.0049 | −0.0082 | −0.0147 (0.01) |
| b) Retinotopically defined DTI measuresii | ||||
| Fractional Anisotropy (FA) β-estimate (P-value) |
Radial Diffusivity (RD) β-estimate (P-value) |
Mean Diffusivity (MD) β-estimate (P-value) |
Axial Diffusivity (AxD) β-estimate (P-value) |
|
| RNFL | −0.0022 (0.04) | 0.0328 | 0.0207 | −0.0034 |
| GCL | 0.0003 | −0.0069 | −0.0096 | −0.0149 |
| IPL | 0.0003 | −0.0142 | −0.0138 | −0.0132 |
| GCIPL | 0.0003 | −0.0098 | −0.112 (0.04) | −0.0139 (0.02) |
| ONL | −0.0000 | −0.0039 | −0.0045 | −0.0058 |
| Total Retina | −0.0002 | −0.0015 | −0.0034 | −0.0071 (0.01) |
Note:
The unit of all the retinal layers thickness values is in microns (μm).
The unit of RD, MD and AxD is mm2/s; FA is unitless.
β-estimate value refers to the change in DTI measure for a unit change in retinal layer thickness
Bold = statistically significant with stated p-value. All non-bold p-values were >0.05.
retinal thickness values from the entire ETDRS grid and aggregate DTI measures of optic tract
retinal thickness values from retinotopically defined nasal and temporal halves of the rETDRS grid and corresponding DTI measures of optic tract
3.4. Multivariable Association of Retinotopically Defined Retinal Thickness and White Matter Integrity of Optic Tracts
To more accurately account for the retinotopic organization of the retina, we used retinal thickness measures from the rETDRS grid (Figure 1b). In this analysis, there was also a significant negative correlation between AxD and total retinal thickness (β=−0.0071, P=0.01). In addition, there were more robust and significant negative correlations between MD and AxD of the optic tracts and GCIPL thickness (β=−0.112, P=0.04 and β=−0.0139, P=0.02, respectively). This analysis also revealed a significant negative correlation between FA and RNFL thickness (β=−0.0022, P=0.04; see eFigure6). The correlation between the ONL thickness and DTI measures as well as all other correlations were not significant (P>0.05; Table 2b). When adjusted-age was included as a covariate, only the correlations between AxD and retinal thickness, and FA and retinal thickness remained significant (β=−0.065, P=0.01 and β=−0.0003, P=0.03 respectively), albeit with much reduced magnitude. This suggests that disease stage was at least partly responsible for the previous significant correlations. Similar analysis using a standard ETDRS grid is shown in eTable 1.
3.5. Retinal Thickness Measures in Subjects with ADAD-causing Mutations are Abnormal
Our study is limited by the small number of family-matched controls for subjects at risk for ADAD since our consecutive recruitment included only 4 subjects (unaffected relatives of subjects) who were not carriers of any known mutations predisposing to ADAD. There was no statistically significant difference in the retinal thickness between these 4 subjects and the mutation carriers. When we removed these four subjects from the data set, the findings and significance of the results stay similar. To address the limited number of family-matched controls within our consecutively recruited cohort, we compared retinal thickness and sub-layer thickness between our cohort and a recently published cohort of Latinx subjects at risk for ADAD (PSEN1 E280A mutation) and unaffected family members23. These groups serve as good controls because of similarity in mean age, ethnicity and familial relationship to subjects with ADAD causing mutations. This analysis showed that there were significant differences in retinal thickness between the groups for most of the comparisons (eTable 2 and 3). Specifically, GCL and GCIPL thicknesses for participants in our study (PSEN1 or APP mutation carriers) were significantly lower than for the carriers of PSEN1 E280A and controls23. In addition, the RNFL values of subjects in this study were significantly greater than either carriers or controls from Armstrong et al23. This suggests that the subjects in our cohort were at least as severely affected by their mutations as those in Armstrong et al23.
4. Discussion:
In this study, we demonstrate the novel association between retinal layer and sublayer thickness with measures of optic tract integrity among a cohort of well-characterized subjects who carry mutations that are fully determinant for ADAD. In carriers of ADAD mutations, the development of disease is almost certain, the age of symptom onset is relatively young and predictable, and confounding comorbidities are minimal. This combination of characteristics allows a reasonably well-controlled examination between measures of retinal thickness, white matter integrity and features specific to ADAD17–19. We show that in subjects at risk for ADAD, there is a significant negative association between GCIPL thickness and adjusted-age (where adjusted-age is an estimate of years until or since diagnosis of dementia) and a significant negative association between GCIPL thickness and CDR-SOB, a measure of clinical disease stage. Furthermore, we demonstrate a significant negative association between integrity of the optic tracts (MD and AxD) and total retinal thickness that is driven predominantly by decreasing GCIPL thickness. This association was complemented by a similar negative, but not significant trend between RNFL thickness and optic tract FA. In contrast, there was no significant association between any DTI metrics and the ONL thickness. Lastly, we demonstrate that the association between retinal thickness measures and optic tract integrity is more robust when taking into account the retinotopic organization of the retinal ganglion cell projections to the optic tracts. Collectively, these retinal findings suggest that degenerative changes attributable to ADAD causing mutations are retinotopically associated with white matter changes during preclinical stages of the disease. This supports the hypothesis that early ADAD related degeneration of neurons is primarily due to some form of systematic neuronal degeneration (e.g. anterograde or retrograde) rather than independently distributed pockets of AD pathology scattered along white matter tracts and cell soma. This distinction may not be possible later in the disease process because chronic degeneration will ultimately result in atrophy of cell soma as well as distal processes. Our observations and methods in early ADAD related degeneration may serve as a novel biomarker to identify AD specific degeneration at its earliest stages.
We demonstrate a significant negative association between GCIPL thickness and adjusted-age. This is consistent with a considerable body of literature demonstrating thinning of the GCIPL (and RNFL) in subjects with MCI or LOAD7. The etiology of this thinning is unclear but may be illustrative of histopathologically demonstrated atrophy of the retinal ganglion cell bodies and dendrites7. Furthermore, our findings of a trend towards ONL thinning is also similar to those illustrated by Armstrong et al23. However, in our analysis, the association of ONL with adjusted-age is not significant. The similarity of the retinal thickness findings between Armstrong et al and our study supports the validity of the findings in this rare population of subjects and support the notion that subjects with ADAD and LOAD have similarities in retinal pathology23.
Interestingly, the association between RNFL thickness and adjusted-age is insignificant but positively trending in our study. Notably, Armstrong et al., also demonstrate increased RNFL thickness and a negative trend in GCIPL thickness when comparing subjects with ADAD causing mutations and non-mutation carrying controls23. It is not clear why RNFL thickness is increased in these subjects. Others have demonstrated variable thickness of the RNFL and GCL in LOAD45 and ADAD23 without a clear explanation. One possible explanation is that RNFL changes on OCT may reflect the accumulation of AD pathology in the proximal axons of ganglion cells46. There is significant histopathologic evidence of age-related as well as pathologic amyloid and tau accumulation in the inner plexiform layer, ganglion cell bodies and RNFL5,47–50. This process may be accelerated in subjects with mutations predisposing to ADAD and may serve as a useful biomarker of disease. Our recent findings of increased retinal blood flow in the superficial retinal layer in early stages of ADAD are also consistent with inflammation secondary to this possibility50,51.
We also demonstrate that there is a significant negative association between total retinal thickness and measures of optic tract white matter integrity that is driven by the association of GCIPL thickness with mean diffusivity (MD) and axial diffusivity (AxD). This association is most robust when taking into account the retinotopic organization of the optic tracts and retinal thickness measurements. We performed two retinal thickness analyses to explore this association. In one analysis, we used the standard ETDRS fields (quadrants) to measure retinal thickness and sublayer thickness (eFigures 1 and 2). These standard ETDRS fields under-represent the retinotopic organization of the ganglion cells because they do not include portions of the superior and inferior retinal hemifields. To account for this, we created a modified ETDRS grid with retinal hemifields that accurately represent the retinotopic organization of the retina (rETDRS, Figure 1). In this retinotopically accurate analysis, the association between total retinal thickness and GCIPL thickness is more robust and significant (Table 2a versus 2b).
Our study demonstrates a novel methodology to simultaneously measure the thickness of retinal layers provided by OCT and the integrity of the corresponding retinotopically associated optic tracts with DTI. This allows us to directly interrogate the status of neuronal cell bodies as well as their proximal and distal projections in vivo in humans. The retinotopically defined correlations between GCIPL thickness and measures of the integrity of their corresponding axonal projections in ADAD suggests that the loss of neuronal cell bodies in the GCIPL is reflected by anterograde degeneration in the optic tract rather than independently distributed AD related degeneration throughout the visual system.46
Our study does have limitations. As our study is observational and cross-sectional, it is conceivable that axonal degeneration is the primary event or that there are separate, though parallel processes affecting the retina and optic tracts independently. That the observed relationships were strongest in the ganglion cell layer (giving rise to the projections in the optic tract) and particularly when the analyses were done in a manner respecting the retinotopy strongly argues against this latter possibility. As the goal of our study was to understand changes in connectivity occurring in ADAD, we did not obtain amyloid positron emission tomography (PET) scans nor cerebrospinal fluid measures. Such measures are informative regarding disease stage but as our genetically defined population has a known and absolute risk of developing AD in a very predictable manner we believe the data support our conclusions. Lastly, there were not large numbers of controls available from the immediate family members of our cohort. In order to account for this, we used data available from a very well-described cohort of subjects with similar genetic risk for ADAD that was recently published. This data was synergistic with our own findings both in terms of retinal findings and served as a control population for confirmation of the significance of some of our findings. Additional longitudinal studies are underway and will expand these findings.
In conclusion, we demonstrate for the first time in vivo, that there is a significant and predictable retinotopic association between retinal thickness measures and MRI-based measures of optic tract integrity in ADAD. Our findings are consistent with pathologic changes of ADAD mutations within retinal ganglion cells being reflected in their axonal projections. These changes may be degenerative or inflammatory at this early stage of disease. This in vivo imaging association may be relevant in identifying AD specific patterns of degeneration in LOAD and in understanding the pattern of neurodegeneration in AD in general.
Supplementary Material
Funding:
This study was supported by grants from the NIH: UH3NS100614 (AHK, JMR, DW), R01AG062007 (JMR), U01AG051218 (JMR), Helene and Lou Galen Professorship (JMR), P30AG066530 (H. Chui), Bright Focus Foundation CA2020004 (AHK), unrestricted departmental funding from Research to Prevent Blindness (New York, NY, USA), and research grants from Carl Zeiss Meditec Inc (Dublin, CA, USA). However, Carl Zeiss Meditec, Inc was not consulted in the design, implementation, or analysis of the study data.
Commercial Relationship Disclosure:
JMR is a DMC member of Renew Group Private Limited and a consultant for InnoSense. Carl Zeiss Meditec has provided grant funding, equipment, and financial support to AHK. No commercial relationships to declare for rest of the authors.
Footnotes
Consent Statement: All the subjects provided an informed consent before they were enrolled in the study.
References:
- 1.Prince M, Bryce R, Albanese E, Wimo A, Ribeiro W, Ferri CP. The global prevalence of dementia: a systematic review and metaanalysis. Alzheimers Dement. 2013;9(1):63–75.e2. [DOI] [PubMed] [Google Scholar]
- 2.Blanks JC, Torigoe Y, Hinton DR, Blanks RH. Retinal degeneration in the macula of patients with Alzheimer’s disease. Ann N Y Acad Sci. 1991;640:44—46. [DOI] [PubMed] [Google Scholar]
- 3.Blanks JC, Hinton DR, Sadun AA, Miller CA. Retinal ganglion cell degeneration in Alzheimer’s disease. Brain Res. 1989;501(2):364–372. [DOI] [PubMed] [Google Scholar]
- 4.Hinton DR, Sadun AA, Blanks JC, Miller CA. Optic-nerve degeneration in Alzheimer’s disease. N Engl J Med. 1986;315(8):485–487. [DOI] [PubMed] [Google Scholar]
- 5.den Haan J, Morrema THJ, Verbraak FD, et al. Amyloid-beta and phosphorylated tau in post-mortem Alzheimer’s disease retinas. Acta Neuropathol Commun. 2018;6(1):147. [DOI] [PMC free article] [PubMed] [Google Scholar]
- 6.Koronyo Y, Biggs D, Barron E, et al. Retinal amyloid pathology and proof-of-concept imaging trial in Alzheimer’s disease. JCI insight. 2017;2(16). [DOI] [PMC free article] [PubMed] [Google Scholar]
- 7.La Morgia C, Ross-Cisneros FN, Koronyo Y, et al. Melanopsin retinal ganglion cell loss in Alzheimer disease. Ann Neurol. 2016;79(1):90–109. [DOI] [PMC free article] [PubMed] [Google Scholar]
- 8.Koronyo-Hamaoui M, Koronyo Y, Ljubimov AV, et al. Identification of amyloid plaques in retinas from Alzheimer’s patients and noninvasive in vivo optical imaging of retinal plaques in a mouse model. Neuroimage. 2011;54 Suppl 1:S204–17. [DOI] [PMC free article] [PubMed] [Google Scholar]
- 9.Koronyo Y, Rentsendorj A, Mirzaei N, et al. Retinal pathological features and proteome signatures of Alzheimer’s disease. Acta Neuropathol. February 2023. [DOI] [PMC free article] [PubMed] [Google Scholar]
- 10.Chan VTT, Sun Z, Tang S, et al. Spectral-Domain OCT Measurements in Alzheimer’s Disease: A Systematic Review and Meta-analysis. Ophthalmology. 2019;126(4):497–510. [DOI] [PMC free article] [PubMed] [Google Scholar]
- 11.Snyder PJ, Alber J, Alt C, et al. Retinal imaging in Alzheimer’s and neurodegenerative diseases. Alzheimers Dement. 2021;17(1):103–111. [DOI] [PMC free article] [PubMed] [Google Scholar]
- 12.Alber J, Arthur E, Sinoff S, et al. A recommended “minimum data set” framework for SD-OCT retinal image acquisition and analysis from the Atlas of Retinal Imaging in Alzheimer’s Study (ARIAS). Alzheimer’s Dement (Amsterdam, Netherlands). 2020;12(1):e12119. [DOI] [PMC free article] [PubMed] [Google Scholar]
- 13.Iqbal K, Grundke-Iqbal I. Mechanism of Alzheimer neurofibrillary degeneration and the formation of tangles. Mol Psychiatry. 1997;2(3):178–180. [DOI] [PubMed] [Google Scholar]
- 14.Takeda S Tau Propagation as a Diagnostic and Therapeutic Target for Dementia: Potentials and Unanswered Questions. Front Neurosci. 2019;13:1274. [DOI] [PMC free article] [PubMed] [Google Scholar]
- 15.Braak H, Del Tredici K. Alzheimer’s pathogenesis: is there neuron-to-neuron propagation? Acta Neuropathol. 2011;121(5):589–595. [DOI] [PubMed] [Google Scholar]
- 16.Neuner SM, Tcw J, Goate AM. Genetic architecture of Alzheimer’s disease. Neurobiol Dis. 2020;143:104976. [DOI] [PMC free article] [PubMed] [Google Scholar]
- 17.Bateman RJ, Xiong C, Benzinger TLS, et al. Clinical and Biomarker Changes in Dominantly Inherited Alzheimer’s Disease. N Engl J Med. 2012;367(9):795–804. [DOI] [PMC free article] [PubMed] [Google Scholar]
- 18.Ringman JM, Younkin SG, Pratico D, et al. Biochemical markers in persons with preclinical familial Alzheimer disease. Neurology. 2008;71(2):85–92. [DOI] [PubMed] [Google Scholar]
- 19.Ryman DC, Acosta-Baena N, Aisen PS, et al. Symptom onset in autosomal dominant Alzheimer disease: a systematic review and meta-analysis. Neurology. 2014;83(3):253–260. [DOI] [PMC free article] [PubMed] [Google Scholar]
- 20.Ringman JM, Goate A, Masters CL, et al. Genetic heterogeneity in Alzheimer disease and implications for treatment strategies. Curr Neurol Neurosci Rep. 2014;14(11):499. [DOI] [PMC free article] [PubMed] [Google Scholar]
- 21.Ringman JM, Monsell S, Ng DW, et al. Neuropathology of Autosomal Dominant Alzheimer Disease in the National Alzheimer Coordinating Center Database. J Neuropathol Exp Neurol. 2016;75(3):284–290. [DOI] [PMC free article] [PubMed] [Google Scholar]
- 22.Morris JC, Weiner M, Xiong C, et al. Autosomal dominant and sporadic late onset Alzheimer disease share a common in vivo pathophysiology. Brain. May 2022. [DOI] [PMC free article] [PubMed] [Google Scholar]
- 23.Armstrong GW, Kim LA, Vingopoulos F, et al. Retinal Imaging Findings in Carriers With PSEN1-Associated Early-Onset Familial Alzheimer Disease Before Onset of Cognitive Symptoms. JAMA Ophthalmol. 2021;139(1):49–56. [DOI] [PMC free article] [PubMed] [Google Scholar]
- 24.Kashani AH, Asanad S, Chan JW, et al. Past, present and future role of retinal imaging in neurodegenerative disease. Prog Retin Eye Res. 2021;83:100938. [DOI] [PMC free article] [PubMed] [Google Scholar]
- 25.Kupfer C, Chumbley L, Downer JC. Quantitative histology of optic nerve, optic tract and lateral geniculate nucleus of man. J Anat. 1967;101(Pt 3):393–401. [PMC free article] [PubMed] [Google Scholar]
- 26.Taskin HO, Qiao Y, Sydnor VJ, et al. Retinal ganglion cell endowment is correlated with optic tract fiber cross section, not density. Neuroimage. 2022;260:119495. [DOI] [PMC free article] [PubMed] [Google Scholar]
- 27.Asanad S, Ross-Cisneros FN, Nassisi M, Barron E, Karanjia R, Sadun AA. The Retina in Alzheimer’s Disease: Histomorphometric Analysis of an Ophthalmologic Biomarker. Invest Ophthalmol Vis Sci. 2019;60(5):1491–1500. [DOI] [PMC free article] [PubMed] [Google Scholar]
- 28.Caso F, Agosta F, Filippi M. Insights into White Matter Damage in Alzheimer’s Disease: From Postmortem to in vivo Diffusion Tensor MRI Studies. Neurodegener Dis. 2016;16(1–2):26–33. [DOI] [PubMed] [Google Scholar]
- 29.Alm KH, Bakker A. Relationships Between Diffusion Tensor Imaging and Cerebrospinal Fluid Metrics in Early Stages of the Alzheimer’s Disease Continuum. J Alzheimers Dis. 2019;70(4):965–981. [DOI] [PMC free article] [PubMed] [Google Scholar]
- 30.Ringman JM, O’Neill J, Geschwind D, et al. Diffusion tensor imaging in preclinical and presymptomatic carriers of familial Alzheimer’s disease mutations. Brain. 2007;130(Pt 7):1767–1776. [DOI] [PubMed] [Google Scholar]
- 31.Sánchez-Valle R, Monté GC, Sala-Llonch R, et al. White Matter Abnormalities Track Disease Progression in PSEN1 Autosomal Dominant Alzheimer’s Disease. J Alzheimers Dis. 2016;51(3):827–835. [DOI] [PubMed] [Google Scholar]
- 32.Raj D, Yin Z, Breur M, et al. Increased White Matter Inflammation in Aging- and Alzheimer’s Disease Brain. Front Mol Neurosci. 2017;10:206. [DOI] [PMC free article] [PubMed] [Google Scholar]
- 33.Lee S, Zimmerman ME, Narkhede A, et al. White matter hyperintensities and the mediating role of cerebral amyloid angiopathy in dominantly-inherited Alzheimer’s disease. PLoS One. 2018;13(5):e0195838. [DOI] [PMC free article] [PubMed] [Google Scholar]
- 34.Van Essen DC, Smith SM, Barch DM, Behrens TEJ, Yacoub E, Ugurbil K. The WU-Minn Human Connectome Project: an overview. Neuroimage. 2013;80:62–79. [DOI] [PMC free article] [PubMed] [Google Scholar]
- 35.Murrell J, Ghetti B, Cochran E, et al. The A431E mutation in PSEN1 causing familial Alzheimer’s disease originating in Jalisco State, Mexico: an additional fifteen families. Neurogenetics. 2006;7(4):277–279. [DOI] [PMC free article] [PubMed] [Google Scholar]
- 36.Yescas P, Huertas-Vazquez A, Villarreal-Molina MT, et al. Founder effect for the Ala431Glu mutation of the presenilin 1 gene causing early-onset Alzheimer’s disease in Mexican families. Neurogenetics. 2006;7(3):195–200. [DOI] [PubMed] [Google Scholar]
- 37.Goate A, Chartier-Harlin MC, Mullan M, et al. Segregation of a missense mutation in the amyloid precursor protein gene with familial Alzheimer’s disease. Nature. 1991;349(6311):704–706. [DOI] [PubMed] [Google Scholar]
- 38.Hughes CP, Berg L, Danziger WL, Coben LA, Martin RL. A new clinical scale for the staging of dementia. Br J Psychiatry. 1982;140:566–572. [DOI] [PubMed] [Google Scholar]
- 39.Gmbh HE. Spectralis Spectralis HRA + OCT Spectralis HRA Spectralis OCT Hardware Operating Instructions. 2007;(19963):1–27. [Google Scholar]
- 40.Garvin MK, Abràmoff MD, Wu X, Russell SR, Burns TL, Sonka M. Automated 3-D intraretinal layer segmentation of macular spectral-domain optical coherence tomography images. IEEE Trans Med Imaging. 2009;28(9):1436–1447. [DOI] [PMC free article] [PubMed] [Google Scholar]
- 41.Röhlig M, Stüwe J, Schmidt C, Prakasam RK, Stachs O, Schumann H. Grid-based exploration of OCT thickness data of intraretinal layers. VISIGRAPP 2019 - Proc 14th Int Jt Conf Comput Vision, Imaging Comput Graph Theory Appl. 2019;3:129–140. [Google Scholar]
- 42.Iglesias JE, Insausti R, Lerma-Usabiaga G, et al. A probabilistic atlas of the human thalamic nuclei combining ex vivo MRI and histology. Neuroimage. 2018;183:314–326. [DOI] [PMC free article] [PubMed] [Google Scholar]
- 43.Avants BB, Tustison NJ, Song G, Cook PA, Klein A, Gee JC. A reproducible evaluation of ANTs similarity metric performance in brain image registration. Neuroimage. 2011;54(3):2033–2044. [DOI] [PMC free article] [PubMed] [Google Scholar]
- 44.Aydogan DB, Shi Y. Parallel Transport Tractography. IEEE Trans Med Imaging. 2021;40(2):635–647. [DOI] [PMC free article] [PubMed] [Google Scholar]
- 45.Lad EM, Mukherjee D, Stinnett SS, et al. Evaluation of inner retinal layers as biomarkers in mild cognitive impairment to moderate Alzheimer’s disease. PLoS One. 2018;13(2):e0192646. [DOI] [PMC free article] [PubMed] [Google Scholar]
- 46.Braak H, Del Tredici K. The pathological process underlying Alzheimer’s disease in individuals under thirty. Acta Neuropathol. 2011;121(2):171–181. [DOI] [PubMed] [Google Scholar]
- 47.Löffler KU, Edward DP, Tso MO. Immunoreactivity against tau, amyloid precursor protein, and beta-amyloid in the human retina. Invest Ophthalmol Vis Sci. 1995;36(1):24–31. [PubMed] [Google Scholar]
- 48.Leger F, Fernagut P-O, Canron M-H, et al. Protein aggregation in the aging retina. J Neuropathol Exp Neurol. 2011;70(1):63–68. [DOI] [PubMed] [Google Scholar]
- 49.Schön C, Hoffmann NA, Ochs SM, et al. Long-term in vivo imaging of fibrillar tau in the retina of P301S transgenic mice. PLoS One. 2012;7(12):e53547. [DOI] [PMC free article] [PubMed] [Google Scholar]
- 50.Grimaldi A, Pediconi N, Oieni F, et al. Neuroinflammatory Processes, A1 Astrocyte Activation and Protein Aggregation in the Retina of Alzheimer’s Disease Patients, Possible Biomarkers for Early Diagnosis. Front Neurosci. 2019;13:925. [DOI] [PMC free article] [PubMed] [Google Scholar]
- 51.Singer MB, Ringman JM, Chu Z, et al. Abnormal retinal capillary blood flow in autosomal dominant alzheimer’s disease. Alzheimer’s Dement Diagnosis, Assess Dis Monit. 2021;13(1):1–9. [DOI] [PMC free article] [PubMed] [Google Scholar]
Associated Data
This section collects any data citations, data availability statements, or supplementary materials included in this article.