

Abstract

Aqueous–organic solvent mixtures are commonly used for reactions or analyses, where the components of a system are insoluble in pure water. The acid dissociation constant is an important property to measure in these media as it determines the charge state, solubility, and reactivity of a molecule. While NMR spectroscopy is an established tool for the measurement of pKa in water, its use in aqueous–organic solvents is greatly hindered by the requirement for external calibrants on which a working pH scale is set. Such calibrants include buffer solutions, “anchor” molecules with known pKa values, and pH electrodes that have undergone lengthy calibration procedures in the solvent mixture of interest. However, such calibrations are often inconvenient to perform, while literature pKa data covering the required range may not be available at the solvent composition or the temperature of interest. Here, we present a method to determine pKa in aqueous–organic solvents directly by NMR. We first determine pKa of an organic acid such as 2,6-dihydroxybenzoic acid (2,6-DHB) by measuring its 1H chemical shift as a function of concentration along a concentration gradient using chemical shift imaging (CSI). Using 2,6-DHB as a reference, we then determine pKa of less acidic molecules in single CSI experiments via the variation of their 1H chemical shifts along pH gradients. As proof of concept, we determine the pKa values of organic acids and bases up to pKa 10 in 50% (v/v) 1-propanol/water, 50% (v/v) dimethyl sulfoxide/water, and 30% (v/v) acetonitrile/water and obtain good agreement with the literature values.
Introduction
Mixtures of water and organic solvents are commonly used as media for analytical procedures,1 synthetic reactions,2 and work with biological tissues.3 The properties of these mixtures differ from those of the pure solvents, allowing modulation of the polarity, viscosity, and freezing point via the solvent composition.3 These properties in turn modulate the solubility,4 acidity/basicity,5 and reactivity2 of the dissolved molecules. The acid dissociation constant of an organic molecule (Ka, normally expressed as the negative logarithm, pKa) is very sensitive to the solvent composition and can be changed by more than one log unit relative to its aqueous value by inclusion of 50 wt % of an organic solvent.6–8 Literature data are only available in a small number of solvent mixtures, while extrapolations of pKa between different solvent mixtures are only possible within narrow classes of compounds and require reliable reference data.9,10 For these reasons, it is often necessary to measure the pKa values of organic molecules experimentally when working in aqueous–organic solvents.
The electrochemical measurement of pH requires careful calibration of electrodes5 either using solutions of known pH in the solvent mixture of interest11–14 or by applying a specific correction to the pH reported by an electrode that has been calibrated using conventional aqueous buffers.5,15 Alternatively, pH may be determined from the NMR chemical shifts or UV/vis spectra of compounds with known pKa values.8,16 However, electrode corrections and pKa data are only available in a small number of aqueous–organic mixtures.5,15 Finally, pKa values can be measured without knowledge of pH using conductometric methods.17 However, such approaches require high-purity materials, and only one compound may be analyzed per titration.
Here, we demonstrate how pKa values can be determined directly by 1H chemical shift imaging (CSI) NMR in mixtures of compounds, without the use of electrochemical measurements or literature pKa data. In our method, a concentration gradient of 2,6-dihydroxybenzoic acid (2,6-DHB) is established in an NMR tube by placing solid acid at the base of the tube and layering the solvent mixture of interest on top. Spatially resolved 1H spectra are recorded at different positions along the gradient using CSI and a pKa value extracted in a single experiment by analysis of how the 1H chemical shift of 2,6-DHB varies with concentration. The experiment is then repeated in the presence of 1,2,4-triazole and a pKa of this compound is determined, and the pKa of 2,6-DHB is verified by considering the degree of proton transfer from 2,6-DHB to triazole. The pKa values of organic molecules spanning pKa 3–10 are then determined relative to 1,2,4-triazole and 2,6-DHB, allowing the determination of pH between 1 and 12 from their 1H chemical shifts. We can, thus, establish a working set of indicator molecules to determine pH in an aqueous–organic mixture by running four 1H CSI experiments (Scheme 1). These indicators allow the pKa of organic molecules to be determined in single 20 min CSI experiments from the variation of their 1H chemical shift along the pH gradients.16,18
Scheme 1. Method to Determine pKa of Organic Molecules in Aqueous–Organic Mixtures Using CSI and Concentration Gradients of 2,6-DHB.

The 1H chemical shift of 2,6-DHB is measured as a function of concentration in the absence of base (a) and the presence of 40 mM 1,2,4-triazole (b) to determine the pKa of both compounds. The pKa values of other indicator molecules are determined relative to triazole and 2,6-DHB (c) allowing the determination of pH from their 1H chemical shifts and pKa of other organic molecules using pH gradients and CSI (d).
All experiments can be run under full automation on standard high-field NMR equipment, allowing for a convenient calibration of the indicators at the solvent composition and the temperature of interest. As proof of concept, we determine the pKa of a range of acids and bases in 50% (v/v) 1-propanol/water, 50% (v/v) dimethyl sulfoxide-d6 (DMSO)/water, and 30% (v/v) acetonitrile-d3 (CD3CN)/water at 298 K. The uncertainties in the fitted pKa values are less than 0.5 units in most cases, while agreement with literature data is obtained within these uncertainties. While NMR is an established tool to determine the relative pKa values of organic molecules,19 to the best of our knowledge, the direct measurement of absolute pKa by NMR has not previously been described. All processing can be performed using the automation routines provided in Section S10 of the Supporting Information and the spreadsheet accompanying this work.
Experimental Section
Materials
All reagents were purchased from commercial suppliers and used as received. Phthalic acid was used as the monopotassium salt; otherwise, Na+ was the counterion in all experiments. Milli-Q water (18.2 MΩ cm) was used throughout the study. The DMSO-d6 and CD3CN had deuteration levels of 99.8 and 99%, respectively. The 50% (v/v) 1-propanol/H2O mixture was prepared by combining D2O (10 mL), H2O (40 mL), and 1-propanol (50 mL).
Preparation of Samples
Solid 2,6-DHB was transferred to the base of 5 mm NMR tubes (Wilmad 528-PP) by pushing the tip of a 9 in. Pasteur pipet into the solid acid and emptying the tip at the base of the NMR tube. Four, 2 mm diameter glass beads were placed on top of the 2,6-DHB. Prior to use, the beads were rinsed with ethanol and dried. A solution containing indicators, organic analyte molecules, and DSS was layered slowly (10 s) on top of the beads up to a height of 40–45 mm from the base of the NMR tube. The sample was stood in the autosampler rack of the spectrometer (22 °C) prior to analysis. Samples for the determination of the pKa of 2,6-DHB and 1,2,4-triazole contained 10 mM DSS to act as a reference for the chemical shift and integration. Other experiments in 50% DMSO/H2O and 30% CD3CN/H2O were performed with 0.4 mM DSS, where only referencing of the chemical shift was required. All experiments in 50% 1-propanol/H2O were performed with 10 mM DSS due to the strong background solvent signal. No 2,6-DHB was included as an indicator, with the 1H signal arising from the acid diffusing up the NMR tube. Analytes were included as neutral bases or as sodium salts.
The time, t (hours), at which the gradient will have developed was
estimated based on the viscosity, η (mPa s), of the solvent
mixture as t = αη(Z02 – Zb2)/ln(Cb/C0). Zb is the height of the bottom of
the NMR-active region, and Z0 is the height
of the midpoint of our sample above the top of the 2,6-DHB (9 and
19 mm in our instrument, respectively, with the top of the acid lying
approximately 1–2 mm above the absolute base of the NMR tube—see
the photograph of freshly prepared sample on Scheme 1a). Cb and C0 are the concentrations at these positions.
α is calculated as 0.1 h mPa–1 s–1 mm–2 at 22 °C based on a self-diffusion coefficient
of 2,6-DHB in 50% 1-propanol/H2O of 2.8 × 10⁻¹⁰ m2 s–1 at 298 K (Section S2, Supporting Information). Acceptable gradients
are obtained at times calculated with the ratio Cb/C0 between 400 and 6, giving
theoretical concentrations (Ctop) less
than 2 mM at the top of the NMR active region (Ztop, 29 mm above 2,6-DHB in our instrument). The time windows
are, thus, 12–41, 14–47, and 4–13 h for 50% 1-propanol/H2O, 50% DMSO/H2O, and 30% CD3CN/H2O, respectively. The pKa,0 values
determined over these time windows agree within uncertainties (Section S2). For determination of the pKa,0 of imidazole (IM) in 50% 1-propanol/water,
where an excess of a much stronger base was present [20 mM of dimethylglycine
(DMG) Na salt] and only 32 points were collected in the CSI data set,
a more gentle pH gradient was employed where appreciable acid was
present at Ztop (Cb/Ctop = 20, t = 66 h). The mass, m, of 2,6-DHB is calculated based on the desired Cb as 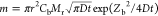 , where r is the tube radius
(2.1 mm), Mr is the molecular mass of
2,6-DHB (154.12 g/mol), and D is the diffusion coefficient
of 2,6-DHB. For determination of the pKa,0 of 2,6-DHB and triazole (Figure 1), 8–9 mg of 2,6-DHB was used, giving Cb between approximately 120 and 200 mM over
the time window. A total of 4–5 mg was used for calibration
of the other indicators (Table 1) and to determine the pKa of
the organic analytes (Table 2), unless otherwise stated, giving Cb between 60 and 100 mM. Cb is
chosen to provide an excess of 2,6-DHB over the base at Zb.
, where r is the tube radius
(2.1 mm), Mr is the molecular mass of
2,6-DHB (154.12 g/mol), and D is the diffusion coefficient
of 2,6-DHB. For determination of the pKa,0 of 2,6-DHB and triazole (Figure 1), 8–9 mg of 2,6-DHB was used, giving Cb between approximately 120 and 200 mM over
the time window. A total of 4–5 mg was used for calibration
of the other indicators (Table 1) and to determine the pKa of
the organic analytes (Table 2), unless otherwise stated, giving Cb between 60 and 100 mM. Cb is
chosen to provide an excess of 2,6-DHB over the base at Zb.
Figure 1.
Plot of 1H chemical shift of 2,6-DHB (solid symbols) vs C in the absence (a) and presence (b) of 40 mM 1,2,4-triazole in 50% 1-propanol/H2O (black diamond), 50% DMSO/H2O (red triangle), and 30% CD3CN/H2O (blue square). Solid lines are fits to eqs 1–4. 1H chemical shift of 1,2,4-triazole (open symbols). Fits to eq 7 (vertical cross) and eqs 2 and 8 (diagonal cross).
Table 1. pKa,0, δH, and δL for NMR Indicators.
| 50% 1-propanol/H2O |
50% DMSO/H2O |
30% CD3CN/H2O |
|||||||
|---|---|---|---|---|---|---|---|---|---|
| indicator | pKa,0 | δH/ppm | δL/ppm | pKa,0 | δH/ppm | δL/ppm | pKa,0 | δH/ppm | δL/ppm |
| 2,6-DHBa | 1.61 ± 0.29 | 6.4781 | 6.3113 | 1.02 ± 0.19 | 6.4911 | 6.3362 | 1.54 ± 0.40 | 6.4999 | 6.3680 |
| 1,2,4-triazole | 1.80 ± 0.36 | 9.2221 | 8.3164b | 1.77 ± 0.19 | 9.1934 | 8.3621b | 2.33 ± 0.41 | 9.1539 | 8.3278b |
| DMGc | 2.64 ± 0.21 | 4.0328 | 3.5755 | 2.45 ± 0.42 | 3.9985 | 3.6370 | |||
| salicylic acid | 3.33 ± 0.22 | 7.5679 | 7.3772 | ||||||
| glycolic acid | 4.47 ± 0.36 | 4.1722 | 3.9171d | 4.82 ± 0.30 | 4.0994 | 3.7583d | 4.43 ± 0.46 | 4.1716 | 3.8643d |
| acetic acid | 5.47 ± 0.38 | 2.0516 | 1.9160d | 5.72 ± 0.31 | 2.0293 | 1.8048d | 5.46 ± 0.54 | 2.0583 | 1.8485d |
| IM | 5.93 ± 0.44 | 8.7791 | 7.7155 | 6.61 ± 0.56 | 8.6442 | 7.7254 | |||
| 2MI | 6.87 ± 0.47 | 2.6227 | 2.3574 | 6.66 ± 0.35 | 2.5790 | 2.3181 | 7.56 ± 0.59 | 2.5717 | 2.3233 |
| 4CN | 8.54 ± 0.48 | 7.5160 | 7.2840 | 8.29 ± 0.37 | 7.6617 | 7.3510 | 8.44 ± 0.61 | 7.6370 | 7.4052 |
| DMG | 9.50 ± 0.50 | 2.9373e | 2.2328e | 9.45 ± 0.47 | 3.5870c | 2.8685c | 9.83 ± 0.69 | 3.6512c | 2.9289c |
pKa,0, δL, and δH obtained in the absence of 1,2,4-triazole using eqs 1–4, uncertainty obtained from experiment with 40 mM 1,2,4-triazole.
Average of δL determined in solution of triazole (40 mM) and DSS and in acidic range sample.
CH2 resonance of DMG.
Average of acidic and basic range samples in the absence of 2,6-DHB.
Methyl resonance of DMG.
Table 2. Comparison of pKa,0 of Analyte Molecules Determined by 1H CSI with Literature Values.
| 50%1-propanol/H2O |
50% DMSO/H2O |
30% CD3CN/H2O |
|||||||||
|---|---|---|---|---|---|---|---|---|---|---|---|
| analyte | indicator | pKa,0 NMR | pKa,0Lit | analyte | indicator | pKa,0 NMR | pKa,0 Lit | analyte | indicator | pKa,0 NMR | pKa,0Lit |
| salicylic acida | 2,6-DHB, triazole, glycolate, acetate | 4.12 ± 0.37 | 4.1717 | salicylic acida | 2,6-DHB, triazole, DMG, glycolate, acetate | 3.46 ± 0.21 | 3.488 | salicylic acida | 2,6-DHB, triazole, DMG, glycolate, acetate | 3.69 ± 0.42 | 3.43,27 3.74,28 3.9329 |
| benzoic acidb | 2,6-DHB, triazole, glycolate, acetate, 2MI | 5.52 ± 0.38 | 5.507 | benzoic acid | triazole, glycolate, acetate, 2MI | 5.25 ± 0.31 | 5.23,8 5.7330 | benzoic acid | triazole, glycolate, acetate, 2MI | 5.10 ± 0.49 | 4.78,31 5.10,29 5.2330 |
| picolinic acidb | 2,6-DHB, triazole, glycolate, acetate, 2MI | 1.85c, 5.29 ± 0.38 | 2.16,32 5.5232 | Besd | triazole, glycolate, acetate, 2MI | 6.72 ± 0.34 | 7.03,12 7.1833 | phthalic acid | triazole, glycolate, acetate, 2MI | 3.48 ± 0.43, 6.07 ± 0.51 | 3.41,6 3.46,1 6.531 |
| acetylacetone | IM, 2MI, DMG | 9.23 ± 0.50e | 9.7134 | 4CNf | 2MI, DMG | 8.25 ± 0.45 | 8.5635 | quinineg | DMG, glycolate, acetate, IM, 2MI, DMG | 3.55c, 8.35 ± 0.65 | 8.5436 |
| pipecolic acid | triazole, 2MI, DMG | 2.33c, 10.34 ± 0.50 | 2.87,32 10.4732 | d-valinef | 2MI, DMG | 3.29c, 9.29 ± 0.47 | 9.6737 | benzylamineh | DMG, 2MI, DMG | 8.89 ± 0.69 | 9.2636 |
Acidic-range data set.
8–9 mg of 2,6-DHB.
Sample also contained DMG sodium salt (2 mM), tricine (2 mM), formate (4 mM), and tert-butylamine (10 mM), which were found unsuitable for use as indicators. A total of 5–6 mg of 2,6-DHB.
Value corrected for enol-ketone tautomerization.
Sample also contained NaOH (10 mM), d-valine Na salt (2 mM), and 4CN sodium salt (20 mM).
Basic-range data set.
Sample contained NaOH (10 mM) in addition to indicators. A total of 3–4 mg of 2,6-DHB.
NMR
All experiments were performed at 298 K on a Bruker 500 MHz Avance III spectrometer, locking and shimming to D2O, DMSO-d6, or CD3CN. 1H chemical shift images were acquired using a gradient phase encoding sequence based on that of Trigo-Mouriño et al.20 For 50% 1-propanol/H2O, a spin-echo sequence (π/2–τ–π–gp acquire) was used, where gp is a magnetic field gradient pulse of 166 μs duration that was ramped from −8 to 8 G/cm in 32 steps. τ is a delay to balance the gradient pulse and gradient recovery delay (200 μs). π/2 was 10 μs. Eight scans were acquired at each gradient increment with a signal acquisition time and relaxation delay of 2.15 and 3.0 s, respectively, and a sweep width of 20 ppm. A spoil gradient pulse (600 μs, 25 G/cm) and recovery delay (200 μs) were executed before the π/2 pulse. The spoil and phase encoding gradient pulses were in the form of smoothed squares. Sixteen dummy scans were performed prior to signal acquisition, giving a total experimental time of 23 min 30 s. The vertical range of the CSI experiment (cnst0, Section S11) was set to 3.2 cm, giving a theoretical resolution of 1.0 mm.
Experiments in 50% DMSO/H2O and 30% CD3CN/H2O were performed with suppression of the H2O resonance using a CSI sequence incorporating excitation sculpting with perfect-echo21 (Bruker library, zgesgppe) and 4 ms Gaussian inversion pulses. To determine the pKa,0 of 2,6-DHB and 1,2,4-triazole, CSI data sets were collected with the same gradient, acquisition time, and relaxation delay described above for experiments in 50% 1-propanol/H2O. To determine the pKa values of other compounds in these solvents and acetylacetone in 50% 1-propanol/H2O, the encoding gradient pulse was ramped from −16.5 to 16.5 G/cm in 64 steps with a signal acquisition time and relaxation delay of 1.17 and 1.0 s giving a total experimental time of 19 min 38 s. The vertical range of the CSI experiment was set to 3.0 cm.
Data Processing
1H spectra and CSI data sets were processed with an exponential line broadening factor of 3 Hz and 64 K or 32 K points, respectively. CSI data sets were processed in phase-sensitive mode, with phase, baseline correction, and referencing to DSS (0 ppm) performed automatically using the scripts and routines described in Section S10, Supporting Information. Only rows 7–27 (32-point CSI data set) or 14–57 (64-point data set), covering the region approximately 11–31 mm from the base of the NMR tube, were used for analysis to avoid artifacts relating to off coil effects. Calculations are performed by the spreadsheet accompanying this work. The concentration of 2,6-DHB was determined from the integrals, h, of 2,6-DHB (3,5-position of aromatic ring) and DSS (methyl) as C = kh2,6-DHB/hDSS, where k = 44.0, 45.3, and 47.5 mM for 50% 1-propanol/H2O, 50% DMSO/H2O, and 30% CD3CN/H2O, respectively (Section S1, Supporting Information).
Results and Discussion
Determination of pKa of 2,6-DHB
We first determine the pKa of 2,6-DHB in the solvent mixture by layering a solution of sodium 3-(trimethylsilyl)-1-propanesulfonate (DSS, 10 mM) on top of 8–9 mg of 2,6-DHB. Dissolution and diffusion of the 2,6-DHB establishes a concentration gradient that can be predicted based on the viscosity of the solvent mixture (Section S2, Supporting Information). In the absence of other acids or bases, the fraction of 2,6-DHB in its deprotonated state, f, is given by eq 1
| 1 |
where Ka is concentration based and C is the total concentration of 2,6-DHB at each position along the sample. Assuming a fast exchange on the 1H NMR time scale, the chemical shift of 2,6-DHB, δDHB, is given by
| 2 |
where δH and δL are the limiting chemical shifts of the protonated and deprotonated states, respectively. C is obtained by integrating the 1H resonance of the 3,5-position of the aromatic ring of 2,6-DHB against the methyl resonance of DSS at each position along the sample using CSI. The molar ionic strength, I, of the solution at each position is calculated as the sum of the concentrations of DSS and dissociated 2,6-DHB. The activity coefficient of a univalent ion, γ, is obtained from eq 3
| 3 |
where A is taken as 1.32, 0.546, and 0.755 and B as 3.09, 2.22, and 4.45 for 50% 1-propanol/H2O, 50% DMSO/H2O, and 30% CD3CN/H2O, respectively (Section S3, Supporting Information).22–24 In the absence of activity data, ionic strength can be ignored (A = 0) and our method will yield pKa values uncorrected for ionic strength (Section S4, Supporting Information). The concentration-based Ka is calculated from the thermodynamic pKa (pKa,0) using eq 4
| 4 |
The pKa,0 of 2,6-DHB is obtained by fitting the chemical shift of the 3,5-position to eqs 1–4, with pKa,0, δH, and δL as free variables (Figure 1a). pKa,0 is obtained as 1.61, 1.02, and 1.54 in 50% 1-propanol/H2O, 50% DMSO/H2O, and 30% CD3CN/H2O, respectively, in agreement with 1.80 interpolated from the data of Papadopoulos and Avranas in 50% 1-propanol/H2O (Section S5, Supporting Information).17 Fitting the 4-position of 2,6-DHB yields the same pKa,0 (Section S6, Supporting Information).
Determination of pKa of 1,2,4-Triazole
To verify that the change in the 1H chemical shift of 2,6-DHB with concentration is due to dissociation, the experiment is repeated in the presence of 40 mM 1,2,4-triazole. The pH is calculated from eq 5 using the values of pKa,0, δH, and δL determined for 2,6-DHB in the absence of triazole.
| 5 |
The ionic strength is calculated from the 1H chemical shift of 2,6-DHB and the concentration of DSS (eq 6).
| 6 |
The pKa,0 of 1,2,4-triazole is obtained by fitting the chemical shift of the CH resonance of triazole (δT) to eq 7.
| 7 |
δL is taken as the 1H chemical shift of 1,2,4-triazole in the solution prior to layering on top of the 2,6-DHB. Fitting to eq 7 is only performed for points where the uncertainty in the pH determined from the chemical shift of 2,6-DHB is less than 0.1 units based on the parameters of 2,6-DHB determined in the absence of triazole. To verify the pKa,0 of 2,6-DHB, f is calculated from the pH and total concentration (T, 40 mM) of 1,2,4-triazole using eq 8 (Section S7, Supporting Information).
| 8 |
where  and [H+] = γ–110–pH. The chemical shift of 1,2,4-triazole is
fitted to eq 7 with pKa,0 triazole and δH as
free parameters and the chemical shift of 2,6-DHB to eqs 2 and 8 with
pKa,0 DHB*, δH,
and δL as free parameters. The uncertainty in the
pKa,0 of 2,6-DHB is taken as the difference
between pK*a,0 DHB and pKa,0 DHB as in the ideal case, the two values are
equal. This uncertainty is used to calculate the average uncertainty
in the pH in the fitting of eq 7, which is taken as the uncertainty in pKa,0 triazole (Section S7, Supporting Information). Fitting data for the three solvent mixtures yield
pKa,0 values of triazole of 1.80 ±
0.36, 1.77 ± 0.19, and 2.33 ± 0.41 in 50% 1-propanol/H2O, 50% DMSO/H2O, and 30% CD3CN/H2O, respectively (Figure 1b). The pKa values determined
by homogeneous mixing of DSS, 2,6-DHB, and triazole agree with the
CSI-derived values within fitted uncertainties (Section S1, Supporting Information).
and [H+] = γ–110–pH. The chemical shift of 1,2,4-triazole is
fitted to eq 7 with pKa,0 triazole and δH as
free parameters and the chemical shift of 2,6-DHB to eqs 2 and 8 with
pKa,0 DHB*, δH,
and δL as free parameters. The uncertainty in the
pKa,0 of 2,6-DHB is taken as the difference
between pK*a,0 DHB and pKa,0 DHB as in the ideal case, the two values are
equal. This uncertainty is used to calculate the average uncertainty
in the pH in the fitting of eq 7, which is taken as the uncertainty in pKa,0 triazole (Section S7, Supporting Information). Fitting data for the three solvent mixtures yield
pKa,0 values of triazole of 1.80 ±
0.36, 1.77 ± 0.19, and 2.33 ± 0.41 in 50% 1-propanol/H2O, 50% DMSO/H2O, and 30% CD3CN/H2O, respectively (Figure 1b). The pKa values determined
by homogeneous mixing of DSS, 2,6-DHB, and triazole agree with the
CSI-derived values within fitted uncertainties (Section S1, Supporting Information).
Determination of pKa of Indicators
Having determined the pKa,0 of 2,6-DHB and 1,2,4-triazole in a solvent mixture, we can now obtain δH, δL, and pKa,0 for a series of organic molecules with pKa values up to 10. This set of indicators allows us to determine pH up to 12 via their 1H chemical shifts.18 We chose a set of molecules possessing only one or two singlet 1H resonances: DMG, glycolate, acetate, IM, and 2-methylimidazole (2MI). Sodium was the counterion in all samples. To determine δH and pKa,0 for these indicators, two CSI experiments were run to span acidic (pH < 6) and basic (pH > 6) ranges. Salicylate and 4-cyanophenol (4CN) were used as additional indicators in these experiments. For the acidic range, 1,2,4-triazole (20 mM), DMG sodium salt (2 mM), glycolate (20 mM), acetate (20 mM), and salicylate (2 mM) were layered on top of 4–5 mg of 2,6-DHB. For 50% 1-propanol/H2O, DMG was excluded due to spectral overlap with 1-propanol. Salicylate was included as an analyte only in 30% CD3CN/H2O and in 50% 1-propanol/H2O, where it was included at a concentration of 20 mM.
The pH value reported by each indicator, pHi, for which δH, δL, and pKa,0 are known (initially only 2,6-DHB and 1,2,4-triazole) is calculated using eq 9
| 9 |
where δobs is the observed chemical shift of the indicator and Δz2 is the difference in the square of the charge of the indicator between the protonated and deprotonated states (−1 and 1 for 2,6-DHB and 1,2,4-triazole, respectively). For these experiments, δL of 1,2,4-triazole was redetermined in the solution of indicators from a row of the CSI data set where the pH was sufficiently low for the anionic form to be absent and the triazole to be in its neutral form, as judged relative to the 1H chemical shift of acetate (Figure S22, Supporting Information). γ was calculated using eq 3, with I at each point along the sample taken as the sum of the ionic strength of the solution of ligands in the absence of 2,6-DHB (I0), the concentration of H+, and the concentration of protonated nitrogen bases (eq 10)
| 10 |
where the summation is carried out for all nitrogen bases of concentration Ci for which δH, δL, and pKa,0 are known. The sensitivity, Si, of the chemical shift of each indicator with respect to pH is calculated using eq 11(18,25)
| 11 |
The pH value at each position along the sample is calculated as the sensitivity-weighted average of pHi calculated from each indicator for which δH, δL, and pKa,0 are known.
| 12 |
where the summation is carried out for all indicators where the uncertainty in pHi arising from the uncertainty in δobs, δH, and δL of the indicator is less than 0.05 units (Section S7, Supporting Information). This cutoff was increased to 0.1 units for the calibration of IM in 50% 1-propanol/H2O due to the large uncertainty in pH determined from the known indicators (acetate, glycolate, triazole, and 2,6-DHB) when the pH approached the pKa of IM. To determine δH, δL, and pKa,0 for a new indicator, initial values are used to calculate pHi for the indicator which is included in the calculation of the overall pH using eqs 9–12, provided the uncertainty in pHi arising from the uncertainty in δobs, δH, and δL is less than 0.4 units. δH and pKa,0 of the indicator are obtained by fitting δobs to eq 13 for each point along the sample for which pH can be determined using the known indicators.
| 13 |
δL was taken as the 1H chemical shift measured in the solution of indicators prior to layering on 2,6-DHB, with the exception of DMG where δL for the acidic step was judged from the CSI data set relative to the 1H chemical shift of acetate (Figure S22, Supporting Information). The 0.4 units cutoff in the calculation of pHi for the new indicator was increased to 0.8 if no points with acceptable uncertainty in pHi were detected following fitting to eq 13, so that an uncertainty in pKa,0 could be calculated. This was only the case for 4CN in 50% 1-propanol/H2O. Inclusion of the new indicator in the calculation of pH from eq 12 helps avoid the fitting to eq 13 being thrown by the high uncertainty when pH determined from the known indicators approaches their upper limit of quantitation. The uncertainty in pKa,0 for an indicator is calculated as the highest uncertainty in pKa,0 of the known indicators, plus the average difference between pHi of the new indicator and the pH calculated from eq 12 using only the known indicators. Once δH, δL, and pKa,0 and the uncertainty in pKa,0 have been determined, the parameters of the next indicator with the higher pKa can be determined until the full set is established. For 50% DMSO/H2O, salicylate was used to improve the fitting of glycolate to eq 13 by bridging the gap in the pKa between DMG and glycolate.
For the basic pH range, a solution of glycolate (20 mM), acetate (20 mM), IM (20 mM), 2MI (20 mM), 4CN sodium salt (20 mM), and DMG sodium salt (20 mM) was layered on the top of 4–5 mg of 2,6-DHB. Quinine hydrochloride (2 mM) was included as an analyte in the 30% CD3CN/H2O sample. The 50% DMSO/H2O sample contained 2 mM N,N-bis(2-hydroxyethyl)-2-aminoethanesulfonate (Bes) as an analyte; however, the pH did not reach a sufficiently low value to determine the pKa,0 of this compound. With the exception of DMG, δL of the indicator was measured in the solution prior to layering on the top of 2,6-DHB. δL for the fully deprotonated state of DMG (pKa,0 > 9) was determined by fitting δobs to eq 13 with δH, δL, and pKa,0 as free variables, and δL constrained to be less than or equal to the chemical shift measured prior to layering on 2,6-DHB. IM and 4CN bridged the gap in pKa between acetate and 2MI and between 2MI and DMG, respectively. However, IM was not required as an indicator in 50% DMSO/H2O due to the high pKa of acetic acid in this solvent mixture.
The values of δH, δL, and pKa,0 for the indicators are provided in Table 1. The pKa,0 values of acetic acid determined in 50% 1-propanol/H2O and 30% CD3CN/H2O (5.47 ± 0.38 and 5.46 ± 0.54, respectively) agree with the literature values of 5.7126 and 5.406 reported in these solvent mixtures. The plots of the 1H chemical shifts of the indicators and fits to eq 13 in 50% DMSO/H2O are provided in Figure 2. The plots for 50% 1-propanol/H2O and 30% CD3CN/H2O are provided in Section S9 of the Supporting Information.
Figure 2.

Plot of 1H chemical shifts of indicators vs pH in 50% DMSO/H2O. Solid lines are fits to eq 13.
Determination of pKa of Organic Molecules
Having established a set of indicator molecules to determine pH, we can measure the 1H chemical shifts of organic analyte molecules and fit them to eq 13 with δH, δL, and pKa,0 as free variables. With the exception of DMG in the determination of the pKa,0 of salicylate (50% DMSO/H2O and 30% CD3CN/H2O), all indicators were included at a 20 mM concentration, as sodium salts or neutral bases, to produce smooth pH gradients via buffering effects. As pKa,0 and δH are known for each indicator, δL does not need to be redetermined. The pH of a row is calculated by grouping the indicators into pairs in order of pKa,0 and calculating the sensitivity-weighted average pHi of the pair with the highest combined sensitivity.18
Analytes were 2 mM in 50% DMSO/H2O and 30% CD3CN/H2O and 20 mM in 50% 1-propanol/H2O. A total of 4–5 mg of 2,6-DHB was used unless otherwise stated. Good fits to eq 13 are obtained for a range of monoprotic analytes (Figure 3), while the pKa,0 values obtained agree with values reported in the literature (Table 2). These literature pKa,0 values have been interpolated from published data to the solvent compositions used in the present work (Section S5, Supporting Information). The uncertainty in the fitted pKa,0 was taken as the uncertainty in pH at the data point where the pH was closest to the value of pKa,0 – Δz2 log10(γ).
Figure 3.

Plot of 1H chemical shifts of monoprotic analytes vs pH in 50% 1-propanol/H2O (a), 50% DMSO/H2O (b), and 30% CD3CN/H2O (c) and fits to eq 13 (solid lines).
The pKa,0 of the enol form of acetylacetone was determined from the 1H chemical shift of the proton on the unsaturated carbon and converted to the overall pKa,0 of acetylacetone as pKa,0(enol) – log10(j), where j is the fraction of compound in the enol form at low pH (Figure S21, Supporting Information).381H spectra of analytes are provided in Section S8 of the Supporting Information.
For analytes possessing two protonation steps (picolinic acid, pipecolic acid, valine, phthalic acid, and quinine), eq 13 is modified to include two protonation steps
| 14 |
where the subscript denotes the deprotonation step and δL, δHL, and δH are the chemical shifts of the fully deprotonated, monoprotonated, and fully protonated states, respectively, and the pKa values are thermodynamic. Fits to eq 14 are shown in Figure 4. All pKa values and limiting chemical shifts were free fitting parameters. For all compounds, pKa2 is determined with good accuracy. However, with the exception of phthalic acid, the pH does not attain a sufficiently low value to allow a reliable fitting of pKa1. Nevertheless, an estimate of pKa1 is obtained (Table 2). The pKa1 of valine compares with the value of 3.00 reported by Dogăn et al.13 in 40% (v/v) DMSO/H2O. For phthalic acid, complete titration curves are recorded, allowing both pKa values to be fitted (Figure 4). The large number of pH values assessed in the CSI experiment also reveals the contrasting behavior of the two aromatic resonances.
Figure 4.

Plot of the 1H chemical shifts of diprotic analytes. Solid lines are fits to eq 14. (a) Picolinic acid, 50% 1-propanol/H2O. (b) Pipecolic acid, 50% 1-propanol/H2O. (c) d-valine, 50% DMSO/H2O. (d) Phthalic acid, 30% CD3CN/H2O. (e) Quinine, 30% CD3CN/H2O.
For quinine, the proton at position 2 of the quinoline ring exhibits a much larger change in chemical shift below pH 6 than the proton adjacent to the hydroxyl, implying that pKa1 is associated with the protonation of quinoline nitrogen. Such information may not be apparent from a conventional NMR titration where fewer data points are collected or if pKa was determined solely by potentiometric methods.
Conclusions
We have shown how a set of indicators for the measurement of pH in aqueous–organic solvents can be calibrated using four 1H CSI experiments, avoiding completely the use of literature data or electrochemical measurements and liberating researchers to study pH-dependent processes at the solvent composition required by their work. The indicators allow the 1H spectra of organic molecules, including active pharmaceutical ingredients, to be recorded as a function of pH using CSI techniques. The uncertainty in pKa determined by our method is comparable to the spread in the pKa values reported in the literature. As well as organic solvents, our method could potentially reveal the effect of additives, such as molecular crowding agents, on pKa, thus providing a valuable tool to inform experimental design.
Acknowledgments
We are grateful for the use of the University of East Anglia Faculty of Science NMR facility. We thank Mestrelab Research S.L. for technical advice and the gift of a software license for Mnova 14.3.1. We thank Dr Laszlo Fabian for helpful discussions.
Data Availability Statement
The data underlying this study are openly available at https://research-portal.uea.ac.uk/en/datasets/data-for-measurement-of-the-pka-values-of-organic-molecules-in-aq.
Supporting Information Available
The Supporting Information is available free of charge at https://pubs.acs.org/doi/10.1021/acs.analchem.3c02771.
Integration of 2,6-DHB; analysis of samples at different times since preparation; extraction of A and B (eq 3); interpolation of pKa values from published data; extraction of pKa of 2,6-DHB using 4-position; uncertainty analysis; example 1H spectra; calibration plots of indicators; automated processing of data sets; and CSI pulse sequences (PDF)
Spreadsheet for analysis of data sets (XLSX)
Author Contributions
All authors have given approval to the final version of the manuscript.
M.W. thanks UKRI for a Future Leaders Fellowship (MR/T044020/1). N.A. was funded by the Royal Society of Chemistry Analytical Chemistry Trust Fund (ACSS 21/015).
The authors declare no competing financial interest.
Supplementary Material
References
- Barbosa J.; Beltrán J.; Sanz-Nebot V. Ionization constants of pH reference materials in acetonitrile-water mixtures up to 70% (w/w). Anal. Chim. Acta 1994, 288 (3), 271–278. 10.1016/0003-2670(94)80140-1. [DOI] [Google Scholar]
- Blandamer M. J.; Burgess J. Kinetics of reactions in aqueous mixtures. Chem. Soc. Rev. 1975, 4 (1), 55–75. 10.1039/cs9750400055. [DOI] [Google Scholar]
- Mandumpal J. B.; Kreck C. A.; Mancera R. L. A molecular mechanism of solvent cryoprotection in aqueous DMSO solutions. Phys. Chem. Chem. Phys. 2011, 13 (9), 3839–3842. 10.1039/c0cp02326d. [DOI] [PubMed] [Google Scholar]
- Li A.; Yalkowsky S. H. Solubility of organic solutes in ethanol/water mixtures. J. Pharm. Sci. 1994, 83 (12), 1735–1740. 10.1002/jps.2600831217. [DOI] [PubMed] [Google Scholar]
- Rosés M.; Bosch E. Influence of mobile phase acid-base equilibria on the chromatographic behaviour of protolytic compounds. J. Chromatogr. A 2002, 982 (1), 1–30. 10.1016/S0021-9673(02)01444-9. [DOI] [PubMed] [Google Scholar]
- Espinosa S.; Bosch E.; Rosés M. Retention of ionizable compounds on HPLC. 12. The properties of liquid chromatography buffers in acetonitrile-water mobile phases that influence HPLC retention. Anal. Chem. 2002, 74 (15), 3809–3818. 10.1021/ac020012y. [DOI] [PubMed] [Google Scholar]
- Niazi M. S. K.; Shah S. S.; Ali J.; Khan M. Z. I. Thermodynamic dissociation constants of benzoic and nitrobenzoic acids in mixtures of ethanol and 1-propanol with water at 25°C. J. Solution Chem. 1990, 19 (6), 623–638. 10.1007/BF00647034. [DOI] [Google Scholar]
- McHedlov-Petrossyan N. O.; Mayorga R. S. Extraordinary character of the solvent influence on protolytic equilibria: Inversion of the fluorescein ionization constants in H2O-DMSO mixtures. J. Chem. Soc., Faraday Trans. 1992, 88 (20), 3025–3032. 10.1039/FT9928803025. [DOI] [Google Scholar]
- Ruiz R.; Rosés M.; Ràfols C.; Bosch E. Critical validation of a new simpler approach to estimate aqueous pKa of drugs sparingly soluble in water. Anal. Chim. Acta 2005, 550 (1–2), 210–221. 10.1016/j.aca.2005.06.058. [DOI] [Google Scholar]
- Busch M.; Ahlberg E.; Ahlberg E.; Laasonen K. How to Predict the pKa of Any Compound in Any Solvent. ACS Omega 2022, 7 (20), 17369–17383. 10.1021/acsomega.2c01393. [DOI] [PMC free article] [PubMed] [Google Scholar]
- Rondinini S.; Mussini P. R.; Mussini T. Reference value standards and primary standards for ph measurements in organic solvents and water + organic solvent mixtures of moderate to high permittivities. Pure Appl. Chem. 1987, 59 (11), 1549–1560. 10.1351/pac198759111549. [DOI] [Google Scholar]
- Roy R. N.; Gibbons J. J.; Baker G. E. Acid dissociation constants and pH values for standard ″bes″ and ″tricine″ buffer solutions in 30, 40, and 50 mass% dimethyl sulfoxide/water between 25 and −25 °C. Cryobiology 1985, 22 (6), 589–600. 10.1016/0011-2240(85)90036-7. [DOI] [PubMed] [Google Scholar]
- Doğan A.; Aslan N.; Erden P. E.; Canel E.; Kılıç E. Macroscopic and Microscopic Protonation Equilibria of Some α-Amino Acids in Dimethyl Sulfoxide-Water Mixtures. J. Solution Chem. 2015, 44 (8), 1705–1722. 10.1007/s10953-015-0363-8. [DOI] [Google Scholar]
- Avdeef A.; Box K. J.; Comer J. E. A.; Gilges M.; Hadley M.; Hibbert C.; Patterson W.; Tam K. Y. PH-metric log P 11. pKa determination of water-insoluble drugs in organic solvent-water mixtures. J. Pharm. Biomed. Anal. 1999, 20 (4), 631–641. 10.1016/S0731-7085(98)00235-0. [DOI] [PubMed] [Google Scholar]
- Deleebeeck L.; Snedden A.; Stoica D. Reconciling the pHe measurements of bioethanol: pHabs measurements of buffered 50–50 wt% water-ethanol mixtures. Anal. Chim. Acta: X 2022, 10, 100085. 10.1016/j.acax.2022.100085. [DOI] [PMC free article] [PubMed] [Google Scholar]
- Schenck G.; Baj K.; Iggo J. A.; Wallace M. Efficient pKa Determination in a Nonaqueous Solvent Using Chemical Shift Imaging. Anal. Chem. 2022, 94 (23), 8115–8119. 10.1021/acs.analchem.2c00200. [DOI] [PMC free article] [PubMed] [Google Scholar]
- Papadopoulos N.; Avranas A. Dissociation of salicylic acid, 2,4-2,5-and 2,6-dihydroxybenzoic acids in 1-propanol-water mixtures at 25°C. J. Solution Chem. 1991, 20 (3), 293–300. 10.1007/BF00650443. [DOI] [Google Scholar]
- Wallace M.; Adams D. J.; Iggo J. A. Titrations without the Additions: The Efficient Determination of pKa Values Using NMR Imaging Techniques. Anal. Chem. 2018, 90 (6), 4160–4166. 10.1021/acs.analchem.8b00181. [DOI] [PubMed] [Google Scholar]
- Perrin C. L. pH-Free Measurement of Relative Acidities, Including Isotope Effects. Methods Enzymol. 2017, 596, 331–368. 10.1016/bs.mie.2017.07.012. [DOI] [PubMed] [Google Scholar]
- Trigo-Mouriño P.; Merle C.; Koos M. R. M.; Luy B.; Gil R. R. Probing spatial distribution of alignment by deuterium NMR imaging. Chem.—Eur. J. 2013, 19 (22), 7013–7019. 10.1002/chem.201300254. [DOI] [PubMed] [Google Scholar]
- Adams R. W.; Holroyd C. M.; Aguilar J. A.; Nilsson M.; Morris G. A. Perfecting” WATERGATE: clean proton NMR spectra from aqueous solution. Chem. Commun. 2013, 49 (4), 358–360. 10.1039/C2CC37579F. [DOI] [PubMed] [Google Scholar]
- Gentile P. S.; Eberle L.; Cefola M.; Celiano A. V. Electromotive Force Measurements of the Cell-Pt/H2: HCI(m): Ag/Ag-in 1-Propanol-Water Mixtures. J. Chem. Eng. Data 1963, 8 (3), 420–421. 10.1021/je60018a040. [DOI] [Google Scholar]
- Yang R.; Schulman S. G. An operational pH in aqueous dimethylsulfoxide based upon the acidity dependence of the rate of a simple ionic recombination reaction in the lowest excited singlet state. Talanta 2003, 60 (2–3), 535–542. 10.1016/S0039-9140(03)00112-7. [DOI] [PubMed] [Google Scholar]
- Vega C. A.; Muñiz M. D. L. A. Standard potential of the (Ag+AgCl) electrode in (acetonitrile+water). J. Chem. Thermodyn. 1985, 17 (12), 1163–1170. 10.1016/0021-9614(85)90043-6. [DOI] [Google Scholar]
- Ackerman J. J. H.; Soto G. E.; Spees W. M.; Zhu Z.; Evelhoch J. L. The NMR chemical shift pH measurement revisited: Analysis of error and modeling of a pH dependent reference. Magn. Reson. Med. 1996, 36 (5), 674–683. 10.1002/mrm.1910360505. [DOI] [PubMed] [Google Scholar]
- Goffredi M.; Shedlovsky T. Electrolytic conductance in alcohol-water mixtures. V. Ionization constant of acetic acid in 1-propanol-water mixtures at 15, 25, and 35.degree. J. Phys. Chem. 1967, 71 (13), 4436–4442. 10.1021/j100872a042. [DOI] [Google Scholar]
- Niazi M. S. K.; Khan M. Z. I. Thermodynamic dissociation constants of salicylic and monochloroacetic acids in mixed solvent systems from conductance measurements at 25°C. J. Solution Chem. 1993, 22 (5), 437–456. 10.1007/BF00647681. [DOI] [Google Scholar]
- Rao S. P.; Sitaram B.; Reddy R. R. Dissociation-constants of benzoic, salicylic and ortho-nitrobenzoic and meta-nitrobenzoic acids in acetonitrile-water mixtures. Indian J. Chem., Sect. A: Inorg., Phys., Theor. Anal. 1981, 20 (5), 485–487. [Google Scholar]
- Nertokus G. P.; Aktas A. H. Potentiometric determination of pka values of benzoic acid and substituted benzoic acid compounds in acetonitrile-water mixtures. Asian J. Chem. 2009, 21 (5), 3825–3835. [Google Scholar]
- Lee C. K.; Jeoung E. H.; Lee I. S. H. Effect of mixtures of water and organic solvents on the acidities of 5- membered heteroaromatic carboxylic acids. J. Heterocycl. Chem. 2000, 37 (1), 159–166. 10.1002/jhet.5570370126. [DOI] [Google Scholar]
- Niazi M. S. K.; Ali J. Solvent Effect on the Dissociation of Benzoic and Nitrobenzoic Acids in Acetonitrile-Water Mixtures at 298 K. Bull. Chem. Soc. Jpn. 1990, 63 (12), 3619–3624. 10.1246/bcsj.63.3619. [DOI] [Google Scholar]
- Delorenzo R. A.; Kowalak A. D. Dissociation constants and metal chelate stabilities of picolinic acid and pipecolinic acid in 1-propanol-water mixtures. J. Inorg. Nucl. Chem. 1974, 36 (10), 2329–2334. 10.1016/0022-1902(74)80278-2. [DOI] [Google Scholar]
- Azab H. A. Potentiometric determination of the second-stage dissociation constants of some hydrogen ion buffers for biological research in various water + organic solvent mixtures. J. Chem. Eng. Data 1993, 38 (3), 453–457. 10.1021/je00011a033. [DOI] [Google Scholar]
- Gentile P. S.; Cefola M.; Celiano A. V. Coordination compounds. V. Determination of the dissociation constants of acetylacetone in mixed solvents. J. Phys. Chem. 1963, 67 (5), 1083–1086. 10.1021/j100799a034. [DOI] [Google Scholar]
- Moutiers G.; Le Guével E.; Villien L.; Terrier F. Similar catalytic behaviour of oximate and phenoxide bases in the ionization of bis(2,4-dinitrophenyl)methane in 50% water– 50% Me2SO. Revisiting the role of solvational imbalances in determining the nucleophilic reactivity of α-effect oximate bases. J. Chem. Soc., Perkin Trans. 2 1997, 7–14. 10.1039/a605249e. [DOI] [Google Scholar]
- Buckenmaier S. M. C.; McCalley D. V.; Euerby M. R. Determination of pKa values of organic bases in aqueous acetonitrile solutions using capillary electrophoresis. J. Chromatogr. A 2003, 1004 (1–2), 71–79. 10.1016/S0021-9673(03)00717-9. [DOI] [PubMed] [Google Scholar]
- El-Sherif A. A.; Shoukry M. M.; Abd-Elgawad M. M. A. Protonation Equilibria of Some Selected α-Amino Acids in DMSO–Water Mixture and Their Cu(II)-Complexes. J. Solution Chem. 2013, 42 (2), 412–427. 10.1007/s10953-013-9966-0. [DOI] [Google Scholar]
- Drexler E. J.; Field K. W. An NMR study of keto-enol tautomerism in β[beta]-dicarbonyl compounds. J. Chem. Educ. 1976, 53 (6), 392–393. 10.1021/ed053p392. [DOI] [Google Scholar]
Associated Data
This section collects any data citations, data availability statements, or supplementary materials included in this article.
Supplementary Materials
Data Availability Statement
The data underlying this study are openly available at https://research-portal.uea.ac.uk/en/datasets/data-for-measurement-of-the-pka-values-of-organic-molecules-in-aq.