Abstract
This work investigates three types of biochar (bamboo charcoal, wood pellet, and coconut shell) for postcombustion carbon capture. Each biochar is structurally modified through physical (H2O, CO2) and chemical (ZnCl2, KOH, H3PO4) activation to improve carbon capture performance. Three methods (CO2 adsorption isotherms, CO2 fixed-bed adsorption, and thermogravimetric analysis) are used to determine the CO2 adsorption capacity. The results show that a more than 2.35 mmol·g–1 (1 bar, 298 K) CO2 capture capacity was achieved using the activated biochar samples. It is also demonstrated that the CO2 capture performance by biochar depends on multiple surface and textural properties. A high surface area and pore volume of biochar resulted in an enhanced CO2 capture capacity. Furthermore, the O*/C ratio and pore width show a negative correlation with the CO2 capture capacity of biochars.
1. Introduction
Climate change is a key challenge nowadays, and CO2 emissions are responsible for this challenge.1 For example, compared to the preindustrial period, the concentration of CO2 in the air has increased by more than 54.4%.2 After the United Nations Climate Change Conference 2015, reducing carbon emissions and capturing atmospheric CO2 are the main routes to control the global temperature rise.3 Therefore, developing technologies to restrain CO2 emissions and reduce atmospheric CO2 concentrations to achieve carbon neutrality is essential.
Liquid adsorbents, such as liquid amine and aqueous alkali, are widely applied in industries.4 However, the volatile loss and corrosion to the instrument are the major problems of liquid adsorbents.5 Hence, to explore the further feasibility of CO2 adsorbents, solid materials have been used in the carbon capture process.6 Solid adsorbents, such as metal–organic framework (MOF),7,8 zeolite,9 and carbonous materials,1 are promising because of their properties of high CO2 capacity, easy modification, low cost, and good stability.
Carbonous materials are environmentally friendly sorbents among the reported solid adsorbents. In particular, biochar, as one of the carbonous materials, is generated from biomass pyrolysis under inert conditions.10 Biomass from agricultural waste and urban waste as the precursor of biochar has a considerable production globally, promoting biochar production in large quantities.11 Additionally, biochar exhibits advantages in environmental protection, application stability, and sustainable development. Therefore, with the superiority of production and adaptability, biochar has been applied in different fields, like catalytic support/catalysis,12 water purification,13 soil amendment,14 and CO2 capture.15
Compared with other typical solid CO2 adsorbents, biochar mainly relies on physical properties to achieve adsorption, transportation, and storage of CO2. It is estimated that biochar could capture the amount of greenhouse gas by almost a unit gigaton each year, and nearly 10% of global emissions could be reduced if biomass and biochar are applied for carbon neutrality.16 This remarkable environmental benefit is mainly due to 1) large-scale biomass production worldwide, providing adequate sources for biochar materials;11 2) biomass is a carbon-neutral material, having the ability to achieve carbon fixation, and biochar has almost no adverse impact on the environment; and 3) the stability and recyclability of biochar during CO2 capture.
Furthermore, the porosity of biochar is one of the requirements for CO2 capture, and micropores determining the CO2 capture performance of biochar has been widely recognized.17,18 Therefore, biochar activation is an essential step in enhancing the porous structure. The main biochar activation methods are physical activation and chemical activation. Physical activation is attained by introducing gases (e.g., CO2, H2O) to react with biochar under high-temperature conditions and removing the volatile to generate abundant porosity.19 Although physical biochar activation is more moderate and less polluting, its activation strength is lower than that of the chemical activation method. In contrast, chemical activation of biochar relies on the reaction between active chemical compounds (e.g., alkaline, acid, molten salts) and carbon to achieve the purpose of porous formation.20 However, chemical activation conditions should be carefully controlled to avoid the destruction and structure collapse of biochar due to the high activity of activation agents.21 Furthermore, although the physical adsorption of CO2 by biochar is the main pathway, surface modification of biochar is popular in enhancing CO2 chemical adsorption. Either amine grafting or nitrogen dope makes up for the lack of nitrogen in biochar materials.
Nevertheless, there are still challenges for biochar-based carbon capture. Notably, the process is mainly dependent on the porous structure of biochar. There are unknowns about the influence of textural properties of biochar on CO2 capture. By contrast, biochar shows less uniformity than hydrothermal char because of the complex components of feedstocks and precursors.22,23 In addition, in the choice of biochar activation method, much of the work states that chemical activation is better but lacks a comparison with physical activation.24,25 Correlation analysis of biochar properties and the relation to the CO2 capture performance could be essential to help promote technology development.
Herein, this work investigated the influence of biochar activation on the CO2 capture performance obtained by TGA, the KANE 457 portable gas analyzer, and the ASAP 2020 gas analyzer. Moreover, three lignocellulosic biochar samples were used to explore the CO2 adsorption performance of different biochar feedstock. The activation agents, including ZnCl2, H3PO4, and KOH, were also investigated. Therefore, this work explores a potential mechanistic explanation of the CO2 adsorption process regarding the influence of pore size, surface properties, and biochar preparation and activation.
2. Materials and Methods
2.1. Materials and Biochar Activation
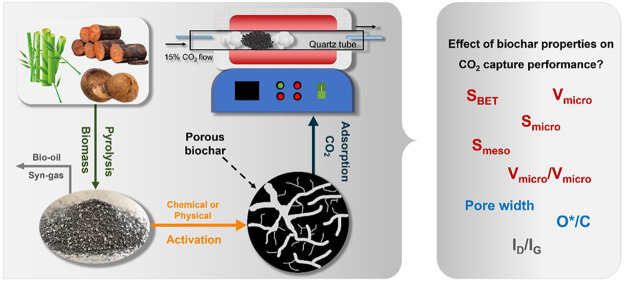
KOH (Sigma-Aldrich, ≥85%), ZnCl2 (Sigma-Aldrich, ≥95%), and H3PO4 (Sigma-Aldrich, 58 wt % in H2O) were utilized as the activator for biochar activation processes. The lignocellulosic biochar samples used in this work included bamboo charcoal biochar (BC-Origin), wood pellet biochar (WP-Origin), and coconut shell biochar (CS-Origin). Bamboo charcoal (BC) was obtained from the pyrolysis of compressed bamboo sawdust with a high density at ∼1000 °C from Ken Chiku Company. Wood pellet (WP) was produced from EN1 grade A wood pellets from Enertecgreen Ltd. And coconut shell (CS) was carbonized from coconut shell fragments at high temperatures (∼1200 °C) in an inert atmosphere by Lvzhiyuan Company. Figure 1 shows the pyrolysis and biochar activation processes, and the detailed steps of specific activation methods are listed separately below.
Figure 1.
Schematic diagram for biomass pyrolysis and biochar activation.
Steam activation: as the previous work reported,18 the biochar was sieved to less than 500 μm and dried overnight at 110 °C in an oven. A sample weighing approximately 6 g was placed in a horizontal quartz tube and heated at a rate of 10 °C min–1 under a nitrogen flow (100 mL min–1). Once the temperature reached 250 °C, 15 mL of deionized water was continuously injected at a rate of 10 mL h–1 to introduce steam into the quartz tube. Set the activation temperature to 550 °C and the duration to an hour. After the activated sample cooled to room temperature, it was washed with deionized water and dried in an oven overnight, and the samples were labeled as BC-H2O, WP-H2O, and CS-H2O.
CO2 activation: approximately 6 g of sieved and dried biochar was pretreated in quartz under nitrogen flow rates of 100 mL min–1. When the temperature reached 250 °C, the gas path was switched to CO2. The CO2 activation was sustained for one h at 550 °C. After the system cooled down to room temperature, the samples were washed with deionized water, dried in the oven overnight, and named BC-CO2, WP-CO2, and CS-CO2, respectively.
Chemical activation: According to the previous works,26,27 equal mass amounts of dried biochar and chemical compounds (ZnCl2, H3PO4, or KOH) were agitated for 24 h at room temperature in 40 mL of deionized water. The chemically impregnated biochar samples were sieved and dried overnight at 110 °C. The dried chemically impregnated sample was placed into a quartz tube and exposed to 100 mL·min–1 nitrogen. The furnace was heated at 10 °C·min–1 until it reached 550 °C, which remained for 1 h. After the biochar was allowed to cool to room temperature, 0.1 mol·L–1 HCl (NaOH for removing H3PO4) and sufficient deionized water were used to dislodge water-soluble ions. The activated biochar samples were dried overnight at 110 °C and then sieved under a mesh size of 500 μm. The prepared samples are labeled as BC-ZnCl2, BC-KOH, BC-H3PO4, WP-ZnCl2, WP-KOH, WP-H3PO4, CS-ZnCl2, CS-KOH, and CS-H3PO4, respectively.
2.2. Biochar Characterization
The content of C, H, N, and S in the biochar samples was determined by a PerkinElmer PE2400 CHSN Element Analyzer. The proximate analysis (measuring the content of ash, moisture, fixed carbon, and volatile matter of biochar) was tested by the TGA 2950 Thermogravimetric Analyzer. The compositions of Ca, K, P, and Si were measured by inductively coupled plasma-optical emission spectroscopy (ICP-OES). X-ray diffraction (XRD) patterns were obtained with a PANalytical Empyrean Series 2 diffractometer with a Cu Ka X-ray source. The presence of surface functional groups and aromatic groups of biochar in the range of 3000–1400 cm–1 was determined by an Agilent Cary 630 FTIR spectrometer. Scanning electron microscopy (SEM) was performed with a Quanta FEG 250 at 20 keV voltage under a high chamber vacuum. Raman spectroscopy was obtained with a WItec Alpha 300 Raman microscope. The microscope was equipped with a 100× lens and a 532 nm laser. The Micromeritics ASAP 2020 characterized the textural properties of biochar samples at 77 K. The surface area was obtained using the Brunauer–Emmett–Teller (BET) method. The porosity of samples was obtained using the t-Plot method, Barrett–Joyner–Halenda (BJH) method, and Horvath–Kawazoe method. CO2 and N2 adsorption isotherms were also investigated by the Micromeritics ASAP 2020 gas adsorption analyzer at 298 K after degassing at 200 °C for 6 h.
2.3. CO2 Capture Capacity
Kane 457 Gas Analyzer: ∼1 g of a biochar sample was placed in the quartz tube (OD: 12 mm) sandwiched by quartz wool, and 15% CO2 balanced in N2 was introduced into the system at a flow rate of 100 mL·min–1. The adsorption and desorption of CO2 using the biochar samples were achieved by the temperature swing method, which measured the CO2 capture at room temperature and CO2 release at 70 °C. Based on the variation of CO2 concentration at the end of the fixed bed, the CO2 capture capacities of biochar can be calculated according to the following equation
| 1 |
where C means the CO2 capture capacity of biochars; q and q0 are outlet and inlet CO2 concentrations; t is the equilibrium time; v is the 15% CO2 flue rate; and m is the actual biochar mass placed in the quartz tube.
TGA 2950 Thermogravimetric Analyzer: around 20 mg of a specified biochar sample was placed into the 50 μL platinum sample pan, and the balance purge was continuously fed with nitrogen at 100 mL min–1. The sample was preheated at 110 °C for 20 min under nitrogen, and the furnace purge was switched to 15% CO2 at the flow of 100 mL·min–1 when the furnace temperature decreased to 25 °C. The instrument was warmed to 70 °C to remove the captured CO2 after the mass signal stabilized.
3. Results and Discussion
3.1. Biochar Characterization
3.1.1. Proximate Analysis
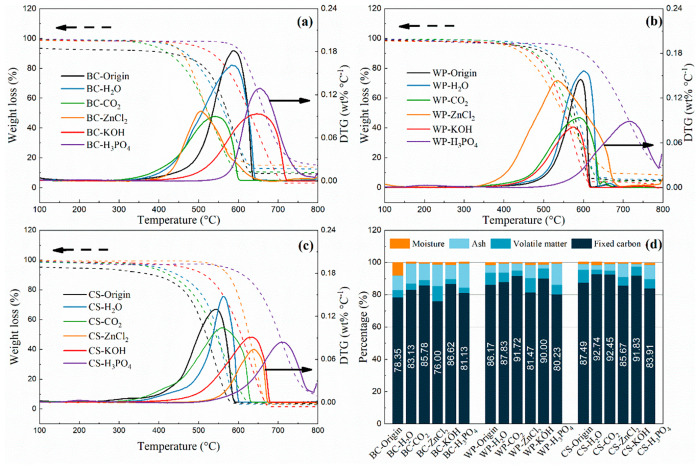
Figure 2 shows the results of the temperature-programmed oxidation (TPO) of biochars and proximate analysis. TPO allows the evaluation of the thermochemical conversion of biochar, thus providing information on the oxidative stability of carbonaceous solids, where the reactivity at higher temperatures indicates a more stable and ordered structure.28 Typically, the oxidation temperatures of three initial biochars are in the range 400–650 °C. The oxidation temperature of WP is around 550 °C, which is relatively higher than that of other feedstock. For the CS biochars after the activation, the DTG peaks (Figure 2(c)) are all shifted to higher temperatures, indicating that the activation enhances the thermal stability of the CS biochars, which might be related to the small particles of CS that could sufficiently react with the activators. Furthermore, in terms of the effect of activators on the TPO of the samples, chemical activation seems to increase the oxidation temperature range of the biochar samples. Moreover, the H3PO4 activation expands the oxidation peak to nearly 700 °C, illustrating a higher biochar thermal stability.29 Notably, although the production of biochar from biomass has eliminated a large number of volatile substances through high-temperature pyrolysis, phosphoric acid as an activator can still interact with the residual organic matter to form phosphate and polyphosphate groups, prompting the activation process to swell and expand the porous structure.30
Figure 2.
TGA-TPO and TGA-DTG profiles of (a) bamboo charcoal, (b) wood pellet, and (c) coconut shell; (d) biochar composition determined by proximate analysis.
Proximate analysis can also assess biochar stability and composition.31Figure 2(d) shows the proximate analysis results of the biochar samples. Fixed carbon is one of the indicators to determine the advantages of biochar, and most of the biochar has a higher fixed carbon content after activation, except for six samples activated with H3PO4 and ZnCl2. For the molten salt activation, a higher volatile fraction of biochar after ZnCl2 activation was confirmed.32 This might be due to the aromatization between ZnCl2 and the residual cellulose-like structure inside the biochar during the activation process, resulting in structural changes.33 In addition, the proportion of fixed carbon after phosphoric acid activation is reduced. It is suggested that the activation of biochar under acidic conditions generates acidic functional groups, increasing oxygen content and reducing the proportion of fixed carbon.34
3.1.2. CHNS Results
The elemental analysis results for determining C, H, N, and S percentages (%) are summarized in Table 1. According to Table 1, biochar samples have considerable amounts of carbonous and oxygenated compounds. The low concentration of nitrogen element proves that the activated biochar lacks nitrogen-containing functional groups, which may result in insufficient chemisorption of carbon dioxide by biochar materials.35 In addition, compared to the proximate analysis (Figure 2(d)), the elemental analysis obtains similar results: 1) the activated biochars have a higher carbon content than the precursors, except for the phosphoric acid and molten salt activated biochars; 2) the higher oxygen content after H3PO4 activation indicates that more oxygen-containing functional groups are generated and attached to the surface of the biochar; and 3) as the oxygen content is obtained by difference, it may include unremoved metals, which is consistent with the increased ash content of the ZnCl2 activated biochars.
Table 1. CHNS Analysis Results.
| Name | C | H | N | S | O*a |
|---|---|---|---|---|---|
| BC-Origin | 78.05 | 2.10 | 0.34 | 1.17 | 18.34 |
| BC-H2O | 82.51 | 0.81 | <0.30 | <0.30 | 16.08 |
| BC–CO2 | 84.18 | 1.97 | <0.30 | <0.30 | 13.25 |
| BC-ZnCl2 | 74.26 | 1.32 | <0.30 | <0.30 | 23.82 |
| BC-KOH | 84.46 | 2.25 | <0.30 | <0.30 | 12.69 |
| BC-H3PO4 | 78.97 | 1.24 | 0.45 | <0.30 | 20.04 |
| WP-Origin | 88.30 | 1.35 | <0.30 | 0.43 | 9.67 |
| WP-H2O | 90.50 | 1.06 | <0.30 | <0.30 | 7.84 |
| WP-CO2 | 91.15 | 0.68 | <0.30 | <0.30 | 7.57 |
| WP-ZnCl2 | 76.42 | 0.91 | <0.30 | <0.30 | 22.07 |
| WP-KOH | 88.51 | 1.18 | <0.30 | <0.30 | 9.71 |
| WP-H3PO4 | 75.12 | 0.87 | <0.30 | <0.30 | 23.41 |
| CS-Origin | 83.88 | 1.22 | <0.30 | <0.30 | 14.3 |
| CS-H2O | 90.65 | 1.32 | <0.30 | <0.30 | 7.43 |
| CS-CO2 | 89.77 | 0.87 | <0.30 | <0.30 | 8.76 |
| CS-ZnCl2 | 90.93 | 0.58 | <0.30 | <0.30 | 7.89 |
| CS-KOH | 90.47 | 0.88 | <0.30 | <0.30 | 8.05 |
| CS-H3PO4 | 75.86 | 1.13 | <0.30 | <0.30 | 22.41 |
O* is obtained by difference.
3.1.3. FTIR
The ATR-FTIR spectra in the wavelength range 2600–1600 cm–1 are shown in Figure 3. Overall, the FTIR results are similar among the different samples. A strong appearance at 2320 cm–1 indicates the O=C=O stretching of CO2, and the weak aromatic C–H bending is indicated at 2000–1990 cm–1.36 Moreover, the peaks from 2200 to 2000 cm–1 (circled in Figure 3(a)) correspond to the central double bond groups (e.g., C=N, C=C=C).18 Briefly, for the same biochar species, the profiles of the samples do not change significantly after activation under different conditions, which indicates that the activated biochar was only structurally altered.
Figure 3.
FTIR spectra of (a) bamboo charcoal biochars, (b) wood pellet biochars, and (c) coconut shell biochars.
3.1.4. SEM
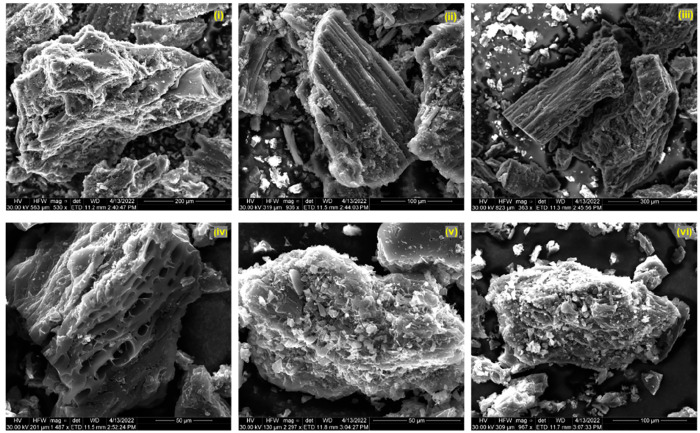
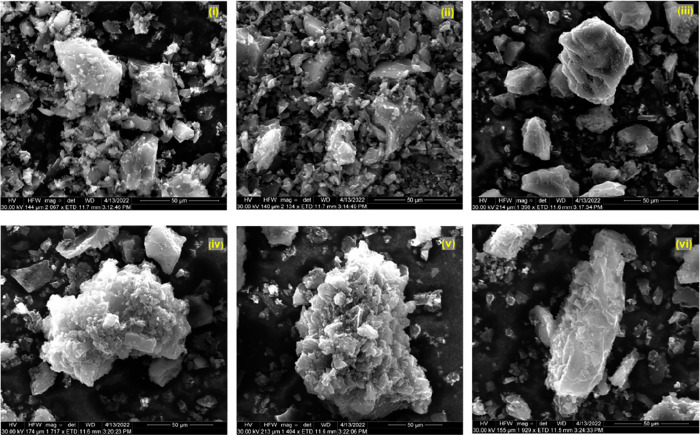
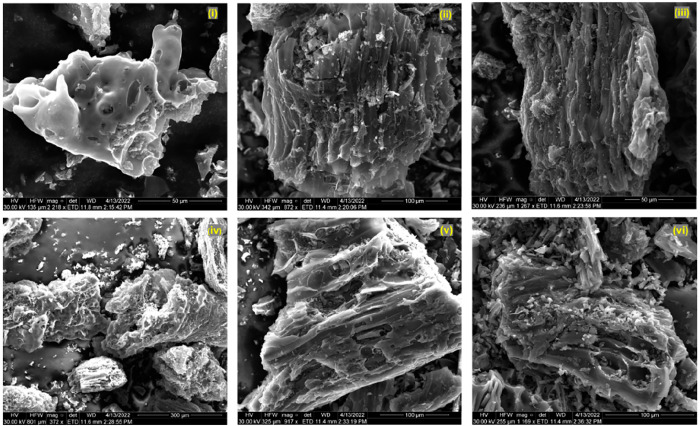
Figures 4–6 demonstrate the morphologies of the biochars analyzed by scanning electron microscopy (SEM). Essentially, the BC and WP biochars have similar structures, and their particles are relatively large compared to the CS biochar, which is due to the more stringent pyrolysis conditions of CS. For the CS biochar, although the small particle size of the biochar facilitates an adequate reaction with the activators, it is challenging to enlarge the pore size presented in the precursor due to its inherent fragmentation. Moreover, it is also difficult to observe the micropore structure on SEM scales. On the contrary, the BC and WP biochars are easier to characterize. The physical activation of biochar (steam activation and CO2 activation) mainly results in the tubular pore structure,37 while chemical activation produces pore expansion and corrosion.38 From Figures 4(iv)–(vi) and 5(iv)–(vi), the irregular collapse of the pores shows that the chemical activation made the surface of the biochar rougher. Additionally, despite attempts to wash the biochars with acid and alkaline solutions after activation, it is evident that the surface of the biochar activated using metal hydroxide and molten salt has a metallic crystalline structure (Figures 6(iv) and 6(v)). In particular, the CS biochars are completely covered with metal-containing compounds on the surface. This phenomenon is also detected by XRD (Figure S1). In addition, the XRD results show metallic signals in addition to the conventional graphite peak signal.39
Figure 4.
SEM images of bamboo charcoal biochars, sample logs: original biochar (i) and activated by H2O (ii), CO2 (iii), ZnCl2 (iv), KOH (v), and H3PO4 (vi).
Figure 6.
SEM images of coconut shell biochars, sample logs: original biochar (i) and activated by H2O (ii), CO2 (iii), ZnCl2 (iv), KOH (v), and H3PO4 (vi).
Figure 5.
SEM images of wood pellet biochars, sample logs: original biochar (i) and activated by H2O (ii), CO2 (iii), ZnCl2 (iv), KOH (v), and H3PO4 (vi).
3.1.5. Raman Spectroscopy
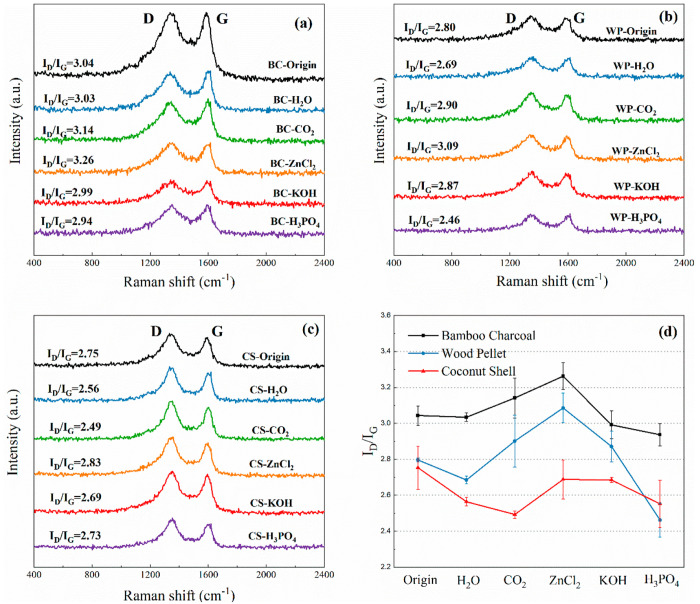
Raman spectra of the biochar samples are shown in Figure 7, which confirms the presence of G-band (1580–1600 cm–1 from vibrations of graphitic sp2 carbon) and D-band (1350–1370 cm–1 from vibrations of sp2 bonded defected carbon).40 The ratio of ID and IG can be regarded as the order of magnitude of carbon rings for biochar adsorbents. The biochar samples in this work show fewer disordered carbons (ID/IG > 2.00), confirming the presence of amorphous carbon as demonstrated by the XRD results (Figure S1). In addition, Figure 7(d) shows that different samples have a similar overall trend in ID/IG, while the activation seems to affect the orderliness of the biochar carbon. For example, ZnCl2 activation increases the disorder of carbon in the BC and WP biochars, while that in H3PO4 is the opposite.
Figure 7.
Raman spectra of (a) bamboo charcoal; (b) wood pellet; and (c) coconut shell biochar fragments. All of the spectra show the D and G bands, indicating graphitic structures and defected graphitic structures, respectively; (d) ID/IG band ratio trend of bamboo charcoal, wood pellet, and coconut shell biochar.
3.1.6. Porous Analysis
Table 2 presents the results of the porous analysis, including surface area, pore volume, and pore width. It is essential to activate biochar to enhance the surface properties for CO2 capture. However, ZnCl2 and H3PO4 activation methods have a negative effect on improving the porosity of biochar. The most effective activation method in terms of the specific surface area is KOH activation, which expands the specific surface area of the BC biochar from 91.17 m2·g–1 to 526.36 m2·g–1. Similarly, the other two biochars activated by KOH under the same activation conditions demonstrated larger specific surface areas. Likewise, the microporous structure of the activated biochar is enhanced after the activation, which can be supported by the ratio of Smicro/Smeso and Vmicro/Vtotal. Moreover, it is worth mentioning that KOH activation is more favorable to generating micropores because of the reaction between KOH and C during the activation process and the introduction of a metallic frame into the carbon matrix.41
Table 2. BET Surface Area, Micropore/Mesopore Surface Area, Micropore/Total Volume, and Average Pore Diameter of the Prepared Sorbents.
| Name | SBETa (m2 g–1) | Smicrob (m2 g–1) | Vmicrob (cm3 g–1) | Smesob (m2 g–1) | Vtotalc (cm3 g–1) | Pore widthc (nm) |
|---|---|---|---|---|---|---|
| BC-Origin | 91.17 | 47.46 | 0.03 | 32.74 | 0.17 | 3.40 |
| BC-H2O | 191.22 | 89.34 | 0.05 | 80.28 | 0.29 | 6.05 |
| BC–CO2 | 174.09 | 60.75 | 0.01 | 114.49 | 0.29 | 6.65 |
| BC-ZnCl2 | 96.93 | 10.25 | 0.01 | 78.09 | 0.17 | 7.10 |
| BC-KOH | 526.36 | 343.14 | 0.16 | 131.29 | 0.46 | 3.47 |
| BC-H3PO4 | 85.52 | 4.80 | 0.01 | 67.15 | 0.16 | 7.64 |
| WP-Origin | 160.66 | 145.18 | 0.08 | 15.48 | 0.10 | 4.36 |
| WP-H2O | 306.99 | 276.89 | 0.13 | 30.10 | 0.16 | 3.49 |
| WP-CO2 | 287.02 | 262.46 | 0.13 | 24.56 | 0.15 | 2.73 |
| WP-ZnCl2 | 4.56 | 4.10 | 0.002 | 0.46 | 0.01 | 16.03 |
| WP-KOH | 438.72 | 387.45 | 0.20 | 51.27 | 0.24 | 3.54 |
| WP-H3PO4 | 3.19 | 2.29 | 0.001 | 0.90 | 0.01 | 5.45 |
| CS-Origin | 1252.62 | 949.53 | 0.42 | 303.09 | 0.61 | 2.74 |
| CS-H2O | 1315.61 | 980.80 | 0.44 | 326.66 | 0.64 | 2.70 |
| CS-CO2 | 1270.45 | 923.41 | 0.42 | 347.04 | 0.64 | 2.76 |
| CS-ZnCl2 | 1297.51 | 908.61 | 0.42 | 388.89 | 0.65 | 2.73 |
| CS-KOH | 1352.60 | 1017.23 | 0.45 | 335.37 | 0.67 | 2.86 |
| CS-H3PO4 | 983.39 | 762.35 | 0.34 | 221.03 | 0.53 | 3.21 |
BET method.
t-plot method.
Single point method.
Furthermore, CS biochar has the most complex surface structure (1252.62 m2·g–1) and a large number of microporous structures. However, if a high temperature was used to carbonize biomass, a smaller particle size of biochar could be generated. The nitrogen adsorption–desorption linear isotherm plots (Figure 8) show that the CS biochar demonstrates a type I BET isotherm curve, which indicates a predominantly microporous structure.42 The BC biochar that fits the type IV isothermal curve demonstrates a mesoporous structure,43 while the WP biochar has a relatively insignificant porous structure. Moreover, the surface areas of WP and BC are decreased after H3PO4 and ZnCl2 activation, which might be caused by the residual activators and P-containing functional groups or the collapse and shrinkage of pores for these activation methods under the experimental temperature.24
Figure 8.
N2 adsorption–desorption isotherms of (a) bamboo charcoal biochars, (b) wood pellet biochars, and (c) coconut shell biochars.
It is known that biochar relies on the physical adsorption of micropores for the CO2 capture. Therefore, the pore size distribution of the micropores is derived in Figure 9 according to the Horvath–Kawazoe method. According to Figure 9(c) and Table 2, the CS biochar mainly has micropores. Microporous structures are dominant only in the BC and WP biochar when KOH is used for activation.
Figure 9.
Horvath–Kawazoe differential pore volume plot of (a) bamboo biochars, (b) wood pellet biochars, and (c) coconut shell biochars.
3.2. CO2 Capture Capacity
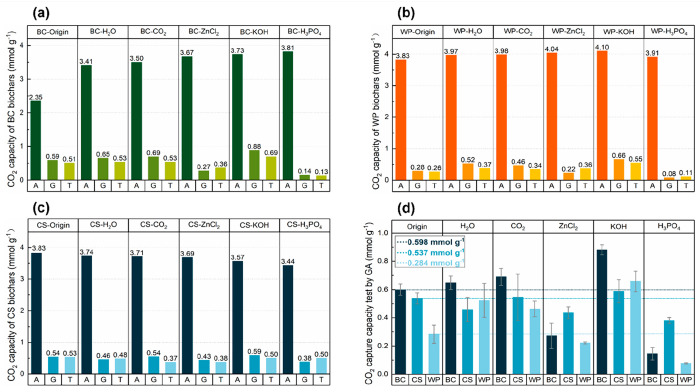
The CO2 capture by biochar was measured with three instruments: the ASAP 2020 (A), KANE 457 gas analyzer (G), and thermogravimetric analysis (T). The three instruments have different advantages and disadvantages. For example, the ASAP 2020 can determine the adsorption capacity of biochar at a specific partial pressure. Figure 10 represents the adsorption capacity of pure carbon dioxide at 1 bar and 298 K, which is why the values of A are higher than those of G and T. The thermogravimetric test used 15% CO2 as the carbon source (balanced with N2); this process might be affected by the adsorption of N2. The KANE 457 Gas Analyzer monitors the change in the CO2 concentration in the system via an infrared detector, allowing a more accurate calculation of the CO2 capture capacity by biochars.
Figure 10.
CO2 capture capacities tested by the ASAP 2020 (A), Kane 457 gas analyzer (G), and thermal gravity instrument (T) of (a) bamboo charcoal biochars, (b) wood pellet biochars, and (c) coconut shell biochars; (d) Comparison of different activation methods on CO2 capacity performance of biochar samples.
As shown in Figure 10, the different biochar capture capacities measured in the three ways have a generally consistent trend, in terms of CO2 adsorption. Therefore, Figure 10(d) presents the effect of the different activation methods on the adsorption of CO2 from the KANE 457. It is demonstrated that the H2O, CO2, and KOH activation methods enhance the ability of CO2 adsorption using the WP and BC biochars. For example, the CO2 adsorption capacity of KOH-activated BC increases from 0.59 mmol g–1 to 0.88 mmol g–1, and the adsorption capacity of WP biochar also increases by 85.7% after water vapor activation. However, not all activations enhance the performance of biochar, in terms of CO2 adsorption. ZnCl2 and H3PO4 activations substantially reduce the carbon capture performance of the three biochars. This may be because of (i) the collapse of pores during the activation and (ii) the increase of surface acidity of the biochar (introducing P-containing functional groups),24 making it challenging to capture the acidic gas of CO2. Therefore, although activation can improve the pore structure of biochar, increasing the CO2 capture capacity of biochar is also subject to other factors of CO2 capture, such as the surface functionalities of biochar.
3.3. CO2/N2 Selectivity
The selectivity of biochar for CO2 and N2 is one of the critical criteria for carbon dioxide capture by biochar. The ideal adsorbed solution theory (IAST) theory44,45 is based on Langmuir fit CO2 and N2 isotherm adsorption at the same conditions. The CO2/N2 selectivity can be calculated according to the parameter data of eq 2, where qm (mmol g–1) is the theoretical saturated adsorption ability, and KL is the constant for the Langmuir equation. Figure S4 shows the isothermal sorption of carbon dioxide and nitrogen by the biochars at 298 K, and the fitted data for each type of biochar is shown in Table 3. Typically, α (CO2/N2) greater than 2.046 is considered to indicate that biochar tends to retain CO2 and reduce N2 adsorption during the adsorption process. CS-H3PO4 performed with a maximum selectivity of 12.484.
| 2 |
Table 3. Parameters of the Langmuir Model Fittings for Isotherms of Biochar Samples.
| CO2 |
N2 |
|||||||
|---|---|---|---|---|---|---|---|---|
| Capacity at 25 °C, 1 bar (mmol g–1) | qm (mmol g–1) | KL (*101 MPa–1) | R2 | qm (mmol g–1) | KL (*101 MPa–1) | R2 | α(CO2/N2) | |
| BC-Origin | 3.345 | 6.521 | 0.988 | 0.997 | 1.564 | 0.410 | 0.999 | 10.047 |
| BC-H2O | 3.410 | 6.775 | 0.990 | 0.998 | 2.207 | 0.294 | 0.999 | 10.337 |
| BC–CO2 | 3.501 | 8.039 | 0.760 | 0.999 | 1.060 | 0.990 | 0.997 | 5.822 |
| BC-ZnCl2 | 3.666 | 13.738 | 0.362 | 0.999 | 0.977 | 1.270 | 0.997 | 4.008 |
| BC-KOH | 3.730 | 12.612 | 0.411 | 0.999 | 2.254 | 0.362 | 0.999 | 6.353 |
| BC-H3PO4 | 3.813 | 7.433 | 0.988 | 0.997 | 1.439 | 0.760 | 0.999 | 6.715 |
| WP-Origin | 3.826 | 6.610 | 1.272 | 0.997 | 1.234 | 0.989 | 0.998 | 6.889 |
| WP-H2O | 3.967 | 7.882 | 0.991 | 0.998 | 2.147 | 0.411 | 0.999 | 8.852 |
| WP-CO2 | 3.984 | 9.146 | 0.760 | 0.998 | 2.950 | 0.295 | 0.999 | 7.987 |
| WP-ZnCl2 | 4.042 | 6.984 | 1.272 | 0.997 | 1.061 | 0.992 | 0.997 | 8.440 |
| WP-KOH | 4.100 | 7.992 | 0.991 | 0.997 | 0.994 | 1.273 | 0.997 | 6.259 |
| WP-H3PO4 | 3.913 | 17.179 | 0.294 | 0.999 | 1.234 | 0.991 | 0.998 | 4.130 |
| CS-Origin | 3.827 | 12.939 | 0.411 | 0.999 | 1.624 | 0.761 | 0.999 | 4.303 |
| CS-H2O | 3.738 | 7.427 | 0.991 | 0.998 | 1.980 | 0.362 | 0.999 | 10.269 |
| CS-CO2 | 3.714 | 8.528 | 0.760 | 0.999 | 0.981 | 0.992 | 0.997 | 6.660 |
| CS-ZnCl2 | 3.686 | 6.367 | 1.272 | 0.997 | 1.584 | 0.411 | 0.999 | 12.440 |
| CS-KOH | 3.567 | 7.086 | 0.990 | 0.998 | 0.906 | 0.992 | 0.997 | 7.805 |
| CS-H3PO4 | 3.436 | 7.888 | 0.760 | 0.999 | 1.960 | 0.245 | 0.999 | 12.484 |
3.4. Correlation Analysis
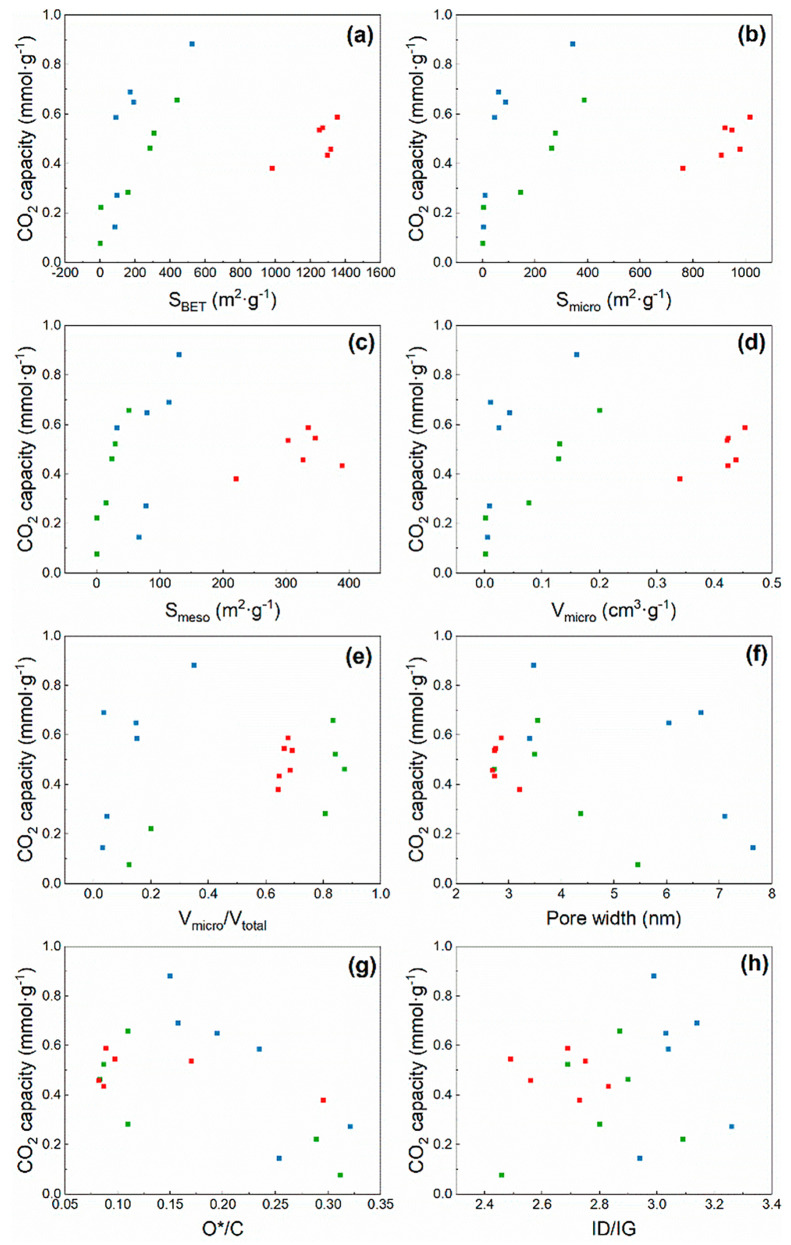
Correlation analysis between the carbon dioxide capture capacity and various properties provides a more direct indication of whether the properties of the biochar are conducive to implementing carbon capture. Figure 11 shows the relationship between the three biochars and the eight representative properties of biochars. Overall, the BET specific surface area, micropore surface area, and micropore volume positively contribute to the CO2 adsorption of biochar. Conversely, pore width and O*/C are negatively correlated to the CO2 adsorption capacity. Moreover, the ID/IG measured by Raman spectroscopy does not indicate a clear correlation. At present, researchers have overestimated the importance of micropores for CO2 adsorption. For example, Figures 11(b) and 11(d) both show that CS has an abundant microporous structure, but the adsorption performance is lower than some activated BC and WP biochars. In this case, the pore width and O*/C need to be combined to evaluate the CO2 adsorption mechanism of the biochar. The large pore width results in CO2 passing through the interior of the biochar without capture, thus reducing the capture capacity of the biochar. Besides, the O*/C ratio, which reflects the polarity and hydrophilicity of the biochar,47 is negatively correlated with CO2 adsorption, indicating that biochars with high aromatization and hydrophobicity are favorable for CO2 capture. Therefore, based on the above description, the mechanism of CO2 adsorption by biochar is not dependent on a single factor but rather on a synergistic effect of pore size, surface area, elemental content, and surface functional groups.
Figure 11.
Correlation analysis between the CO2 capture capacity obtained by the gas analyzer (BC-blue, WP-green, CS-red) and (a) BET surface area, (b) micropore surface area, (c) mesopore surface area, (d) micropore volume, (e) micropore volume/total pore volume, (f) pore width, (g) *O/C, and (h) ID/IG.
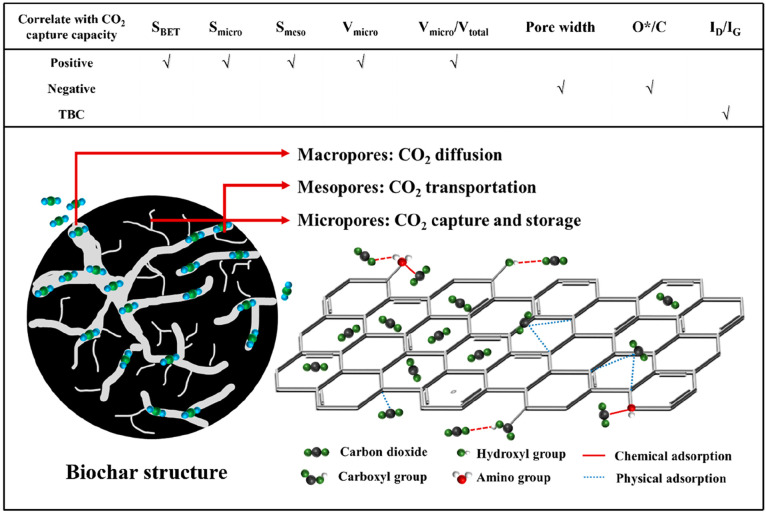
Overall, the physical adsorption of CO2 by biochar is related to its different properties. Figure 12 shows the positive (SBET, Smicro, Smeso, Vmicro, and Vmicro/Vtotal) and negative (pore width, O*/C) correlation with CO2 capture properties. From the perspective of porosity, it normally decides the surface area and pore volume of adsorbents. The porous structure originates from the high-temperature pyrolysis of the precursors. The elimination of volatile substances and unstable elements from the precursors could generate the initial pore-size structure of the biochar. The role of pores of biochar for CO2 capture could be summarized: 1) macropores act primarily as diffusers, providing space for CO2 to come into complete contact with the biochar material;48 2) mesopores act primarily as transporters, allowing CO2 to move freely within the mesoporous channels;18 and 3) micropores are the primary sites for CO2 adsorption and storage, allowing CO2 fixed inside the biochar under milder conditions. The microporosity shows intense CO2 adsorption potentials because overlapping the potential fields from the adjacent biochar layers increases the CO2 uptake capacity.49 Typically, both the specific surface area and pore size structure are correlated, with greater specific surface area generated from the rich porosity. Therefore, a higher specific surface area is more favorable for CO2 adsorption since a larger specific surface area provides sufficient adsorption sites.1 However, an increase in the specific surface area of biochar cannot be achieved without the activation process of the biochar material. The specific surface area can be enhanced with increasing activation time, temperature, and activator concentration. However, it is demonstrated that excessive activation leads to structural collapse of the biochar material, which results in a lower peak specific surface area and destruction of the pore size structure.18,50 As shown in Figure 12, the biochar with a large pore width demonstrates inactive adsorption ability.
Figure 12.
Potential mechanism of CO2 physisorption by a porous biochar material.
Moreover, the elemental composition of biochar (reflected for the O*/C ratio in Figure 12) determines the chemical properties of its surface, such as acidity, hydrophobicity, and polarity, which are all related to the biochar’s ability to capture CO2.51 From the results of the correlation analysis, the O*/C ratio shows a negative effect on the CO2 capture of biochar. With these oxygen-containing functional groups, the hydrophilic and polar nature of the biochar surface cause water vapor to occupy the CO2 adsorption sites,52 reducing the amount of CO2 adsorbed. Thus, under the dryness CO2 adsorption conditions, the reduction in the O*/C ratio indicates the aromaticity of biochar and increases carbon fixation, which enhances the CO2 capture capacity.
Therefore, although some chemisorption (relying on functional groups, e.g., amino acids) is present in biochar, physical adsorption is still the primary means of CO2 capture. Furthermore, the correlation analysis shows that the prospects for carbon adsorption on biochar still need to be improved. High surface area, porous structures, and strongly hydrophobic and highly aromatized biochar would be promising CO2 adsorbents.
4. Conclusion
This work investigated the modification of five activation methods based on three types of lignocellulosic biochar: bamboo charcoal, wood pellet, and coconut shell. Meanwhile, various biochars were tested for CO2 capture performance using thermogravimetric analysis, a portable gas analyzer, and CO2 isothermal adsorption. Furthermore, the final correlation analysis was carried out using different characterization methods with porous structure analysis as the primary characterization measure. Acid and molten salt activation of biochar reduce CO2 adsorption. The physical adsorption of CO2 by biochar is mainly related to the internal structure. For example, the increase in the BET specific surface area, micropore surface area, mesopore surface area, and micropore volume favored the adsorption of CO2 by the biochar materials. Furthermore, the adsorption of CO2 by biochar is affected by a synergistic effect of the above physical properties. The O*/C ratio is negatively correlated with the CO2 capture capacity. It is suggested that a high ratio of O*/C could enhance the acidity of the adsorbent and result in low activity for capturing CO2. In addition, biochar activation and modification are both necessary to generate high-efficiency CO2 adsorbents. Biochar with a high C/N content, low oxygen content, high specific surface area, and adequate porous structure is preferred for effective CO2 capture.
Acknowledgments
This project was supported by the European Union’s Horizon 2020 research and innovation programme under the Marie Skłodowska-Curie grant agreement No. 823745. This project has received funding from the European Union’s Horizon 2020 research and innovation programme under grant agreement No. 872102.
Supporting Information Available
The Supporting Information is available free of charge at https://pubs.acs.org/doi/10.1021/acs.iecr.3c00445.
Additional characterization results including ICP-OES, XRD analysis, biochar surface Zeta potential, and experimental results for 15% CO2 capture breakthrough, CO2 and N2 adsorption isotherm (PDF)
Author Contributions
C.Z. and Y.J. contributed equally and mainly to this study. Chen Zhang: Data curation, Writing-original draft. Ying Ji: Data curation, Investigation, Visualization. Chunchun Li: Data curation, Investigation. Yingrui Zhang, Shuzhuang Sun, Yikai Xu: Resources, Visualization. Long Jiang: Visualization, Resources, Writing–review and editing. Chunfei Wu: Conceptualization, Methodology, Supervision, Project administration, Writing–review and editing.
The authors declare no competing financial interest.
Supplementary Material
References
- Guo S.; Li Y.; Wang Y.; Wang L.; Sun Y.; Liu L. Recent advances in biochar-based adsorbents for CO2 capture. Carbon Capture Science & Technology 2022, 4, 100059. 10.1016/j.ccst.2022.100059. [DOI] [Google Scholar]
- Wigley T. The pre-industrial carbon dioxide level. Climatic change 1983, 5 (4), 315–320. 10.1007/BF02423528. [DOI] [Google Scholar]
- Christoff P. The promissory note: COP 21 and the Paris Climate Agreement. Environmental Politics 2016, 25 (5), 765–787. 10.1080/09644016.2016.1191818. [DOI] [Google Scholar]
- Gao J.; Zhang Y.; Feng D.; Du Q.; Yu M.; Xie M.; Sun L.; Wu S. A new technique of carbon capture by ammonia with the reinforced crystallization at low carbonized ratio and initial experimental research. Fuel Process. Technol. 2015, 135, 207–211. 10.1016/j.fuproc.2015.02.008. [DOI] [Google Scholar]
- Shi X.; Xiao H.; Azarabadi H.; Song J.; Wu X.; Chen X.; Lackner K. S. Sorbents for the direct capture of CO2 from ambient air. Angew. Chem., Int. Ed. 2020, 59 (18), 6984–7006. 10.1002/anie.201906756. [DOI] [PubMed] [Google Scholar]
- Pardakhti M.; Jafari T.; Tobin Z.; Dutta B.; Moharreri E.; Shemshaki N. S.; Suib S.; Srivastava R. Trends in solid adsorbent materials development for CO2 capture. ACS Appl. Mater. Interfaces 2019, 11 (38), 34533–34559. 10.1021/acsami.9b08487. [DOI] [PubMed] [Google Scholar]
- Demir H.; Aksu G. O.; Gulbalkan H. C.; Keskin S. MOF Membranes for CO2 Capture: Past, Present and Future. Carbon Capture Science & Technology 2022, 2, 100026. 10.1016/j.ccst.2021.100026. [DOI] [Google Scholar]
- Jiang L.; Xie R.; Shi W.; Wu E.; Li B.; Zhang X. Water effect on adsorption carbon capture in metal-organic framework: A molecular simulation. Carbon Capture Science & Technology 2022, 4, 100061. 10.1016/j.ccst.2022.100061. [DOI] [Google Scholar]
- Kumar S.; Srivastava R.; Koh J. Utilization of zeolites as CO2 capturing agents: Advances and future perspectives. Journal of CO2 Utilization 2020, 41, 101251. 10.1016/j.jcou.2020.101251. [DOI] [Google Scholar]
- Qin F.; Zhang C.; Zeng G.; Huang D.; Tan X.; Duan A. Lignocellulosic biomass carbonization for biochar production and characterization of biochar reactivity. Renewable and Sustainable Energy Reviews 2022, 157, 112056. 10.1016/j.rser.2021.112056. [DOI] [Google Scholar]
- Wang J.; Wang S. Preparation, modification and environmental application of biochar: a review. Journal of Cleaner Production 2019, 227, 1002–1022. 10.1016/j.jclepro.2019.04.282. [DOI] [Google Scholar]
- Zhang H.; Tan Q.; Huang Q.; Wang K.; Tu X.; Zhao X.; Wu C.; Yan J.; Li X. Boosting the Conversion of CO2 with Biochar to Clean CO in an Atmospheric Plasmatron: A Synergy of Plasma Chemistry and Thermochemistry. ACS Sustainable Chem. Eng. 2022, 10, 7712. 10.1021/acssuschemeng.2c01778. [DOI] [Google Scholar]
- Xiang W.; Zhang X.; Chen J.; Zou W.; He F.; Hu X.; Tsang D. C.; Ok Y. S.; Gao B. Biochar technology in wastewater treatment: A critical review. Chemosphere 2020, 252, 126539. 10.1016/j.chemosphere.2020.126539. [DOI] [PubMed] [Google Scholar]
- Singh B.; Singh B. P.; Cowie A. L. Characterisation and evaluation of biochars for their application as a soil amendment. Soil Research 2010, 48 (7), 516–525. 10.1071/SR10058. [DOI] [Google Scholar]
- Qiao Y.; Wu C. Nitrogen enriched biochar used as CO2 adsorbents: a brief review. Carbon Capture Science & Technology 2022, 2, 100018. 10.1016/j.ccst.2021.100018. [DOI] [Google Scholar]
- Lehmann J.; Joseph S.. Biochar for environmental management: an introduction. Biochar for environmental management; Routledge: 2015; pp 1–13. [Google Scholar]
- Adeniran B.; Mokaya R. Is N-doping in porous carbons beneficial for CO2 storage? Experimental demonstration of the relative effects of pore size and N-doping. Chem. Mater. 2016, 28 (3), 994–1001. 10.1021/acs.chemmater.5b05020. [DOI] [Google Scholar]
- Zhang C.; Sun S.; Xu S.; Wu C. CO2 capture over steam and KOH activated biochar: Effect of relative humidity. Biomass and Bioenergy 2022, 166, 106608. 10.1016/j.biombioe.2022.106608. [DOI] [Google Scholar]
- Sajjadi B.; Chen W.-Y.; Egiebor N. O. A comprehensive review on physical activation of biochar for energy and environmental applications. Reviews in Chemical Engineering 2019, 35 (6), 735–776. 10.1515/revce-2017-0113. [DOI] [Google Scholar]
- Sajjadi B.; Zubatiuk T.; Leszczynska D.; Leszczynski J.; Chen W. Y. Chemical activation of biochar for energy and environmental applications: a comprehensive review. Reviews in Chemical Engineering 2019, 35 (7), 777–815. 10.1515/revce-2018-0003. [DOI] [Google Scholar]
- Sakhiya A. K.; Anand A.; Kaushal P. Production, activation, and applications of biochar in recent times. Biochar 2020, 2 (3), 253–285. 10.1007/s42773-020-00047-1. [DOI] [Google Scholar]
- Yu S.; Dong X.; Zhao P.; Luo Z.; Sun Z.; Yang X.; Li Q.; Wang L.; Zhang Y.; Zhou H. Decoupled temperature and pressure hydrothermal synthesis of carbon sub-micron spheres from cellulose. Nat. Commun. 2022, 13 (1), 3616. 10.1038/s41467-022-31352-x. [DOI] [PMC free article] [PubMed] [Google Scholar]
- Kambo H. S.; Dutta A. A comparative review of biochar and hydrochar in terms of production, physico-chemical properties and applications. Renewable and Sustainable Energy Reviews 2015, 45, 359–378. 10.1016/j.rser.2015.01.050. [DOI] [Google Scholar]
- Chen Y.; Zhang X.; Chen W.; Yang H.; Chen H. The structure evolution of biochar from biomass pyrolysis and its correlation with gas pollutant adsorption performance. Bioresour. Technol. 2017, 246, 101–109. 10.1016/j.biortech.2017.08.138. [DOI] [PubMed] [Google Scholar]
- Sevilla M.; Mokaya R. Energy storage applications of activated carbons: supercapacitors and hydrogen storage. Energy Environ. Sci. 2014, 7 (4), 1250–1280. 10.1039/C3EE43525C. [DOI] [Google Scholar]
- Ji Y.; Zhang C.; Zhang X.; Xie P.; Wu C.; Jiang L. A high adsorption capacity bamboo biochar for CO2 capture for low temperature heat utilization. Sep. Purif. Technol. 2022, 293, 121131. 10.1016/j.seppur.2022.121131. [DOI] [Google Scholar]
- Zhang C.; Sun S.; He S.; Wu C. Direct air capture of CO2 by KOH-activated bamboo biochar. Journal of the Energy Institute 2022, 105, 399. 10.1016/j.joei.2022.10.017. [DOI] [Google Scholar]
- Jackson M. A.; Eberhardt T. L.; Boateng A. A.; Mullen C. A.; Groom L. H. Evaluation of biochars by temperature programmed oxidation/mass spectrometry. BioResources 2013, 8 (4), 5461–5474. 10.15376/biores.8.4.5461-5474. [DOI] [Google Scholar]
- Panwar N.; Pawar A. Influence of activation conditions on the physicochemical properties of activated biochar: a review. Biomass Conversion and Biorefinery 2022, 12, 925. 10.1007/s13399-020-00870-3. [DOI] [Google Scholar]
- Oginni O.; Singh K.; Oporto G.; Dawson-Andoh B.; McDonald L.; Sabolsky E. Effect of one-step and two-step H3PO4 activation on activated carbon characteristics. Bioresource Technology Reports 2019, 8, 100307. 10.1016/j.biteb.2019.100307. [DOI] [Google Scholar]
- Crombie K.; Mašek O.; Sohi S. P.; Brownsort P.; Cross A. The effect of pyrolysis conditions on biochar stability as determined by three methods. Gcb Bioenergy 2013, 5 (2), 122–131. 10.1111/gcbb.12030. [DOI] [Google Scholar]
- Uçar S.; Erdem M.; Tay T.; Karagöz S. Preparation and characterization of activated carbon produced from pomegranate seeds by ZnCl2 activation. Appl. Surf. Sci. 2009, 255 (21), 8890–8896. 10.1016/j.apsusc.2009.06.080. [DOI] [Google Scholar]
- Caturla F.; Molina-Sabio M.; Rodriguez-Reinoso F. Preparation of activated carbon by chemical activation with ZnCl2. Carbon 1991, 29 (7), 999–1007. 10.1016/0008-6223(91)90179-M. [DOI] [Google Scholar]
- Cordero-Lanzac T.; Hita I.; Veloso A.; Arandes J.; Rodríguez-Mirasol J.; Bilbao J.; Cordero T.; Castaño P. Characterization and controlled combustion of carbonaceous deactivating species deposited on an activated carbon-based catalyst. Chemical Engineering Journal 2017, 327, 454–464. 10.1016/j.cej.2017.06.077. [DOI] [Google Scholar]
- Petrovic B.; Gorbounov M.; Soltani S. M. Impact of surface functional groups and their introduction methods on the mechanisms of CO2 adsorption on porous carbonaceous adsorbents, Carbon Capture. Science & Technology 2022, 3, 100045. 10.1016/j.ccst.2022.100045. [DOI] [Google Scholar]
- Hou C.; Wu Y.; Wang T.; Wang X.; Gao X. Preparation of quaternized bamboo cellulose and its implication in direct air capture of CO2. Energy Fuels 2019, 33 (3), 1745–1752. 10.1021/acs.energyfuels.8b02821. [DOI] [Google Scholar]
- Sewu D. D.; Jung H.; Kim S. S.; Lee D. S.; Woo S. H. Decolorization of cationic and anionic dye-laden wastewater by steam-activated biochar produced at an industrial-scale from spent mushroom substrate. Bioresour. Technol. 2019, 277, 77–86. 10.1016/j.biortech.2019.01.034. [DOI] [PubMed] [Google Scholar]
- Li K.; Zhang D.; Niu X.; Guo H.; Yu Y.; Tang Z.; Lin Z.; Fu M. Insights into CO2 adsorption on KOH-activated biochars derived from the mixed sewage sludge and pine sawdust. Science of The Total Environment 2022, 826, 154133. 10.1016/j.scitotenv.2022.154133. [DOI] [PubMed] [Google Scholar]
- Xia D.; Tan F.; Zhang C.; Jiang X.; Chen Z.; Li H.; Zheng Y.; Li Q.; Wang Y. ZnCl2-activated biochar from biogas residue facilitates aqueous As (III) removal. Appl. Surf. Sci. 2016, 377, 361–369. 10.1016/j.apsusc.2016.03.109. [DOI] [Google Scholar]
- Xu J.; Liu J.; Ling P.; Zhang X.; Xu K.; He L.; Wang Y.; Su S.; Hu S.; Xiang J. Raman spectroscopy of biochar from the pyrolysis of three typical Chinese biomasses: A novel method for rapidly evaluating the biochar property. Energy 2020, 202, 117644. 10.1016/j.energy.2020.117644. [DOI] [Google Scholar]
- Ganan J.; González-García C.; Gonzalez J.; Sabio E.; Macıas-Garcıa A.; Díaz-Díez M. Preparation of activated carbons from bituminous coal pitches. Appl. Surf. Sci. 2004, 238 (1–4), 347–354. 10.1016/j.apsusc.2004.05.222. [DOI] [Google Scholar]
- Thommes M.; Kaneko K.; Neimark A. V.; Olivier J. P.; Rodriguez-Reinoso F.; Rouquerol J.; Sing K. S. Physisorption of gases, with special reference to the evaluation of surface area and pore size distribution (IUPAC Technical Report). Pure and applied chemistry 2015, 87 (9–10), 1051–1069. 10.1515/pac-2014-1117. [DOI] [Google Scholar]
- Ambroz F.; Macdonald T. J.; Martis V.; Parkin I. P. Evaluation of the BET Theory for the Characterization of Meso and Microporous MOFs. Small methods 2018, 2 (11), 1800173. 10.1002/smtd.201800173. [DOI] [Google Scholar]
- Manyà J. J.; García-Morcate D.; González B. Adsorption performance of physically activated biochars for postcombustion CO2 capture from dry and humid flue gas. Applied Sciences 2020, 10 (1), 376. 10.3390/app10010376. [DOI] [Google Scholar]
- Durán I.; Álvarez-Gutiérrez N.; Rubiera F.; Pevida C. Biogas purification by means of adsorption on pine sawdust-based activated carbon: Impact of water vapor. Chemical Engineering Journal 2018, 353, 197–207. 10.1016/j.cej.2018.07.100. [DOI] [Google Scholar]
- XIAO A.-Y.; ZHANG R.-C. Adsorption equilibrium and diffusion of CH4, N2 and CO2 in coconut shell activated carbon. Journal of China Coal Society 2010, 35 (8), 1341–1346. [Google Scholar]
- Cao L.; Zhang X.; Xu Y.; Xiang W.; Wang R.; Ding F.; Hong P.; Gao B. Straw and wood based biochar for CO2 capture: Adsorption performance and governing mechanisms. Sep. Purif. Technol. 2022, 287, 120592. 10.1016/j.seppur.2022.120592. [DOI] [Google Scholar]
- Shen W.; Fan W. Nitrogen-containing porous carbons: synthesis and application. J. Mater. Chem. A 2013, 1 (4), 999–1013. 10.1039/C2TA00028H. [DOI] [Google Scholar]
- Guo L.; Yang J.; Hu G.; Hu X.; Wang L.; Dong Y.; DaCosta H.; Fan M. Role of hydrogen peroxide preoxidizing on CO2 adsorption of nitrogen-doped carbons produced from coconut shell. ACS Sustainable Chem. Eng. 2016, 4 (5), 2806–2813. 10.1021/acssuschemeng.6b00327. [DOI] [Google Scholar]
- Zhang X.; Wu J.; Yang H.; Shao J.; Wang X.; Chen Y.; Zhang S.; Chen H. Preparation of nitrogen-doped microporous modified biochar by high temperature CO 2–NH 3 treatment for CO 2 adsorption: effects of temperature. RSC Adv. 2016, 6 (100), 98157–98166. 10.1039/C6RA23748G. [DOI] [Google Scholar]
- Igalavithana A. D.; Choi S. W.; Shang J.; Hanif A.; Dissanayake P. D.; Tsang D. C.; Kwon J.-H.; Lee K. B.; Ok Y. S. Carbon dioxide capture in biochar produced from pine sawdust and paper mill sludge: Effect of porous structure and surface chemistry. Sci. Total Environ. 2020, 739, 139845. 10.1016/j.scitotenv.2020.139845. [DOI] [PubMed] [Google Scholar]
- Gao F.; Li Y.; Bian Z.; Hu J.; Liu H. Dynamic hydrophobic hindrance effect of zeolite@ zeolitic imidazolate framework composites for CO 2 capture in the presence of water. J. Mater. Chem. A 2015, 3 (15), 8091–8097. 10.1039/C4TA06645F. [DOI] [Google Scholar]
Associated Data
This section collects any data citations, data availability statements, or supplementary materials included in this article.


