Abstract
The analysis of small particles, including extracellular vesicles and viruses, is contingent on their ability to scatter sufficient light to be detected. These detection methods include flow cytometry, nanoparticle tracking analysis, and single particle reflective image sensing. To standardize measurements and enable orthogonal comparisons between platforms, a quantifiable limit of detection is required. The main parameters that dictate the amount of light scattered by particles include size, morphology, and refractive index. To date, there has been a lack of accessible techniques for measuring the refractive index of nanoparticles at a single-particle level. Here, we demonstrate two methods of deriving a small particle refractive index using orthogonal measurements with commercially available platforms. These methods can be applied at either a single-particle or population level, enabling the integration of diameter and scattering cross section values to derive the refractive index using Mie theory.
Keywords: calibration, extracellular vesicles, light scatter, refractive index, viruses
Refractive index (RI) is defined as the ratio of the speed of light in a vacuum to the speed of light in the material. In flow cytometry (FCM), RI can be perceived as the detected light scattering signal intensity from a particle, with higher RIs particles usually resulting in a higher light scattering signal than lower RIs. The intensity of a detectable light scattering signal is complex and reliant on not only a particle’s RI but also its size, shape, and complexity.
RI quantification of biological nanoparticles has become of increasing interest due to its role in common technologies utilized for the detection and sizing of extracellular vesicles (EVs). These are platforms that implement methodologies that rely on light scattering for particle detection including FCM, nanoparticle tracking analysis (NTA), and single particle interferometric reflective image sensing (SP-IRIS). The derivation of RI from nanoparticles has been demonstrated utilizing NTA1,2 and more recently with interferometric NTA.3 NTA as a method, however, has several caveats. Sample throughput is low, measuring hundreds of particles per minute. The dynamic range is limited for diameter and intensity measurements. The precision is low for single particle measurements, often requiring postacquisition fitting methods and biasing toward a longer tracklength to produce accurate population diameter distributions. Furthermore, the measurement of hydrodynamic diameter, as opposed to a particle’s morphological diameter, can result in oversizing of biological particles with surface components, such as proteins. Since the derivation of spherical particle RI depends on diameter, NTA methods likely result in an underestimation of biological nanoparticle RI as a hydrodynamic diameter can overestimate the physical diameter.
The calibration of FCM data from light scattering intensity to diameter has been demonstrated to be a useful method to make data comparable across cytometry platforms while allowing the characterization of size and epitope abundance.4 FCM is a high-throughput technique capable of acquiring thousands of events per second and simultaneously detecting associated fluorescent signals across multiple channels. The derivation of accurate diameter data from FCM requires an accurate RI. Commercial FCM has previously been used to derive RI from multiple angles in a method named Flow-SR.5,6 This methodology uses two light scatter collection angles, e.g., forward light scatter (FSC) and side light scatter (SSC), and its demonstration has currently been limited to the Apogee platform.5,6 While theoretically applicable to other platforms, the utilization of this methodology has been limited by the lack of FSC sensitivity on most commercial flow cytometers with the majority unable to resolve 200 nm polystyrene beads. On platforms where Flow-SR is possible, the dynamic range of RI derivation is restricted to particle diameters that are above the limit of detection of the least sensitive light scatter detector and below the wavelength of illuminating light, e.g., 405 nm. With the current commercially available detection technologies, this limit is typically ≳200 nm for EVs. An advantage of Flow-SR is that it does not require any assumptions to be made around the population distribution in order to derive RI from single particles.
FCM typically analyzes particles labeled with fluorescent reagents
such as conjugated antibodies or membrane dyes. Fluorescent reagents
absorb light to different degrees, defined by their molar absorption
coefficient and excitation spectra. This can result in labeled particles
absorbing light and would result in a particle having a complex refractive
index ( ), whereby an optical extinction coefficient
(k) as well as a real refractive index (n) would need to be defined.
Currently, FCM has not been demonstrated to be capable of deriving both real and imaginary constants simultaneously; instead, we refer to an effective RI. If a particle has a complex RI, its effective RI refers to a particle with no optical extinction coefficient, which results in a detected signal that is equivalent to the complex RI particle. Alternatively, this term can also be used to describe a homogeneous sphere that results in an equivalent detected signal as a core–shell particle or other complex structured particle.
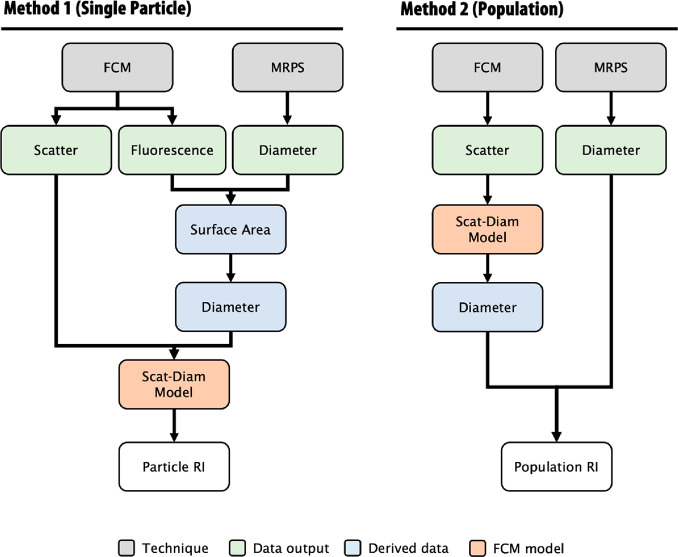
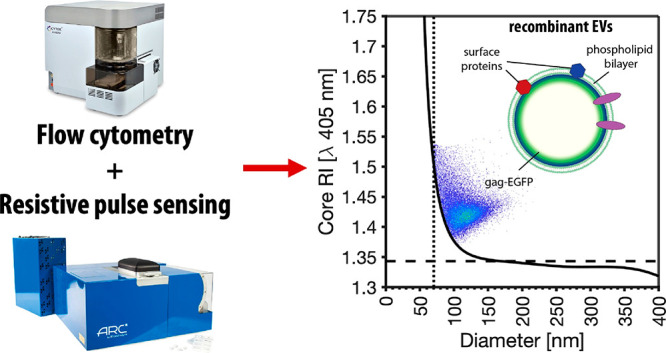
Here we investigate the ability of high sensitivity flow cytometry to size and derive the RI of particles down to 50 nm using two novel methodologies on commercially available platforms. We show the development of two independent methods to derive the RI of nanoparticles at either a single-particle (Method 1) or a population (Method 2) level, utilizing the high-throughput, precise acquisition methods flow cytometry (FCM) and microfluidic resistive pulse sensing (MRPS), Figure 1. We investigate the ability of these two independent methods to derive agreeing RIs using commercially available recombinant EVs (rEVs) ranging in diameter from 50 to 200 nm. Finally, the reproducibility of these measurements is then examined by deriving the RI of rEVs across 8 flow cytometers, each with different collection optics and settings. RI derivation with the addition of shell–core models enables, for the first time, the generation of values on a single-particle level that would be relevant for the study of heterogeneous biological samples.
Figure 1.
Methods to derive the refractive index at a single particle and population level. Method 1 outlines the pipeline to utilize flow cytometry (FCM) and microfluidic resistive pulse sensing (MRPS) measurements to derive single particle refractive index (RI). FCM data require that the fluorescence intensity of particles relates to its physical size, in this case surface area. MRPS diameter measurements can be converted to surface area, and a fitting method can be used to calibrate the fluorescence data to diameter. Once FCM fluorescence data are converted to diameter, light scattering (Scatter) can be utilized to infer refractive index. Refractive index can be derived by interpolating light scattering and diameter data with scatter-diameter. Method 2 outlines a pipeline to utilize flow cytometry (FCM) and microfluidic resistive pulse sensing (MRPS) measurements to derive RI at a population level. In this method a comparison of distributions, e.g., surface area/diameter or scattering cross-sections, are compared between two techniques over a range of tested RIs. This method also utilizes the flow cytometer scatter-diameter curves to convert FCM light scatter data to diameter.
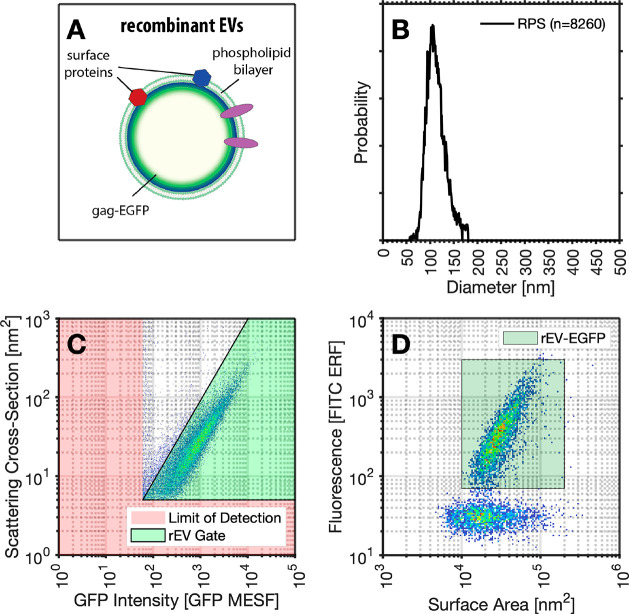
In biological samples, the RI of nanoparticles such as EVs and viruses is often unknown and can be heterogeneous within a population, while the diameter and scattering cross-section can be empirically determined at a single-particle level. We chose to demonstrate RI derivation using commercially available reference materials that are tagged with enhanced green fluorescence protein (EGFP) on intraluminal gag protein of the recombinant EVs, Figure 2A.7 MRPS was chosen as a method that would provide a precise single-particle measurement of the size of a population of reference EVs (Figure 2B). Light scattering cross section and fluorescent intensity were then acquired on the same rEVs using flow cytometry (Figure 2C). EGFP-tagged recombinant EVs (rEVs) were chosen due their intraluminal gag protein labeling that allows fluorescence intensity to scale with surface area along with their commercial availability for ease of accessibility for others wishing to implement the developed protocol,7 demonstrated using fluorescence MRPS, Figure 2D.
Figure 2.
Acquisition of rEV data using FCM and MRPS. (A) Illustration of the structure of enhanced green fluorescent protein (EGFP)-tagged recombinant EVs (rEVs). (B) Resulting rEV diameter distribution from MRPS analysis. (C) Calibrated GFP intensity and light scattering intensity of rEV population with lower limits of detection highlighted in red. (D) Fluorescent MRPS data of rEVs demonstrating the linear relationship between surface area and fluorescence intensity.
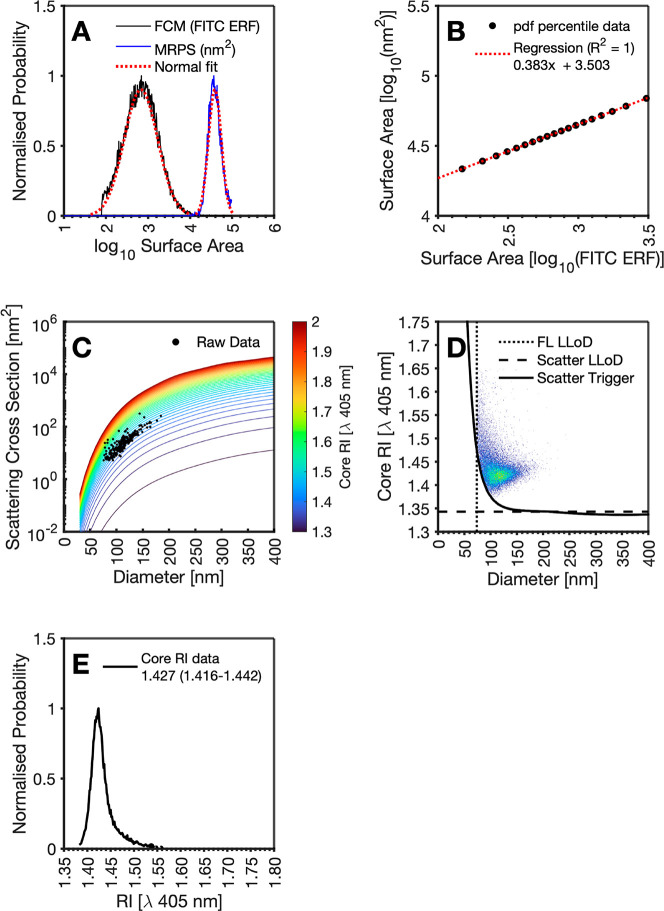
First, we demonstrate Method 1 by deriving single EV core RI using fluorescence and light scattering FCM and MRPS. Calibrated rEV fluorescence intensity measurements from FCM are assumed to be proportional to the surface area of the particle. Data are log transformed and fitted with a Gaussian function, Figure 3A. To convert their fluorescence intensity to standard units of nm,2 they must be scaled to MRPS data. MRPS diameter data are converted to surface area assuming a spherical model. The data are also log transformed and fitted with a Gaussian function, Figure 3A. The first-99th percentiles of both FCM and MRPS distributions were then obtained and plotted against one another with a regression performed, Figure 3B. This regression is used to scale the FCM fluorescence data to nm2.2 Each particle in the FCM data is now assigned with a scattering cross-section and a diameter independently. This allows for the interpolation of these metrics in a precalculated core–shell scatter-diameter database, Figure 3C, to derive the core RI of each particle, Figure 3D. The resulting core RI distribution shows a median RI of 1.427 at 405 nm, interquartile range (IQR) of 0.026, respectively, Figure 3E. This process was repeated assuming a homogeneous sphere, resulting in a median RI of 1.438 at 405 nm and IQR of 0.022.
Figure 3.
Overview of rEV RI determination using fluorescence and light scatter FCM with MRPS using core shell models. (A) Fluorescent distribution of GFP intensity scaled from surface area of a sphere to its diameter (black solid line), with a fitted lognormal distribution to the raw data (dotted blue line). A diameter distribution of rEVs from MRPS (blue solid line) with a fitted lognormal distribution (dotted red line). (B) 1st to 99th percentile of fluorescent scaled diameter lognormal distribution versus 1st to 99th percentile of MRPS diameter lognormal distribution with regression line overlaid (dotted red line). (C) Mie core-shell models with a core of 1.3 to 2 plotted (false color) and raw FCM data overlaid. (D) Diameter versus RI of rEV population derived at a per particle basis using scatter-RI curves. FCM light scatter trigger (black solid line), the fluorescence (FL) limit of detection (dotted black line), and hypothetical lower effective RI determination limit (dashed black line) are plotted for reference. (E) RI distribution of rEV derived RI (solid black line).
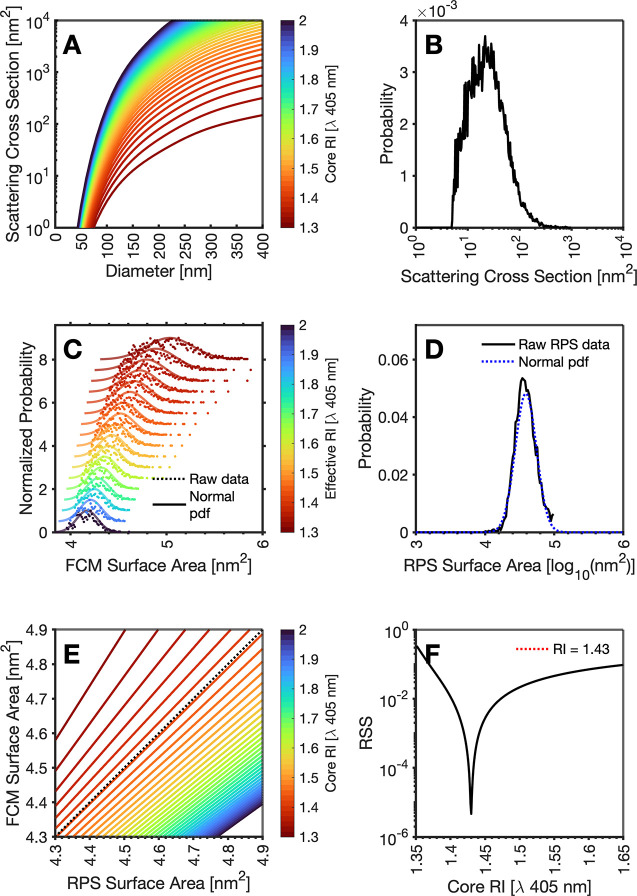
Second, we demonstrate Method 2 by deriving EV population core RI using light scattering FCM and MRPS. The use of FCM light scattering alone to derive RI is performed at a population level rather than a per particle basis. This methodology requires assuming an RI for the sample and interpolating the data with a large database of scatter-diameter curves, Figure 4A. Calibrated FCM light scattering data, Figure 4B, are then inpolated with each curve in the pre-calculated database to derive surface area. assuming a spherical model.This data is log10 transformed before fitting a normal distribution to the resulting distribution, Figure 4C. Figure 4 A normal probability density function is fitted to the rEV MRPS log10 transformed surface area measurements, Figure 4D. The diameters pertaining to the first through 99th percentile are then derived for the distributions of each technology and plotted against one another, Figure 4E, for all RI models tested at a RI increments of 0.0005. The model that is found to have the smallest residual sum of squares (RSS) is then assumed to be the RI for the population, Figure 4F. This results in a core RI of 1.4 with an RSS of 4.63 × 10⁻⁶, with a slope of 0.984 and an intercept of 0.069. This process was repeated instead assuming a homogeneous sphere, Supporting Information, resulting in a closest fitting RI of 1.441 with an RSS of 1.05 × 10⁻⁴, with a slope of 0.927 and intercept of 0.332. The homogeneous sphere model’s RSS value being ∼30-fold higher than that of the core–shell model indicates the core–shell model more accurately represents the population of rEVs.
Figure 4.
Overview of rEV RI determination using light scatter FCM with MRPS using core-shell models. (A) Mie models of core RIs from 1.3 to 2. (B) Calibrated FCM light scattering data of rEVs. (C) Representative surface area distribution raw data (dotted line) with normal distribution (solid line) derived from scattering cross section intensity assuming core RIs of 1.3 to 2.0. (D) Surface area distribution of rEVs from MRPS (black solid line) with a fitted lognormal distribution (dotted blue line). (E) Representative 1st to 99th percentile of lognormal surface area distribution derived from scattering cross section intensity assuming core RIs of 1.3 to 2.0 versus 1st to 99th percentile of MRPS surface area normal distribution with ideal regression line overlaid (dotted black line). (F) Residual sum of squares (RSS) from comparison of lognormal surface area distribution derived from scattering cross section intensity assuming RIs of 1.3 to 2.0 versus 1st to 99th percentile of MRPS surface area normal distribution. The lowest RSS is shown with red dotted line. All models assume a core-shell model with an illumination wavelength of 405 nm, a shell RI of 1.4863, a circular collection half-angle of 67.5° perpendicular to the illuminating wavelength, and a surrounding medium RI of 1.343. Core RIs ranged from 1.3 to 2.0 in increments of 0.0005.
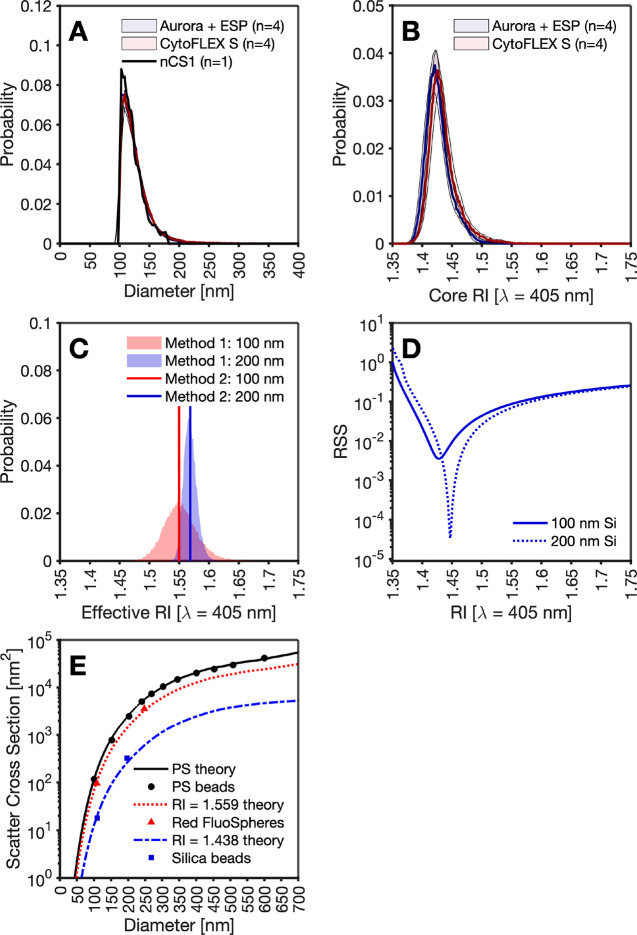
To validate the reproducibility of rEV models irrespective of flow cytometer instrument collection angle, settings, and sensitivity, rEVs were acquired on 8 different cytometers: 4 Aurora + ESP and 4 CytoFLEX S. To make the distributions comparable, measurements were gated to the instrument with the least sensitivity (fluorescence data above 188.6 GFP MESF and light scattering measurements above 66.6 nm polystyrene (RI – 1.6253 at 405 nm)). This resulted in the light scatter derived rEV surface area being limited to 3.15 × 10⁴ nm2 whereby the rEV population was no longer fully resolved, Figure 5A. Due to the surface area being proportional to fluorescence intensity, by calibrating the fluorescence intensity to GFP MESF units, surface area can be derived across platforms with a regression derived from a flow cytometer capable of resolving the full population can be applied to all cytometers. Irrespective of flow cytometer collection optics, settings, and sensitivity, median RI derivations remain concordant across flow cytometers with a mean core RI variation of 1.427 ± 0.005, and no statistical difference between cytometers when a paired t test is performed (p = 0.125), Figure 5B.
Figure 5.
Validation of RI derivation. (A) Overlay of raw MRPS data (black line) with fluorescence derived diameter data from four Aurora FCMs (blue) and four CytoFLEX S FCMS (red). (B) Derived core RI of recombinant extracellular vesicles from four Aurora FCMs (blue) and four CytoFLEX S FCMS (red) using method 1 single particle RI derivation. (C) Effective RI derivation of 100 nm (red) and 200 nm (blue) fluorescent polystyrene beads (FluoSpheres) by method 1 single particle RI derivation (area) and method 2 population-based RI derivation (solid line). (D) Effective RI of nonfluorescent silica (Si) beads of 100 nm (solid blue line) and 200 nm (dotted blue line) beads. (E) Mie theory curves of polystyrene (PS) (black solid line) with median light scatter intensity of NIST-traceable beads (black dots) overlaid. Mie theory curves of median fluorescent polystyrene beads (red dotted line) with overlaid statistics of light scatter intensity (red triangle). Mie theory curves of median non-fluorescent silica beads (blue dashed line) with overlaid statistics of light scatter intensity (blue squares).
The ability of Methods 1 and 2 to derive the RI of polystyrene and silica particles was next tested. To validate Method 1 where fluorescent particles are required, 100 and 200 nm FluoSpheres were used. 100 and 200 nm populations were found to have an effective RI of 1.552 ± 0.027 and 1.569 ± 0.011, Figure 5C. Nonfluorescent silica bead RIs were derived using Method 2, resulting in an RI for 100 nm beads of 1.428 and for 200 nm beads an RI of 1.447, Figure 5D. While derived silica beads fall within an expected RI range, the fluorescent polystyrene beads were lower than what is expected for polystyrene (PS), ∼1.625. Due to both fluorescent PS populations being highly fluorescent with 405 nm excitation, it is anticipated that both populations would have an optical extinction coefficient. Since the optical extinction coefficient cannot be derived simultaneously with the real RI in the implementation used, the result would be the derivation of an effective RI that is lower than polystyrene theory as seen in Figure 5E. Due to hard-dyed beads being swelled, it is also possible that the beads are more porous and have a lower RI than nondyed polystyrene particles.
RI is currently an underutilized metric to characterize biological populations, likely because until now it has been limited to the description of bulk population features. These demonstrated approaches were validated by independently deriving identical RIs for the core–shell and homogeneous sphere models, respectively. Understanding purified population RIs may be used to better characterize EV and virus populations found in more complex biofluids. Emerging evidence suggests that EV populations from different sources may have different RIs.1−3 Much of this evidence, however, has relied upon hydrodynamic diameter derivation for RI determination and may have resulted in underestimation of complex samples.
There are many methods available to size particles; however, as with all methods, there are caveats to consider. NTA determines the hydrodynamic diameter and not the morphological diameter of a particle and can result in oversizing of biological particles, especially those with large surface protein complexes (i.e., labeled with fluorophore conjugated antibodies). Electron microscopy gives an accurate measure of morphological size but is limited in its ability to provide high-throughput sampling.
It is important to note that the accuracy of the methods detailed here is contingent on the accurate sizing of samples. Careful consideration should be taken when choosing the method used to determine size. It is also imperative that calibration between the platforms used is performed and that these instruments have sufficient sensitivity to detect the sample populations below the modal point of its diameter distribution. The use of orthogonal platforms to derive RI for samples that have a distribution where the modal diameter is below the limit of detection on either platform is infeasible, as it would not be possible to accurately correlate orthogonal measurements. However, RI derivation could feasibly be performed irrespective of distribution using FCM by calibrating fluorescence to diameter on the platform itself rather than relying on an orthogonal method.
Sizing of vesicles by FCM using fluorescence was first demonstrated in the mid-90s.8 Fluorescent membrane intercalating dyes can be used to size a population independently of an orthogonal method such as MRPS with the use of a calibration reference population.9 However, the consistency of the relationship between the reference population (such as a liposome) and the biological test sample is critical for accurate sizing, and this is essential for accurate RI derivation. Further investigation utilizing this sizing method would therefore require ensuring that the membrane intercalating dyes have matching lipid:dye ratios between the reference population and biological test samples. This is often challenging, as the membrane and lipid compositions, and therefore dye affinities, may be different between these samples. The excitation and emission spectra would similarly need investigation to confirm similar spectral features among the reference population. The similarity in the absorption of light at the light scattering signal wavelength would also need to be confirmed so as not to result in a complex RI that would be applicable only to a specific assay. The use of fluorescent MRPS to validate the diameter distribution of EVs from complex mixtures and the development of increasingly more sensitive flow cytometers may, however, circumvent the reliance on the use of membrane intercalating dyes alone to size samples in order to derive RI.
This work was limited to deriving the core RI of an EV population with assumptions about the membrane RI and thickness. However, the methodology presented here in principle could also be used to derive membrane thickness, membrane RI, core RI, and imaginary parts of the RI at a population level simultaneously. This would be carried out by creating an exhaustive database of every combination of these variables and sequentially interpolating the raw data with each scatter-diameter curve. A statistic comparing the fit would then be obtained by comparing the fluorescently derived diameter to the scatter derived diameter from each model. This extrapolated implementation would, however, require access to large computational resources, not only to calculate the exhaustive database but also to utilize the subsequent database in our presented methodology.
The methods demonstrated here provide a new set of tools to combine the use of readily accessible technologies to describe the RI of a biological population more accurately. These methods will contribute to current characterization efforts for EV and viruses by enabling measurements of RI, a feature of these biological samples.
Acknowledgments
J.A.W. is an International Society for Advancement of Cytometry (ISAC) Marylou Ingram Scholar (2019–2023). V.A.T. is an ISAC Shared Resource Lab Emerging Leader (2018–2023). The authors would like to thank Christian V. Ouellet for critical discussions.
Supporting Information Available
The Supporting Information is available free of charge at https://pubs.acs.org/doi/10.1021/acs.nanolett.3c00562.
Reference material preparation, flow cytometry methods, resistive pulse sensing methods, statistical analyses, light scattering background, derivation of single particle refractive index, derivation of population based refractive index (PDF)
Author Contributions
# M.L.P. and S.C. are cofirst authors. J.C.J. and J.A.W. are cosenior authors.
S.C., J.C.J., and J.A.W. were supported by the Intramural Research Program of the NIH, NCI, Center for Cancer Research. J.C.J. acknowledges NIH ZIA BC011502, ZIA BC011503, UG3 TR002881, and the Prostate Cancer Foundation. M.L.P. was funded through a fellowship research grant from the National Multiple Sclerosis Society (Grant number FG-2107-38321).
The authors declare the following competing financial interest(s): J.A.W. and J.C.J. are inventors on NCI patents and patent applications related to extracellular vesicle analysis.
Supplementary Material
References
- van der Pol E.; Coumans F. A.; Sturk A.; Nieuwland R.; van Leeuwen T. G. Refractive index determination of nanoparticles in suspension using nanoparticle tracking analysis. Nano Lett. 2014, 14, 6195–6201. 10.1021/nl503371p. [DOI] [PubMed] [Google Scholar]
- Gardiner C.; et al. Measurement of refractive index by nanoparticle tracking analysis reveals heterogeneity in extracellular vesicles. J. Extracell Vesicles 2014, 3, 25361. 10.3402/jev.v3.25361. [DOI] [PMC free article] [PubMed] [Google Scholar]
- Kashkanova A. D.; Blessing M.; Gemeinhardt A.; Soulat D.; Sandoghdar V. Precision size and refractive index analysis of weakly scattering nanoparticles in polydispersions. Nat. Methods 2022, 19, 586–593. 10.1038/s41592-022-01460-z. [DOI] [PMC free article] [PubMed] [Google Scholar]
- Welsh J. A.; Jones J. C.; Tang V. A. Fluorescence and Light Scatter Calibration Allow Comparisons of Small Particle Data in Standard Units across Different Flow Cytometry Platforms and Detector Settings. Cytometry A 2020, 97, 592–601. 10.1002/cyto.a.24029. [DOI] [PMC free article] [PubMed] [Google Scholar]
- van der Pol E.; et al. Absolute sizing and label-free identification of extracellular vesicles by flow cytometry. Nanomedicine 2018, 14, 801–810. 10.1016/j.nano.2017.12.012. [DOI] [PubMed] [Google Scholar]
- de Rond L.; et al. Refractive index to evaluate staining specificity of extracellular vesicles by flow cytometry. J. Extracell Vesicles 2019, 8, 1643671. 10.1080/20013078.2019.1643671. [DOI] [PMC free article] [PubMed] [Google Scholar]
- Geeurickx E.; et al. The generation and use of recombinant extracellular vesicles as biological reference material. Nat. Commun. 2019, 10, 3288. 10.1038/s41467-019-11182-0. [DOI] [PMC free article] [PubMed] [Google Scholar]
- Fuller R. R.; Sweedler J. V. Characterizing submicron vesicles with wavelength-resolved fluorescence in flow cytometry. Cytometry 1996, 25, 144–155. . [DOI] [PubMed] [Google Scholar]
- Stoner S. A.; et al. High sensitivity flow cytometry of membrane vesicles. Cytometry A 2016, 89, 196–206. 10.1002/cyto.a.22787. [DOI] [PubMed] [Google Scholar]
Associated Data
This section collects any data citations, data availability statements, or supplementary materials included in this article.


