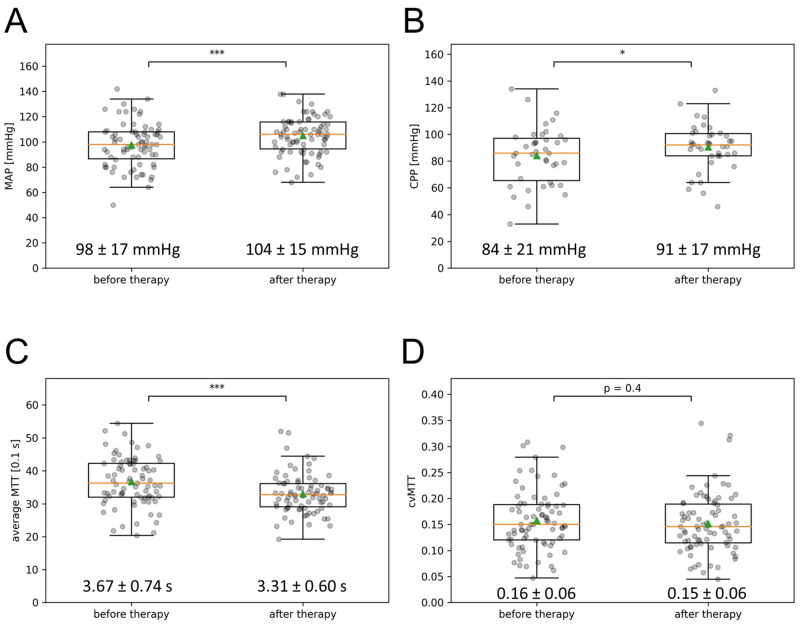
Figure 2.
Effect of multimodal therapy on MAP, CPP, mean MTT, and cvMTT. (A) The MAP, (B) the CPP, (C) the mean MTT, and (D) the cvMTT at the time of the first and second CTP imaging are depicted in the box-and-whisker plots; boxes represent the interquartile range limited by the 25th and 75th percentile, the green triangle symbolizes the mean, the orange line the median, and the whiskers represent the maximum and minimum values. Values written out as mean ± SD (* p < 0.05; *** p < 0.001). CPP = cerebral perfusion pressure, cvMTT = coefficient of variation for MTT, MAP = mean arterial pressure, MTT = mean transit time, s = second.

