

SUMMARY
SARS-CoV-2 variants of concern (VOCs) emerged during the COVID-19 pandemic. Here, we used unbiased systems approaches to study the host selective forces driving VOC evolution. We discovered VOCs evolved convergent strategies to remodel the host by modulating viral RNA and protein levels, altering viral and host protein phosphorylation, and rewiring virus-host protein-protein interactions. Integrative computational analyses revealed that although Alpha, Beta, Gamma, and Delta ultimately converged to suppress interferon-stimulated genes (ISGs), Omicron BA.1 did not. ISG suppression correlated with expression of viral innate immune antagonist proteins, including Orf6, N and Orf9b, which we mapped to specific mutations. Later Omicron subvariants BA.4 and BA.5 more potently suppressed innate immunity than early subvariant BA.1, which correlated with Orf6 levels, though muted in BA.4 by a mutation that disrupts the Orf6-nuclear pore interaction. Our findings suggest SARS-CoV-2 convergent evolution overcame human adaptive and innate immune barriers, laying the groundwork to tackle future pandemics.
IN BRIEF
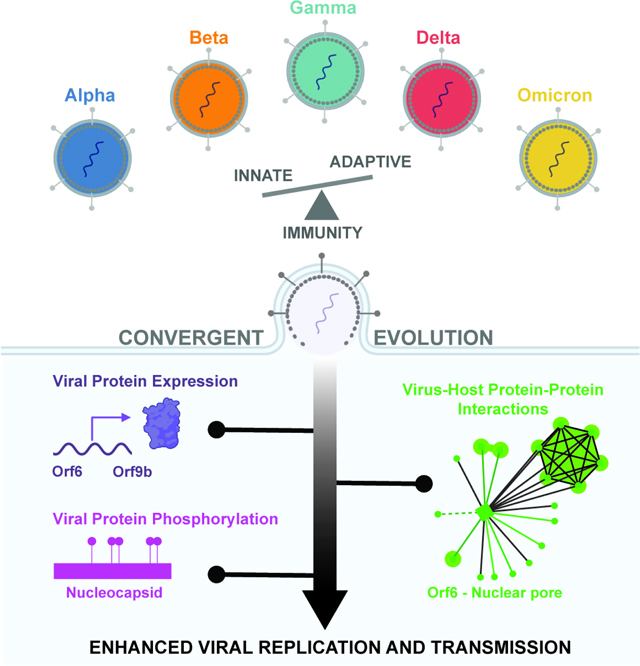
Systems proteomic and genomic analysis reveals that SARS-CoV-2 variants of concern respond to the selective forces of the host immune response by modulating viral protein expression, phosphorylation, and virus-host protein-protein interactions. Variants have converged on similar strategies for innate and adaptive immune evasion, suggesting implications for predicting viral transmission and for tackling future viral pandemics.
Graphical Abstract
INTRODUCTION
The emergence and spread of coronavirus SARS-CoV-2, the causative agent of the COVID-19 pandemic, continues to impact public health and global economies. SARS-CoV-2 variants of concern (VOCs) emerged in September 2020 (Fig. 1A). Phylogenetic studies indicate that the VOCs evolved independently from early-lineage wave 1 (W1) viruses, with VOCs Alpha, Delta, and Omicron BA.1 spreading globally whereas Beta and Gamma remained geographically restricted. Omicron’s highly mutated Spike protein represents the most significant antigenic change to date, escaping adaptive immunity from vaccines and prior infections 1–4. Omicron BA.1 and BA.2 were rapidly replaced by BA.4 and BA.5, suggesting Omicron was the first VOC to give rise to globally dominant subvariants 2,5,6. The emergence and evolution of VOCs were likely driven by selective pressures to adapt to a new host (i.e., humans) and escape innate and adaptive immune responses, facilitating increased human-to-human transmission.
Figure 1. VOCs impact RNA and protein landscape during infection.

(A) Global COVID-19 case numbers (log2 transformed) over time, annotated for each SARS-CoV-2 variant of concern (VOC) based on sequences from GSAID. Thin lines reflect raw counts, and thick lines represent a LOESS fit. Inset: y-axis is displayed in linear scale.
(B) Number of protein coding and non-coding mutations for each VOC. Data were from covariants.org on Jan 5, 2022, and correspond to Alpha 20I V1, Beta 20H V2, Delta 21J, Gamma 20J V3, and Omicron 21K.
(C) Number of protein coding mutations per protein in the VOCs.
(D) Experimental workflow. Infected Calu-3 cells were harvested at 10 and 24 hours post-infection (hpi) and processed for bulk mRNA sequencing and global mass spectrometry abundance proteomics and phosphoproteomics. We additionally performed affinity purification mass spectrometry (AP-MS) on individually overexpressed VOC and W1 viral proteins in HEK293T cells to quantify changes in virus-host protein interactions.
(E) Quantitative reverse-transcription PCR (qRT-PCR) for viral E gene copies to quantify viral replication over time for each experiment. Calu-3 lung epithelial cells were infected with 2000 E copies/cell of each SARS-CoV-2 VOCs, VIC, IC19 or mock. Stars indicate significant difference relative to time-matched VIC (adjusted p-value < 0.05).
(F) Viral replication over time in experiments 1 and 2 based on Orf1a leader sequence-containing counts from bulk mRNA sequencing.
(G) Quantification of the sum of non-structural protein intensities from abundance proteomics for each virus in experiment 1 or 2 at 10 and 24 hpi in Calu-3 cells.
(H) Flow cytometry assessing the percentage of cells positive for nucleocapsid (N) staining for each virus at 10 and 24 hpi in Calu-3 cells. Error bars represent standard error (SE).
(I) Fraction of mRNA, protein, or phosphorylation sites that change (black; abs[log2FC]>1 & q<0.05) in response to infection with at least one virus, for at least one time, in at least one experiment, relative to mock. Fraction of protein-protein interactions from AP-MS data that change between VOC and W1 viral proteins (abs[log2FC]>0.5 & p<0.05; right bar).
(I) Number of mRNA transcripts, proteins, or phosphorylated peptides that increase or decrease for each condition and time, compared to mock. Numbers in parentheses indicate experiment number.
SARS-CoV-2 Spike mediates cell entry via host receptor ACE2 and is the most-mutated VOC protein. However, VOCs have acquired additional non-synonymous mutations in non-structural, structural, and accessory proteins, including Nsp3, Nsp6, Nsp9, Nsp12, Nsp13, nucleocapsid (N), membrane (M), envelope (E), Orf3a, Orf6, Orf7a, Orf7b, Orf8, and Orf9b. Each VOC has 20–29 non-synonymous consensus mutations, while Omicron BA.1 has 62 non-synonymous consensus mutations, mostly within the Spike protein (Fig. 1B–C, Table S1). Each VOC possesses 4–10 non-coding mutations (Fig. 1B). We previously found that adaptations outside of Spike affect the host response to infection, evidenced by the Alpha variant evolving enhanced innate immune evasion by modulating specific viral protein levels 7, likely contributing to enhanced transmission. However, regulation of viral protein expression and the impact of mutations outside of Spike across VOCs, including non-coding mutations, remains poorly understood.
We propose that the development of prophylactic and therapeutic antivirals depends on understanding SARS-CoV-2 evolution and the host responses that variants provoke, which could help us confront future variants. Here, we report a comparative proteomic and genomic analysis of VOCs to understand how SARS-CoV-2 evolution impacts the host molecular landscape. We uncover convergent evolution among VOCs to evade innate immune responses and develop human-specific adaptations that likely influence human-to-human transmission.
RESULTS
Variants remodel the host molecular landscape during infection
To understand the effect of VOC mutations on viral replication and cellular responses, we systematically analyzed SARS-CoV-2 variants during infection in human airway epithelial cells. We compared the VOCs (Alpha, Beta, Gamma, Delta, and Omicron BA.1) and two early-lineage wave 1 (W1) isolates: (i) VIC, isolated in Victoria, Australia and (ii) IC19, isolated in Europe, both in early 2020, the latter harboring the Spike D614G mutation. We collected VOC-infected Calu-3 cells from two independent infections (experiments 1 and 2) harvested at 10 and 24 hours post-infection (hpi) for bulk mRNA sequencing (RNA-seq), mass spectrometry abundance proteomics, and phosphoproteomics (Fig. 1D) analysis.
Comparisons require similar numbers of infected cells across the VOCs. To equalize input doses across variants, we determined genome levels of viral stocks by quantitative reverse transcription PCR (RT-qPCR) instead of using TCID50 or plaque assays because cellular tropism is altered by spike mutations in VOCs (Meng et al. 2022; Plante et al. 2021), which would confound cellular measurement of viral infectivity. Infections were normalized by using 2000 viral RNA copies/cell instead of using TCID50 or plaque assays because cellular tropism is altered by spike mutations in VOCs (Meng et al. 2022; Plante et al. 2021), which would influence measurements of viral infectivity and confound the analysis. Supporting our dosing strategy, we observed equivalent replication kinetics by RT-qPCR detecting viral E RNA (Fig. 1E), mRNA sequencing (sum of ssRNA genome reads; Fig. 1F), proteomics (sum of non-structural proteins, or Nsps; Fig. 1G), and flow cytometry of fluorescently labeled N+ cells (Fig. 1H) for W1 viruses and all VOCs, except for Omicron BA.1, which displayed reduced replication (Fig. 1E–H). We also compared viral replication kinetics in air-liquid-differentiated primary human airway epithelial (HAE) cells. In HAE’s, replication of the VOCs outpaced W1 IC19 consistent with VOC adaptation, providing a replication advantage not realized in the Calu-3 model (Fig. S1A–C). This observation illustrates the utility of the Calu-3 model in which similar replication permits a detailed genomic and proteomic comparison of host responses. We additionally performed affinity purification-mass spectrometry (AP-MS) on ectopically overexpressed VOC and W1 proteins to define changes in virus-host protein interactions (Fig. 1D).
Across virus and host, our proteomics data captured 58,000–62,000 unique peptides (Fig. S1D) mapping to 4800–5100 proteins (Fig. S1E) per sample for abundance, and 23,000–35,000 unique phosphorylated peptides (Fig. S1F–G) mapping to 3700–4300 phosphorylated proteins (Fig. S1H), with strong reproducibility across biological replicates and experiments (Fig. S1I–J). Most changes were at the RNA (38%) and phosphorylation (57%) levels with fewer changes in protein abundance (7%; Fig. 1I). Comparing VOC to W1 viruses revealed 16% of changes in virus-host interactions (Fig. 1I). We observed a trend of global RNA expression increase and protein decrease at 24 hpi, likely representing induction of the inflammatory response to virus at the host RNA level and a virus-induced host translational blockade during infection at the protein level 8–10 (Fig. 1J). Phosphorylation levels were equivalently bi-directional, reflecting the complexity of phosphorylation signaling during infection (Fig. 1J).
Systematic comparison of VOCs and W1 viruses revealed three convergent molecular strategies used to alter the virus-host molecular landscape, presented in the following figures. First, all VOCs had altered viral gene expression during infection. Second, all, except Gamma, showed evidence of modulating viral protein phosphorylation, notably on the nucleocapsid protein. Third, all contained protein-coding mutations that altered virus-host protein interactions (Fig. 2A).
Figure 2. Convergent molecular strategies of VOCs.

(A) Comparative systems omics revealed VOCs converge on key molecular strategies to remodel the host environment by altering viral gene expression, viral protein phosphorylation, and virus-host protein complexes relative to W1 viruses.
(B-C) Normalized read counts from bulk mRNA sequencing containing the leader sequence and mapping to a portion of the SARS-CoV-2 genome (B) or normalized protein intensities from abundance proteomics (C) at 24 hpi in Calu-3 cells. RNA quantities are normalized to Orf1a genomic (log2(counts/genomic/W1)) per virus and viral protein intensities to the summed intensity of Nsps (log2(intensity/sum of nsps/W1)) to control for differences in viral replication and defined relative to W1 virus VIC. Experiments 1 and 2 were integrated after normalization. Stars indicate abs(log2FC)>1 & adjusted p-value < 0.05.
(D) Absolute value log2 VOC- and VIC-normalized viral protein quantities from (C) for each VOC. Colored dots indicate proteins regulated more than twofold in expression, compared to VIC. Dashed line denotes twofold expression change. All VOCs encode at least one viral protein expression change relative to VIC and IC19.
(E) SARS-CoV-2 Orf9b viral RNA and protein for Alpha and Delta isolated from (B) and (C).
(F) Genomic sequence of the region surrounding the start of the N gene. “−3” indicates three nucleic acid positions upstream of the N translation start (“N start”). Orf9b translation start (“Orf9b start”) is indicated within the N coding region. Mutations in Alpha (−3 deletion and N protein D3L) and Delta (−3 deletion only) are indicated in red. The Orf9b transcriptional regulator sequence (TRS) is also indicated and is thought to be enhanced by the GAU→CUA.
(G) Depiction of how mutations colored red in (F) may affect transcription and translation of Orf9b.
(H) Expression of viral sgRNA (from bulk mRNAseq) and protein (bulk proteomics) from mutant viruses (derived via reverse genetics approaches) at 48 hpi in Calu-3 (MOI=0.01): one with a N D3L mutation (GAU→CUA), one with a −3 deletion upstream of N start, and one with both. Quantifications are normalized to genomic (RNA, log2(counts/genomic/W1)) or summed intensity of all Nsps (protein, log2(intensity/sum of nsps/W1)) per virus to control for differences in viral replication and defined relative to wave 1 virus from Washington, USA (USA-WA1/2020)
(I) Absolute value t-statistic from t-tests comparing phosphorylated peptide intensities between all possible pairs of viruses (see Table S2 and Methods). Each dot represents one phosphopeptide compared between two viruses. Intensities are normalized by corresponding total protein abundance. Comparisons were restricted to viral peptides with identical sequences between virus pairs, given that peptide intensities of peptides with different sequences are not directly comparable using mass spectrometry. If p≤0.001, dots are colored black, otherwise they are grey.
(J) The t-statistic from t-tests in (I) restricted to phosphorylation sites on N and relative to VIC. If p≤0.001, dots are colored black, otherwise they are grey. All VOCs, except Gamma, show evidence of remodeling N protein phosphorylation relative to VIC.
(K) Significantly changed phosphorylation sites (p≤0.001) on N protein between pairs of viruses. Length of each lollipop depicts the abs(t-statistic) between the pairs of viruses.
(L) In vitro ADP-GLO kinase activity assay of 122 recombinant kinases (predicted to phosphorylate N protein sequence based on GPS 5.0) incubated with full-length recombinant W1 SARS-CoV-2 N protein.Y-axis depicts the log2 fold-change between the kinase incubated with N or alone. Red indicates our positive control, SPRK1 and GSK3β co-incubated with full-length N 17. Labeled kinases indicate those with greater activity against N than our positive control and at least half the magnitude of the canonical positive control substrate for that kinase.
(M) Quantified changes in protein-protein interactions for 127 protein-coding mutations in 16 mutated viral proteins across all 5 VOCs. Left, number of high confidence virus-human interactions for all mutant VOC and wave 1 (W1) viral proteins using APMS. Of 1746 interactions, 1473 were unchanged (gray), 150 increased in binding affinity with at least one mutant (red), and 123 decreased in binding affinity with at least one mutant (blue). Significant increase in mutant binding affinity (red) is defined as log2 fold-change>0.5 & p<0.05. Significant decrease in mutant binding affinity (blue) is defined as log2 fold-change<−0.5 & p<0.05. Right, same but broken down by VOC.
(N) Virus (“bait”, diamonds) host (“prey”, circles) protein-protein interaction (PPI) map for N*, Orf9b, and Orf6 depicting significantly changing interactions (absolute value log2 fold-change>0.5 & p<0.05) comparing VOC to W1 forms (see Fig 3 and Table S3).
VOCs evolved to modulate viral RNA and protein production
To study the functional effects of VOC mutations, we quantified differences in viral subgenomic RNA (sgRNA) and protein levels for each virus during replication in Calu-3 cells, which were normalized to the amount of viral RNA or non-structural proteins, and compared to W1 virus VIC (Table S2, see Methods). Large differences in expression of sgRNA transcripts and proteins corresponded to structural and accessory genes, which are independently expressed by discontinuous transcription (Fig. 2B–C, S2A), but not non-structural proteins (Nsp) (Fig. 2C), which are expressed from genomic RNA and translated as a polyprotein. Each VOC evolved to modulate viral gene expression levels relative to W1 viruses, with each VOC showing at least a twofold change in expression of at least one viral protein (Fig. 2D). Viral RNA and protein expression did not always correlate (Fig. S2B), suggesting independent regulation of transcription and protein expression. For example, Orf6 expression by Omicron BA.1 showed up-regulated sgRNA but down-regulated protein levels, relative to VIC (Fig. 2B–C, S2B), and Orf9b showed increased protein levels for Alpha and Delta, but only Alpha had upregulated Orf9b-specific sgRNA levels (Fig. 2E, S2B).
We and others previously reported Orf9b expression increases during Alpha infection 7,11 and hypothesized Orf9b sgRNA and protein expression to be controlled by distinct mutations. Orf9b is in an alternative reading frame within N. Two mutations are hypothesized to regulate Orf9b expression. First, the triple nucleotide substitution that gives rise to N D3L (Fig. 2F) increases complementarity of the genomic transcriptional regulatory sequence (TRS) leader (TRS-L) and the Orf9b TRS body (TRS-B), which should increase Orf9b-specific sgRNA expression (Fig. 2G). Second, a single nucleotide deletion at position −3 upstream of N changes the N Kozak context and therefore should increase Orf9b abundance by increasing leaky ribosomal scanning of the N sgRNA. Alpha contains both mutations and upregulates Orf9b sgRNA and protein levels, but Delta contains only the −3 deletion and increased Orf9b protein, but not sgRNA, levels (Fig. 2E, S2C). Here, we generated a mutant virus with either a N D3L, a −3 A deletion, or both in a W1 background (USA-WA1/2020 background, see Methods). mRNAseq and proteomics analyses during infection of Calu-3 cells with each virus confirmed that the D3L mutation alters Orf9b sgRNA levels while the −3 deletion controls Orf9b protein production, suggesting the latter is the principal driver of Orf9b protein expression (Fig. 2H, S2D). Interestingly, Beta and Gamma also display upregulated Orf9b protein levels (Fig. 2C), although lower than Alpha and Delta, but have neither of the mutations discussed herein (Fig. 2F), indicating that additional mechanisms regulate Orf9b expression.
We and others reported expression of a new sgRNA and protein of the Alpha VOC, called N* (“N-star”) 7,11, a truncated version of N (i.e., position 210 to the C-terminus of N). N* sgRNA and protein were specifically expressed by Alpha, Gamma, and Omicron (Fig. S2E), all of which possess the R203K/G204R double substitution in N, leading to a novel TRS that should control N* expression (Fig. S2F). To test this, we generated a mutant virus with the R203K and G204R mutations (GGG→AAC) in a W1 background. Global mRNA sequencing during replication in Calu-3 cells confirmed specific N* expression by the R203K/G204R mutant but not the control virus (Fig S2G). N* expression was approximately half of that during Alpha infection (Fig. S2H), despite normalization of infection levels, suggesting additional mechanisms contribute (e.g., Alpha upregulation of N sgRNA may increase N* transcripts).
As the function of N* is still unknown and full-length N is known to play a role in viral genome packaging, we evaluated the effect of N* on packaging and infectivity. We used a SARS-CoV-2 virus-like particle (VLP) system 12 that contains N, S, M, and E proteins and a reporter genome encoding luciferase (Fig. S2I, see Methods). Surprisingly, N* packaged RNA and produced infectious VLPs without full-length N (Fig. S2J), even though it lacks the canonical N-terminal RNA binding domain, suggesting alternative packaging mechanisms, perhaps involving phase separation 13. Using the VLP assay, we compared the impact of each VOC N on virion assembly. Omicron BA.1 N produced >10x more infectious units than W1 N, as reported 14, and the other N-bearing VLPs produced intermediate amounts (Fig. S2K). This suggests that all the VOCs bear adaptations in N that enhance genome packaging, particle production and infectivity.
VOCs evolved altered nucleocapsid phosphorylation
We have previously shown that phosphorylation of viral proteins regulates their activity 7. Therefore, we systematically compared viral protein phosphorylation across every pair of VOCs and between VOCs and W1 viruses during infection (Table S2, see Methods). Across all viruses, we detected 53 phosphorylation sites, mapping to Nsp1, Nsp3, S, M, N, and Orf9b (Fig. S3A). Interestingly, 43% (23/53) of detected phosphorylation sites were differentially phosphorylated between at least one pair of viruses, localized to Nsp3, M, N, and Orf9b, with most regulated sites (20/23 or 87%) on N (Fig. 2I). Every VOC, except Gamma, displayed altered N protein phosphorylation relative to wave 1 virus VIC (Fig. 2J). Differential regulation of phosphorylation was observed across the N protein surface, with two predominant clusters localized at the N-terminal region (S21-S33) and linker region after the RNA binding domain (Y172-S202) (Fig. 2K). Interestingly, we detected a strong variant-specific decrease in N-terminal (S23-S26) phosphorylation on N protein for Beta compared to all other viruses at 24hpi (Fig. S3B; Omicron BA.1 was excluded due to mutations in this region). We also observed increased phosphorylation of the Beta and Omicron N linker region (S176, S183, and S184) and decreased phosphorylation of Omicron N S79 compared to other viruses (Fig. S3B).
Phosphorylation of N protein impacts RNA binding, packaging, and viral assembly 13,15,16, suggesting N phosphorylation by VOCs affects the viral lifecycle, perhaps influencing viral genome sensing. For example, phosphorylation of N is enhanced in viruses encoding the R203K/G204K mutation 16 (e.g., Alpha, Omicron BA.1), and a differential phosphorylation pattern in this region among VOCs may enhance viral replication 16,17. To identify human kinases that phosphorylate N, 122 kinases were tested with full-length N using an in vitro ADP-GLO assay, selected if they contained a known kinase motif on N 18 or were found regulated during infection 10. Twelve/122 kinases (PKCβ [PRKCB], EEF3K, PKCɑ [PRKCA], PKCɣ [PRKCG], PKCθ [PRKCQ], PKCΔ [PRKCD], TTBK1, EGFR, FGFR4, TTBK2, PKN1, and SPRK2) had equal or greater activity against N than GSK3β and SPRK1, previously reported to control N phosphorylation (Fig. 2L) 17. Future work will determine the impact of these kinases on regulating N phosphorylation during VOC replication.
VOC evolution rewires virus-host protein-protein interactions
To assess the consequences of VOC adaptation, we performed an integrative sequence and structure analysis of mutations cataloged by GISAID (Fig. S3C). Our analysis predicted VOC mutations would not disrupt protein folding, as expected given protein core disruptions are likely disadvantageous. VOC mutations were more likely to be surface accessible, consistent with a role in modulating virus-host protein-protein interactions (PPIs).
To evaluate the effects directly, we expressed VOC and W1 viral proteins with 2x strep-tags in HEK293T cells and quantitatively compared virus-host protein-protein interactions between VOC and W1 viral proteins by affinity purification-mass spectrometry (AP-MS) 19,20 (Table S3). This covered 127 non-synonymous mutations spanning 16 viral proteins across Alpha (six viral proteins), Beta (9), Gamma (8), Delta (14), and Omicron BA.1 (11). Out of 1746 high-confidence interactions, 273 (16%) were significantly different between VOC and W1 forms (abs[log2FC]>0.5 & p<0.05), 150 with increased (red) and 123 with decreased (blue) affinity for the VOC version (Fig. 2M, left). All VOCs evolved protein-coding mutations that altered virus-host protein complexes (Fig. 2M, right), and differential interactions were observed for most viral proteins, except for Nsp2 and Nsp6 (Fig. S3D). We profiled individual mutations or mutation subsets across the VOCs to pinpoint how specific mutations impacted the changes (Fig. S4).
Given that N* is lowly expressed (1–2% of total viral sgRNA reads compared to 15–55% for full-length N; Fig. S2C), we hypothesized it has an additional function. The differential PPI map revealed a novel and specific association between N* and the RNAPII-associated factor (PAF) complex, specifically complex members PAF1, LEO1, IWS1, WRD61, CDC73, and CTR9 (Fig. 2N) 21–23, an interaction we confirmed using AP-western blot analysis (Fig. S3E). PAF interactions were absent from any of the full-length VOC or W1 N APs (Fig. 2N, S3E), suggesting the evolution of novel host gene regulation by N*-expressing VOCs (Alpha, Gamma, and Omicron), perhaps similar to influenza NS1 protein that targets PAF 24. Other changes include the enhanced interaction between Delta Orf9b and three MARK kinases (MARK1–3; Fig. 2N), validated by AP-western blot analysis (Fig. S3F). MARK2 is important in cell polarization 25 and an increased interaction with Delta Orf9b could modulate epithelial cell apical/basal integrity to increase viral infection. The interaction between Orf6 D61L (found in Omicron BA.2 and BA.4) and the nuclear pore complex (RAE1 and NUP89; Fig 2N, right) was decreased. Interaction of Orf6 with the nuclear pore reduces the innate immune response by suppressing nuclear import of IRF3, STAT2, and export of ISG mRNAs (see accompanying paper) 26, suggesting modulation of the innate immune response by these variants. The entire VOC differential PPI map is presented in Figure 3.
Figure 3. VOC evolution rewires virus-host protein-protein interactions.

Virus (“bait”, diamonds) host (“prey”, circles) protein-protein interaction (PPI) map for significantly changing interactions (absolute value log2 fold change>0.5 & p<0.05) comparing VOC to W1 forms (see Table S3). Color of edge represents log2 fold change in the abundance of each human prey protein in the affinity purification as determined by mass spectrometry, comparing VOC and W1 forms. Multiple edges are displayed when the same affinity purification was performed multiple times and both results were significantly differentially interacting. Black edges indicate human-human protein complexes annotated by CORUM 63, also highlighted and annotated using yellow shading. Biological processes are indicated using cyan shading.
Comparative systems analysis characterizes the cellular host response to VOCs
We next sought to understand how VOC infections affect host cellular biology. To this end, we developed an integrative computational analysis of our omics datasets to (i) map therapeutic targets for pan-variant antivirals by identifying similarly hijacked cellular processes and (ii) uncover how viral evolution leads to divergent host responses. Compiling differentially regulated host genes and proteins (as compared to mock) from our datasets yielded 5284 genes regulated during infection (Fig. 4A). We overlaid regulated genes onto the STRING network 27 and used measures of network proximity to cluster genes into 85 pathway modules (Fig. 4B, Table S4). Gene regulation per module was quantified as the average absolute value log2 fold-change of genes within each module, separately for RNA, protein abundance, and phosphorylation, generating a single metric per module, per virus (Fig. 4C). Most modules followed a general trend, which we defined as the Average Host Response (AHR; average regulation across modules). For example, the AHR was greater during Delta than VIC infection. The AHR correlated well with the viral RNA (genomic reads; R=0.59) and protein (sum of non-structural proteins; R=0.77) produced for each virus, suggesting the AHR represents a generalized cellular response to infection, proportional to viral replication (Fig. 4D).
Figure 4. Integrative computational analysis reveals conservation and divergence of host response to variants.

(A) Number of RNA transcripts, proteins, or phosphorylation sites that significantly changed during VOC infection, compared to mock at 24 hpi. For transcriptomics and phosphoproteomics, we required absolute value log2 fold-change log2FC >1 and p<0.001. For abundance proteomics, we required abs(log2FC)>log2(1.5) & q<0.05. For each dataset, a molecule had to pass the threshold twice at either times, viruses, or experiments.
(B) Flowchart of computational pipeline. Host genes regulated during infections from (A) were extracted from the STRING network and clustered into 85 pathway modules based on a diffusion measure of network node proximity (see Methods).
(C) Average absolute value log2 fold-change versus mock for each module (gray lines) using RNA or phosphorylation data. Virus conditions are ordered by their timeline of emergence around the world. The purple line defines the average across the module intensities to define the AHR.
(D) Pearson’s R correlation between viral genomic (leader + Orf1a) RNA counts (R=0.59) or sum of non-structural protein (Nsps) intensities (R=0.77) versus VIC plotted against the AHR defined in (C). Each dot represents one virus condition at 24 hpi.
(E) Pearson’s R correlation between the average log2 fold-change of each module, per dataset, and the RNA-derived AHR. Red dots indicate 10 modules most correlated with the AHR, based on a geometric mean across RNA, abundance proteomics, and phosphoproteomics datasets (“composite R”). Blue dots indicate 10 modules least correlated with AHR.
(F) 10 most (red; highest correlation coefficients) and 10 least (blue; lowest correlation coefficients) correlated modules with AHR, annotated by the most prevalent GO Biological Process term, module number, and number of genes within the module that connect to the top GO term. The x-axis depicts the composite R value (defined in E). Colored numbers indicate ranking of modules based on composite R. Terms in bold highlight prevalent biological categories: translation related terms in top 10 and innate immune/inflammation related terms in the bottom 10. Red modules represent pathways similarly regulated by all variants (“less variant specific”). Blue modules represent pathways differently regulated across the variants (“more variant specific”).
(G) t-Distributed Stochastic Neighbor Embedding (t-SNE) plot representing the STRING network proximity between genes, colored according to the module annotation. Top (red) and bottom (blue) 10 modules are bolded, and their locations are annotated using contours.
(H) Innate immune- and inflammation-related modules within the 10 least correlated with the AHR.
(I) RNA and protein expression of interferon stimulated genes (ISGs) and RNA expression of proinflammatory genes at 24 hpi in Calu-3 cells. Expression is defined as the average log2FC of ISGs or proinflammatory genes (see Table S4 for list of genes) for each virus compared to VIC and averaged across batches. Error bars depict SE. Proinflammatory genes were sparsely detected at the protein level and excluded.
(J) Western blot of MX1, IFIT1, IFITM3, and SARS-CoV-2 nucleocapsid (N) protein expression in Calu-3 cells infected with 2000 E copies/cell at 24 hpi. Protein quantification over β-actin is shown normalized to IC19 levels.
(K) Correlation of viral genomic (leader + Orf1a) counts and ISG expression (versus VIC) over time. Viral counts are represented as transcripts per million. Times 10 and 24 hpi are represented by circles and triangles, respectively.
(L) Viral replication of Alpha, Delta, or Omicron BA.1 in Calu-3 cells at 48 hpi with and without ruxolitinib, a JAK/STAT inhibitor. Fold-change between conditions is noted.
(M) Relationship between ISG and proinflammatory gene expression for each virus at 24 hpi in Calu-3 cells relative to VIC for RNA.
(N) Pearson’s R correlation between average log2FC for each module and levels of each viral protein across the viruses. Innate immune and inflammatory modules in the 10 least correlated category, including one additional innate immune term ranked 11th (m43, regulation of immune response), are colored. Viral proteins are ranked from left-to-right according to the average R values across the five inflammation-related terms.
We utilized the AHR to identify similarities and differences in the host response to infection across viruses. Systematic correlation of each module versus the AHR revealed most processes to be similar across VOCs (Fig. 4E), highlighting the host pathways modulated in concert with a general cellular response to infection. The 10 modules with the highest correlation coefficients related to cell cycle, protein folding, RNA translation and processing, chromosome organization, and the cytoskeleton (Fig. 4F, top). Some correlated poorly with the AHR, allowing us to focus on key differences between variants. The 10 modules with the lowest correlation coefficients included defense response to foreign organisms, innate immune and cytokine response, ion transport, GPCR signaling, and metabolic pathways. The functional distinction between modules that correlated well or poorly with the AHR was corroborated by visualizing them on a t-distributed stochastic neighbor embedding (Fig. 4G), which showed them to be well separated. Because restricting our analysis to regulated genes could bias our results, we used network propagation to embed all our quantitative data per gene within their pathway network neighborhoods, which resulted in similar result (Fig. S5A). An additional, variant-specific, analysis identified modules that were regulated by particular variants. These findings (Fig. S5B) included regulation of genes in sensory perception of taste during Delta infection and agreed with studies linking Delta to frequent loss of taste and smell 28,29.
Host translation inhibitor plitidepsin provides pan-variant therapeutic efficacy in vivo
The translation module had the third highest correlation with the AHR, alongside three other translation-related modules, representing a conserved host response across the viruses (Fig. 4F, S5C). We previously reported that inhibiting eukaryotic translation elongation factor 1A (eEF1A) with plitidepsin exerted potent antiviral activity against SARS-CoV-2 within the nanomolar range 30. Plitidepsin is in phase III clinical trials for treating COVID-19 (NCT04784559). It retained antiviral efficacy against several VOCs in a cell-culture model 31. Here, we determined if plitidepsin has antiviral efficacy against five VOCs in vivo. We intranasally infected K18-hACE2 mice with each VOC or W1 control, and administered 0.3 mg/kg of plitidepsin via intraperitoneal injection once daily for 3 days (Fig. S5D). On day 4, viral titers were quantified from the lungs via TCID50. Viral titers were decreased for all VOCs, all significant (p<0.05) except for Gamma, which showed a trend of reduction that did not reach significance (p=0.08; Fig. S5E). These results support plitidepsin as a therapeutic for SARS-CoV-2 infection and highlight its potential against future variants.
VOCs evolved to alter the immune response landscape
Our integrative computational analysis pinpointed innate immune and inflammatory processes as having the lowest correlation with the AHR (Fig. 4F, 4H), suggesting VOCs evolved distinct relationships with the host antiviral inflammatory response. To probe this, we merged genes from the five inflammation modules and separated them into two groups: interferon-stimulated genes (ISGs) and proinflammatory genes (Table S4). We defined ISGs as directly induced upon interferon production after infection (containing an ISRE promoter) and pro-inflammatory genes as contributors to systemic inflammation that are driven by other transcription factors (e.g., NF-kB and AP-1). Many are associated with severe COVID-19 32–37. We calculated a log2 fold-change of VOCs versus W1 VIC based on the average expression change for genes within each group to compare ISG and pro-inflammatory gene regulation across the VOCs.
All VOCs, except Omicron BA.1, suppressed ISG protein expression with respect to W1 virus (Fig. 4I–J, S5F–I, S6A, S6C), consistent with a model where VOCs convergently evolved to suppress host innate immune responses. Alpha and Beta suppressed ISGs at RNA and protein levels (Fig. 4I–J), which was reflected in reduced IRF3 nuclear translocation in infected cells at 10hpi (Fig. S5J). Gamma and Delta induced similar levels of IRF3 translocation (Fig. S5J) and ISG transcription (Fig. 4I) but suppressed ISG protein expression (Fig. 4I). IRF3 nuclear translocation levels in uninfected bystander cells were low (Fig. S5K). Suppression of ISG responses at the protein versus RNA level suggests evolution of more effective and selective host translational inhibition while leaving viral translation intact. Surprisingly, Omicron BA.1 triggered a greater type-I interferon response and accompanying ISG RNA and protein levels than W1 (Fig. 4I–J S6A, S6C), despite lower levels of replication in Calu-3 than other viruses (Fig. 4K), also seen with independent VOC isolates (Fig. S5I). Interestingly, we found greater rescue of Omicron replication, compared to Alpha and Delta, upon administration of the JAK/STAT signaling inhibitor ruxolitinib, underscoring how the interferon response to Omicron is partially responsible for its poor replication in this model (Fig. 4L).
To further compare VOC immunomodulation, the ISG vs pro-inflammatory gene induction signatures (mRNA) were plotted for each VOC, relative to VIC (Fig. 4M). Alpha and Beta had robust antagonism of ISG and pro-inflammatory gene expression. Gamma regulated inflammatory gene expression similarly to W1 VIC. Delta displayed greater induction of proinflammatory genes than other VOCs, despite similar replication kinetics. Strikingly, Omicron BA.1 clustered with none of the variants due to increased induction of ISGs and pro-inflammatory genes.
To determine if inflammatory pathway regulation by the VOCs was associated with viral protein expression, as reported for Alpha 7, we correlated viral protein and RNA levels with pathway module regulation and ranked viral genes according to their correlation with inflammatory response modules (modules 8, 13, 31, 43, and 53). Expression of N and Orf6, both well-studied innate immune antagonist proteins 26,38,39, were the most anticorrelated with inflammatory response module regulation, consistent with the notion that their increased expression suppresses the host innate immune response (Fig. 4N). Each virus evoked different host inflammatory responses during infection; early VOCs Alpha and Beta tend to induce muted responses, whereas later VOCs Delta and Omicron tend to drive greater inflammatory responses. These data suggest step-wise evolution of an increasingly sophisticated and more nuanced manipulation of host responses to promote VOC replication and transmission.
To better understand the contribution on innate immune suppression of different up-regulated accessory proteins, we first probed Orf9b function by reverse genetics to generate an Orf9b deletion virus in the Alpha background (Fig. S5L). Orf9b KO virus triggered a greater innate immune response during infection in Calu-3 cells than wild-type Alpha infection (Fig. S5M), supporting involvement of Orf9b in innate immune suppression. Using an Alpha Orf6 KO virus in Calu-3, we previously showed that Orf6 is a potent innate immune antagonist 40. The fact that Omicron BA.1 does not upregulate Orf6 expression and only slightly upregulates Orf9b, a weaker innate antagonist, suggests Omicron BA.1 may not have enhanced expression of the full complement of antagonists required for effective innate immune suppression. Mutations in Omicron and Delta Orf9b might affect their functional potency. Intriguingly, the Alpha Orf9b KO virus had a defect in replication in primary HAEs, which was not rescued by inhibiting interferon signaling with ruxolitinib, suggesting Orf9b has additional roles in replication (Fig. S5N).
Omicron subvariants evolved enhanced innate immune antagonism by modulating Orf6
Phylogenetic studies indicate that the five VOCs evolved independently from W1 virus. However, Omicron subvariants (BA.2, BA.4, and BA.5) evolved from a common Omicron ancestral variant in a complex and incompletely understood way involving recombination 5,41. Omicron subvariants co-circulated, becoming globally or locally dominant, and may have adapted to evade innate immune responses 5,40. To probe the molecular mechanisms underlying their differences, we globally quantified mRNA and protein levels in Calu-3 cells infected with equal doses of Omicron subvariants BA.1, BA.2, BA.4, or BA.5 alongside Alpha, Delta, and W1 IC19 (Fig. 5A). Because Omicron subvariant replication was lower than prior VOCs, we compared them to each other and focused on a later (48 hpi) time point to better capture the viral and host response to infection.
Figure 5. Omicron subvariants evolved innate immune antagonism by modulating Orf6.

(A) Experimental workflow. Calu-3 cells were infected with the indicated variants, and W1 control IC19. Cells were harvested at 10, 24, and 48 hpi for bulk mRNA sequencing. Cells were harvested at 24 and 48 hpi for abundance mass spectrometry proteomics analysis.
(B) Counts of viral genomic (leader + Orf1a) RNA over time for each virus.
(C) ISG (RNA and protein) and proinflammatory gene (RNA) expression at 48 hpi relative to BA.1. Proinflammatory genes were sparsely detected at the protein level and excluded. Error bars represent SE.
(D) Heatmap of ISG protein expression for Omicron subvariants at 24hpi. Color indicates the log2 fold-change in expression, relative to Omicron BA.1.
(E) Same as D, but at 48hpi.
(F) Relationship between ISG and proinflammatory gene expression for each virus at 48 hpi in Calu-3 cells, relative to BA.1 for RNA as in (C).
(G) Expression of viral RNA for Omicron subvariants, normalized to viral genomic (leader + orf1a) counts for each virus and set relative to BA.1. Error bars represent SE.
(H) Expression of viral protein for Omicron subvariants, normalized to the sum non-structural protein (Nsps) intensities for each virus and set relative to BA.1. Error bars represent SE.
(I) ISG RNA (left) and protein (right) expression versus VIC for Alpha, Omicron BA.1, an Orf6 knock-out version of Alpha created using reverse genetics, and poly I:C.
(J) AP-MS of Orf6 D61L (occurring in BA.2 and BA.4 but not BA.1 or BA.5) compared to wave 1 (W1) Orf6 in HEK293T cells. All detected proteins are plotted with high-confidence interactions that are also significantly differentially interacting (abs(log2FC)>0.5 & p<0.05) highlighted in blue.
(K) X-ray crystallography structure (PDB 7VPG) of RAE1, NUP98, and Orf6. Orf6 D61 residue is pink and forms a hydrogen bond (gray sticks) with RAE1. Other Orf6 residues (E59, E56, D53, and E55) that participate in interactions with RAE1 are shown. M58 inserts into a RAE1 hydrophobic pocket.
(L) Model of the effects of Orf6 levels and Orf6 D61L mutant status on the innate immune response. The nuclear pore (RAE1 and NUP98) physically interacts with Orf6, which suppresses the nuclear translocation of ISG-inducing transcription factors and export of ISG mRNAs during infection. This interaction is weakened, but not abolished, when the D61L mutation is present, resulting in diminished innate immune antagonism by Orf6. BA.1 and BA.2 downregulate Orf6 relative to early-lineage SARS-CoV-2 (IC19), which results in an increased innate immune response during infection, exacerbated by the presence of the D61L mutation in BA.2. Conversely, BA.4 and BA.5 upregulate Orf6 protein to similar levels. However, BA.5 more strongly antagonizes the innate immune response, which we speculate is due to the absence of the D61L mutation.
Assessment of viral replication by viral genome counts in RNAseq data demonstrated that BA.1 and BA.5 replicated comparably and more efficiently than BA.2 and BA.4, which replicated similarly to each other (Fig. 5B). Compared to BA.1, BA.2 stimulated a stronger innate immune response despite reduced replication, whereas host responses during BA.4 infection were reduced, particularly for pro-inflammatory gene induction (Fig. 5B–F). Replication rates did not correlate with host innate immune responses to infection as BA.5 had high rates of replication but the lowest ISG response at RNA and protein levels (Fig. 5C–F, S6B, S6D). Comparing host responses to Omicron subvariants with those to Alpha and Delta indicates that BA.5 is closest to Alpha (Fig. S7A–B), the best overall innate immune suppressor, consistent with convergent evolution between BA.5 and Alpha and the possibility that BA.5 could evolve further Alpha-like host adaptations to more effectively antagonize innate immune activation.
From these and previous observations 40, we hypothesized that Omicron subvariants evolved enhanced innate immune suppression by modulating expression of the same viral proteins that inhibit interferon responses as Alpha to Delta. Interrogation of global viral RNA and protein expression during infection revealed differences in the production of structural and accessory proteins, but not non-structural proteins, across the Omicron subvariants (Fig. 5G–H, S7C–E), as we found above (Fig. 2B–C). Interestingly, Orf6 and N protein expression was increased in BA.4 and BA.5, both known innate immune antagonists. Although Orf6 viral sgRNA was increased in BA.4, it was not for BA.5, suggesting a selective control mechanism underlies Orf6 protein production for BA.5. Similarly, we observed increased viral sgRNA but decreased Orf6 protein production for BA.1, above (Fig. 2B–C). Computational analysis found N and Orf6 were the most anticorrelated with the innate immune response (Fig. 4N), underscoring their role in innate immune regulation and the convergence between Alpha to Delta and Omicron BA.1–5 evolution. To validate the impact of Orf6 on the innate immune response, we used an Orf6 deletion virus in the Alpha background. The Orf6-deleted virus strongly induced ISG expression, compared to WT Alpha, reaching similar levels as Omicron BA.1 (Fig. 5I, S7F). This was consistent with the fact that BA.1 showed lower Orf6 protein expression than other VOCs (Fig. 2C). These results agree with Orf6 being a regulator of the innate immune response during infection, likely contributing to the evolved immunomodulatory profile of Omicron subvariants.
With similar Orf6 protein levels, we were surprised that BA.4 and BA.5 induced different degrees of innate immune responses, with BA.5 suppressing ISG expression more strongly than BA.4 (Fig. 5C). However, BA.4 and BA.2 contain a protein-coding mutation in Orf6 (D61L), which strongly reduced the interaction between Orf6 and nuclear pore components mRNA transport factor RAE1 and nucleoporin NUP98 (Fig. 5J, 2N, 3). Orf6 binds these proteins to prevent the nuclear translocation of ISG-associated transcription factors (e.g. STAT1), as well as modulate the nuclear export of ISG mRNAs for cytoplasmic translation 26,42. Thus, a decreased interaction between Orf6 and RAE1/NUP98 may contribute to the reduced replication and suppression of ISGs during BA.4 and BA.2 infection. Interrogation of the RAE/NUP98/Orf6 crystal structure (PDB 7VPG) 43 using the SSIPe program 44, allowed us to predict a model of the mutated complex and compute the difference of free energy change between mutant and W1 forms (ΔΔG = ΔGbind,D61L - ΔGbind,wt). This analysis confirmed the D61L substitution unfavorably affects the RAE/Orf6 binding stability (ΔΔG = 1.2 kcal mol−1). D61 forms a hydrogen bond with RAE1 R239 (Fig. 5K). Other Orf6 residues, including E59, E56, D53, and E55, formed similar interactions with RAE1. M58 is inserted into a hydrophobic pocket within RAE1, providing a tight binding interface (see accompanying paper for functional characterization). Given the number of other residues regulating the Orf6/RAE1 interaction, we predict the D61L mutation to reduce, but not completely abolish, the interaction, in accordance with our AP-MS results.
In summary, we hypothesize that poor Orf6 expression and gain of the D61L mutation by BA.2 contribute to reduced replication and poor interferon antagonism compared to BA.1. Although BA.4 has upregulated Orf6 expression, the D61L mutation reduced its innate immune antagonism, again resulting enhanced ISG expression and possibly contributing to reduced replication. In contrast, BA.5 upregulated expression of fully functional Orf6, consistent with high levels of replication and the strongest suppression of innate immune activation among the Omicron subvariants studied (Fig. 5L).
DISCUSSION
In this study, we sought to understand the biology and selective forces underlying the evolution of SARS-CoV-2 VOCs. Although most previous work has focused on Spike, mutations outside Spike influence the host response. We applied an unbiased global systems approach to understand VOC infection biology and the impact of viral adaptation on replication and host cellular responses.
The VOCs converged on enhancing innate immune antagonism by increasing expression of key viral innate immune antagonist proteins. The VOCs each independently evolved from an early lineage W1 virus, but enhanced the same set of viral proteins (e.g., N, Orf6, Orf9b; Fig. 2, S2). This strongly suggests convergent evolution of related strategies to subvert host innate immune defenses to improve replication and ultimately transmission. Here, we defined key VOC mutations for regulating expression of Orf9b and N*, although the changes that regulate Orf6 expression remain elusive. All VOCs, except Gamma, have altered N protein phosphorylation, which may affect viral assembly and/or replication (Fig. 2). Furthermore, we linked adaptation of host-virus PPIs to specific viral mutations (Fig. 3, S4), discovering all VOCs possessed protein-coding mutations that significantly altered virus-host protein complexes. Notably, we showed the novel VOC-specific protein N* interacted with the host RNAPII-associated factor complex (PAFc), suggesting VOCs evolved to influence host gene expression through N*. Overall, our results highlight the plasticity of viral protein evolution and host-virus interactions, showing that viral point mutations, including non-coding changes, affect function.
One of the most striking features of SARS-CoV-2 VOCs is their sequential replacement of the single dominant VOC (e.g., Alpha replacing W1, Delta replacing Alpha, Omicron replacing Delta) rather than continuous global co-circulation. A wealth of data implicates Spike adaptation to escape adaptive antibody responses, but VOC evolution likely is more complex. The most divergently regulated cellular pathways were those connected to innate immune and cytokine responses (Fig. 4). This suggests that improving the capacity to regulate host innate immune responses contributed to VOC dominance likely through improving transmission. This likely reflects a strong selection imposed by the human innate immune system on the virus, whose ancestor likely adapted to evade innate immunity in a non-human species. However, we do not know why some VOC lineages did not become dominant, but we can link viral genetics to host innate immune activation and its suppression. Nonetheless, we propose that a major force in shaping virus-host adaptations is related to evasion of innate and adaptive responses (Fig. 6) 45, in agreement with recent reports that evasion of innate immune responses defines pandemic HIV-1 46.
Figure 6. VOCs balance adaptive and innate immune escape during the course of their evolution.

(A) Data on Spike sequence similarity relative to W1 virus (green) and ISG expression (this paper, red) are shown for each variant. Impact of viral protein expression and point mutations are indicated (red and green text). Importantly, the line does not imply sequential evolution.
(B) Model for SARS-CoV-2 VOC convergent strategies to modulate the immune responses. Spike mutations increase evasion from the adaptive immune system (top). In this work, we discovered VOC mutations that enhance viral protein expression and rewire virus-host protein interactions that modulate the innate immune response. A coordinated balance between adaptive and innate immune evasion is required by successful variants. Combination therapeutic strategies that enhance adaptive and innate immunity may improve disease outcomes for patients.
A significant event in SARS-CoV-2 evolution is the emergence of Omicron. Omicron represents the biggest change in Spike, leading to the evasion of the host adaptive immune responses (Fig. 6A). Omicron Spike mutations effectively changed the virus to a new serotype, altering the biology of viral entry by reducing dependence on TMPRSS2 and surface fusion for cathepsin and endosomal fusion, as well as altering in vivo tropism for the upper airway 4,47,48. Our data show that Omicron is less effective in suppressing innate immune responses than Alpha or Delta. One hypothesis for this phenomenon may be related to its arising in a chronically ill and immunocompromised patient 49,50. Subsequent Omicron lineages, particularly BA.5, enhanced this capacity by expressing higher levels of Orf6 and effectively suppressing interferon responses. We propose that Omicron, after successfully escaping widespread adaptive immune responses to Spike, subsequently experienced the next strongest selective pressure, leading to enhanced innate immune evasion via upregulation of viral protein antagonists, as we have seen in previous VOCs 7. A simple model of enhanced innate immune evasion by increased expression of Orf6 is confounded by the Orf6 D61L mutation in the Omicron sublineages BA.2 and BA.4. However, this mutation weakens the interaction with RAE1 and NUP98, suggesting reduced inhibition of nuclear transport for mediators of the inflammatory response (see accompanying paper for functional characterization). Strikingly, D61L is encoded by the same three nucleotide substitutions in BA.2 and BA.4, suggesting this mutation occurred only once, perhaps in BA.2 and then arose in BA.4 by recombination.
VOCs provoked different pro-inflammatory cytokine responses (Fig. 4). Cytokines (e.g., IL-6, CCL5, IL-8, TNF, IL-1ꞵ) are with increased COVID-19 severity and poor prognosis 32–37. Whether such differences account for VOC-specific pathogenicity (e.g., more severe disease with Delta 51–54 or late Omicron sublineages 55–59) is confounded by pre-existing immunity. Thus, while VOCs may drive less severe disease than Delta, which appears to be particularly inflammatory, dissecting the differences in the mechanisms driving pathogenicity and disease severity remains a necessary challenge. Although no model is perfect, a combination of cell lines, primary human cell models, and in vivo rodent models may produce the richest understanding of functional VOC evolution and its links to disease severity 60–62.
Our analysis pinpointed cellular pathways that are similarly modulated across the VOCs during infection and represent putative targets for pan-coronavirus antivirals. Our previous work showed plitidepsin has strong antiviral activity against early SARS-CoV-2 strains in vivo and the VOCs in vitro 19,30,31. Here, we showed plitidepsin is also effective against VOCs in vivo. Thus, targeting a host factor essential for viral replication (i.e., eEF1A) provides a suitable strategy for new antivirals. We propose combination therapy approaches to tackle emerging or future variants: one targeting the adaptive immune response (e.g., vaccines, antibody treatments) and another inhibiting viral innate immune antagonist proteins (e.g., Orf6 and Orf9b) or activating the innate inflammatory responses (Fig. 6B).
Overall, our integrative systems multiomics platform enables the rapid evaluation of emerging viral mutations and their mechanistic consequences on viral replication and pathogenicity. Our analyses pinpoint conserved pathways that are central to the SARS-CoV-2 life cycle, paving the way to uncover broad antivirals for existing and future viral strains. Additionally, we uncover how viral evolution has led to divergent host responses, with implications for disease pathology, severity, and transmission in humans.
Limitations of the Study
Our study possesses several important limitations. First, although we collected omics data at two time points post infection, a higher resolution time course would reveal how different variants impact dynamical patterns in a more comprehensive manner. For instance, the dynamical nature of viral protein expression or phosphorylation may vary across the VOCs and could underlie phenotypic outcomes. Second, since our cellular response analyses are primarily conducted in cell models, future studies should perform these types of omics studies in infected animal models. Third, our findings should be further explored in human clinical samples to assess whether similar trends (e.g., viral protein expression, phosphorylation, innate immune antagonism) are observed.
STAR METHODS
RESOURCE AVAILABILITY
Lead Contact
Further information and requests for resources and reagents should be directed to and will be fulfilled by the Lead Contact, Nevan J. Krogan (Nevan. Krogan@ucsf.edu).
Materials Availability
Materials including cell lines, viral strains, and plasmids will be made available upon request from the Lead Contact pending a material transfer agreement (MTA) and proper safety approvals, when applicable.
Data and Code Availability
Further information and requests for resources and reagents should be directed to and will be fulfilled by NJK (nevan.krogan@ucsf.edu). The raw mass spectrometry proteomics infection proteomics and affinity purification mass spectrometry (APMS) data files have been deposited to the ProteomeXchange Consortium (http://proteomecentral.proteomexchange.org) via the PRIDE partner repository 65 with the dataset identifiers PXD036968 and PXD036798, respectively. All raw mRNA sequencing data files have been deposited in NCBI’s Gene Expression Omnibus 66 and are accessible through GEO Series accession number GSE213759. RNA, peptide, and protein counts, as well as quantitative statistical data, can be accessed via Mendeley Data (doi: 10.17632/prs6zjts7b.1). All other data are available in the main text or the supplementary materials.
EXPERIMENTAL MODEL AND SUBJECT DETAILS
Calu-3 and Caco-2 cells
Calu-3 cells were purchased from ATCC (HTB-55) or AddexBio (C0016001) and Caco-2 cells were a gift from D. Bailey. Cells were cultured in Dulbecco’s modified Eagle’s medium (DMEM) supplemented with 10% heat-inactivated FBS (Labtech) and 100 U ml−1 penicillin–streptomycin, with the addition of 1% sodium pyruvate (Gibco) and 1% Glutamax. All cells were passaged at 80% confluence and were frequently monitored for mycoplasma contamination. For infections, adherent cells were trypsinized, washed once in fresh medium and passed through a 70-μm cell strainer before seeding at 0.2 × 10⁶ cells per ml into tissue-culture plates. Calu-3 cells were grown to 60–80% confluence before infection as described previously 7. For stimulation with poly:IC (Peprotech), 250ng of poly:IC were transfected using lipofectamine 2000 (ThermoFisher).
Human Airway Epithelial (HAE) cells
Primary normal (healthy) bronchial epithelial (NHBE-A) cells were acquired from Epithelix (Cat# EP51AB), cultured for five to seven passages, and differentiated at an air-liquid interface as previously described 7,40. After 21–24 days of differentiation, cells were used in infection experiments.
Vero and A549-ACE2 cells
Vero E6 (ATCC, CRL-1586) and Vero TMPRSS2 cells (BPS Bioscience Cat# 78081) were maintained in Dulbecco’s modified Eagle’s medium (Corning) supplemented with 10% fetal bovine serum (Peak Serum), non-essential amino acids (Gibco), HEPES (Gibco) and penicillin/streptomycin (Corning) at 37 °C and 5% CO2. A549-ACE2 67 were maintained in Dulbecco’s modified Eagle’s medium (Corning) supplemented with 10% fetal bovine serum (Peak Serum) and penicillin/streptomycin (Corning) at 37 °C and 5% CO2. All cell lines used in this study were regularly screened for Mycoplasma contamination, using the Universal Mycoplasma Detection Kit (ATCC, 30–1012K).
HEK-293T cells
HEK-293T cells were cultured in Dulbecco’s modified Eagle’s medium (DMEM; Corning) supplemented with 10% fetal bovine serum (FBS; Gibco, Life Technologies) and 1% penicillin–streptomycin (Corning) and maintained at 37 °C in a humidified atmosphere of 5% CO2. HEK293T cells were procured from the UCSF Cell Culture Facility, now available through UCSF’s Cell and Genome Engineering Core ((https://cgec.ucsf.edu/cell-culture-and-banking-services); cell line collection listed here: https://ucsf.app.box.com/s/6xkydeqhr8a2xes0mbo2333i3k1lndqv (CCLZR076)). STR analysis by the Berkeley Cell Culture Facility on 8 August 2017 authenticated HEK-293T cells with 94% probability. Cells were tested on 4 October 2021 using the MycoAlert PLUS Mycoplasma Detection Kit (Lonza LT07–710) and were negative: B/A ratio < 1 (no detected mycoplasma).
Viruses
SARS-CoV-2 lineages Alpha (B.1.1.7) 7,68, Beta (B.1.351), Gamma (P.1), Delta (B.1.617.2) 4 and Omicron (lineage 375 B.1.1.529.1/BA.1 and lineage B.1.1.529.2/BA.2) isolates were a gift from Wendy Barclay (Imperial 376 College London, UK). Beta (B.1.351), Omicron BA.4 (lineage B.1.1.529.4) and BA.5 (lineage B.1.1.529.5) were a gift from Alex Sigal and Khadija Khan (Africa Health Research Institute, Durban, South Africa) 5. Early-lineage isolate VIC was provided by NISBC and IC19 a gift from Wendy Barclay 7. Viruses were propagated by infecting Caco-2 cells in DMEM culture medium supplemented with 10% FBS and 100U/ml penicillin/streptomycin at 37 °C as previously described 7,68. Virus stocks used in experiments comparing Omicron subvariants, virus stocks were prepared in DMEM culture medium supplemented with 1% FBS and 100U/ml penicillin/streptomycin, which was maintained in Calu-3 infections. Virus was collected at 72 hpi and clarified by centrifugation at 2,100xg for 15 min at 4°C to remove any cellular debris. Virus stocks were aliquoted and stored at −80 °C. Virus stocks were quantified by extracting RNA from 100 μl of supernatant with 1 μg/ml carrier RNA using Qiagen RNeasy clean-up protocol, before measuring viral E RNA copies per ml by RT-qPCR 7,68. Cells were infected with SARS-CoV-2 viruses under BSL3 containment in accordance with the biosafety protocols developed by each institution, including University College London and the Icahn School of Medicine at Mount Sinai.
METHOD DETAILS
Description of each experiment
Global proteomics and transcriptomics studies were collected across seven (7) separate experiments. Experiment 1 contains Alpha, Beta, Gamma, Delta, IC19, VIC, and mock infections in Calu-3 cells harvested at 10 and 24 hpi and was processed for mRNA sequencing, abundance proteomics, and phosphoproteomics. Experiment 2 contains Alpha, Delta, Omicron BA.1, IC19, VIC, and mock infections in Calu-3 cells harvested at 10 and 24 hpi and was processed for mRNA sequencing, abundance proteomics, and phosphoproteomics. Experiment 3 contains Alpha Orf6 KO, Alpha wild-type, IC19, VIC, mock infections and polyIC treatment in Calu-3 cells harvested at 10 and 24 hpi and was processed for mRNA sequencing, abundance proteomics, and phosphoproteomics. Experiment 4 contains Omicron BA.1, BA.2, BA.4, BA.5, Alpha, Delta, IC19, VIC, and mock infection in Calu-3 cells harvested at 24 hpi and Omicron BA.1, BA.2, BA.4, and BA.5 in Calu-3 cells harvested at 48hpi and processed for abundance proteomics only. Experiment 5 contains Omicron BA.1, BA.2, BA.4, BA.5, Alpha, Delta, IC19, VIC, and mock infection in Calu-3 cells harvested at 24 and 48 hpi and processed for mRNA sequencing only. Experiment 6 contains viral RNA and protein counts from global mRNA sequencing and abundance proteomics, respectively, for Washington wild-type and N D3L + −3 deletion mutant virus in Washington background infection in A549-ACE2 cells at 24 and 48hpi. Experiment 7 contains viral RNA counts from global mRNA sequencing for R203K/G204R mutant virus in Wuhan virus background infection in Calu-3 cells at 24hpi. The purpose of experiment 7 was to assess the expression of N*.
Generating mutant viruses by reverse genetics
Alpha Orf6 deletion virus (Alpha ΔOrf6) was achieved by mutation of the first two methionines: M1L (A27216T) and M19L (A27200T). Alpha Orf9b deletion virus (Alpha ΔOrf9b) was achieved by introducing the following synonymous mutations into N: I15I (T28318A) and N29N (T28360C), resulting in Orf9b L12Stop and M26T. Wuhan-Hu-1-D614G with R203K/G204R was achieved by introducing mutations R203K (G28881A, G28882A) and G204R (G28883C). Reverse genetics (RG) derived viruses were generated essentially as previously described 69,70. Rescued RG SARS-CoV-2 viruses were sequenced using Oxford Nanopore as previously described 71.
To generate N and Orf9b D3L, −3A, and D3L/−3A mutants we used the bacterial artificial chromosome (BAC) system harboring the entire viral genome of SARS-CoV-2 USA-WA1/2020 strain (Accession No. MN985325), as previously described 72. The mutations of D3L/−3A, D3L, and −3A were achieved in viral fragment 1 by site-directed mutagenesis. After confirming the mutations by Sanger sequencing, fragments containing the mutations were released and reassembled into the BAC using BamHI and RsrII restriction endonucleases. Then, the BAC containing the mutations were maxi prepared and transfected into Vero AT (ACE2/TMPRSS2) cells using Lipofectamine 2000 (ThermoFisher Scientific) according to the manufacturer’s instruction. At 12 hours post-transfection, the supernatant was replaced by post-infection media (DMEM+1% FBS+1% PSG), and the supernatant was collected at 72 hours post-transfection, aliquoted, labeled as P0, and stored at −80 °C. The P1 stocks were generated by infecting monolayer of Vero AT cells with the P0 stocks (MOI 0.001). At 48 hours post-infection, the cell culture supernatant was collected, clarified, aliquoted, labeled as P1, and stored at −80 °C. After confirmation by deep sequencing, the P1 stocks were titrated and used for experiments.
Primers used for generation of mutant rSARS-CoV-2
| Primer names | Primer sequences (5’3’) |
|---|---|
|
| |
| D3L/-3A-F | catctaaacgaacaaactaaatgtctCTAaatggaccccaaaatcagcgaaatg |
| D3L/-3A-R | ttcgctgattttggggtccattTAGagacatttagtttgttcgtttagat |
| D3L-F | aacgaacaaactaaaatgtctCTAaatggaccccaaaatcagcgaaatg |
| D3L-R | ttcgctgattttggggtccattTAGagacattttagtttgttcgtttag |
| −3A-F | catctaaacgaacaaactaaatgtctgataatggaccccaaaatcag |
| −3A-R | ggggtccattatcagacatttagtttgttcgtttagatgaaatctaaaac |
All work with SARS-CoV-2 viruses, including the generation of the recombinant wild-types or mutants used in this publication, was conducted in BSL3 laboratories following rigorous safety protocols, including strict adherence to personal protective equipment and decontamination procedures. Furthermore, we do not consider our work to constitute gain-of-function research. The recombinant SARS-CoV-2 viruses were generated using reverse genetics approaches based on the Wuhan-1 original strain. Aside from the mutations introduced, the sequence of the recombinant SARS-CoV-2 viruses were identical to that of the Wuhan-1 strain. Therefore, compared to currently circulating viruses, they have not undergone extensive evolution and would be highly unlikely to compete with the currently circulating SARS-CoV-2 Omicron variants. Second, the mutations introduced in the recombinant SARS-CoV-2 used in this study have been found in natural/clinical SARS-CoV-2 isolates and thus represent mutations found in nature.
Infection of Calu-3 cells
For Calu-3 infections, inoculi were calculated using E copies per cell as indicated. Cells were inoculated with diluted virus stocks for 2 h at 37 °C, subsequently washed once with PBS and fresh culture medium was added. At the indicated time points, cells were collected for analysis as previously described 7.
Infection of HAE cells
For primary HAE infections, cells were washed once with PBS on the apical side before addition of diluted virus stocks for 2–3 h at 37°C. Supernatant was then removed and cells were washed twice with PBS. All liquid was removed from the apical side and basal medium was replaced with fresh PneumaCult ALI medium for the duration of the experiment. Virus release was measured at the indicated time points by extracting viral RNA from apical PBS washes. To this end, cells were incubated with PBS for 30 minutes at 37°C at the indicated time points. Cellular RNA was collected by lysing cells at the experimental endpoint in RLT (Qiagen) supplemented with 0.1% beta-mercaptoethanol (Sigma) and extracted as previously described 7.
Infection of A549-ACE2 with mutant rSARS-CoV-2 N D3L and −3 deletion viruses
Unless otherwise specified, infections were performed in viral growth media (VGM): Dulbecco’s modified Eagle’s medium (Corning) supplemented with 2% fetal bovine serum (Peak Serum), non-essential amino acids (Gibco), HEPES (Gibco) and penicillin/streptomycin (Corning) at 37°C and 5% CO2 as previously described 73. For proteomic samples, one day before infection, 8×10⁵ A549-ACE2 cells per biological replicate were seeded in 6-well plates in complete media. Cells were then infected with the indicated viruses under BSL3 containment in accordance with the biosafety protocols developed by the Icahn School of Medicine at Mount Sinai. At the appropriate time post infection, cells were washed three times in ice cold 1x PBS and lysed in 500uL/well of 6M guanidine hydrochloride (Sigma) in 100mM Tris-HCl (pH 8.0). Samples were then boiled for 5 minutes at 95C to inactivate proteases, phosphatases, and virus. Samples were frozen at −80°C until further processing. For RNAseq analysis, one day before infection, 4×10⁵ A549-ACE2 cells per biological replicate were seeded in 6-well plates in complete media. Cells were then infected with the indicated viruses under BSL3 containment in accordance with the biosafety protocols developed by the Icahn School of Medicine at Mount Sinai. At the appropriate time post infection, cells were washed three times in ice cold 1x PBS and lysed by adding 1mL/well of Trizol reagent (Thermo Fisher).
RT-qPCR of infected Calu-3 cells
cDNA was synthesized from RNA using SuperScript IV (Thermo) with random hexamer primers (Thermo). RT-qPCR was performed using Fast SYBR Green Master Mix (Thermo) for host gene expression and subgenomic RNA expression or TaqMan Master mix (Thermo Fisher Scientific) for viral RNA quantification. Reactions were performed on the QuantStudio 5 Real-Time PCR systems (Thermo Fisher Scientific). Viral E RNA copies were determined as described previously 68. Host gene expression was determined using the 2−ΔΔCt method and normalized to GAPDH expression. The following probes and primers were used:
GAPDH fw: 5’-ACATCGCTCAGACACCATG-3’, rv: 5’-TGTAGTTGAGGTCAATGAAGGG-3’; IFNB fw: 5’-GCTTGGATTCCTACAAAGAAGCA-3’, rv: 5’-ATAGATGGTCAATGCGGCGTC-3’; CXCL10 fw: 5’-TGGCATTCAAGGAGTACCTC-3’, rv: 5’-TTGTAGCAATGATCTCAACACG-3’; IFIT1 fw: 5’-CCTCCTTGGGTTCGTCTACA-3’, rv: 5’-GGCTGATATCTGGGTGCCTA-3’, IFIT2 fw: 5′-CAGCTGAGAATTGCACTGCAA-3′, rv: 5′-CGTAGGCTGCTCTCCAAGGA-3′.
ELISA of infected Calu-3 cells
Cytokine release by infected Calu-3 cells was measured in culture supernatants at 48 hpi. IFNβ and CXCL10 were measured using Human IFN-beta Quantikine ELISA Kit or Human CXCL10/IP-10 DuoSet ELISA reagents (biotechne R&D systems) according to the manufacturer’s instructions.
Western blotting of infected Calu-3 cells
For western blotting, whole-cell lysates were separated by SDS-PAGE, transferred onto nitrocellulose and blocked in PBS with 0.05% Tween 20 (v/v) and 5% skimmed milk (w/v). For detection of Spike, N, Orf6, Orf9b, spike, MX1, IFIT1 and β-actin expression membranes were probed with rabbit-anti-IFIT1 (CST, #14769, clone D2X9Z), rabbit-anti-MX1 (CST, #37849, clone D3W7I) rabbit-anti-SARS spike (Invitrogen, PA1–411-1165), rabbit-anti-Orf6 (Abnova, PAB31757), rabbit-anti-Orf9b (ProSci, 9191), Cr3009 SARS-CoV cross-reactive human-anti-N antibody (a gift from Laura McCoy, UCL) and rabbit-anti-beta-actin (SIGMA), followed by IRDye 800CW or 680RD secondary antibodies (Abcam, goat anti-rabbit, goat anti-mouse or goat antihuman). Blots were imaged using an Odyssey Infrared Imager (LI-COR Biosciences) and analyzed with Image Studio Lite software.
Flow cytometry of infected Calu-3 cells
Adherent cells were recovered by trypsinization and washed in PBS with 2 mM EDTA (PBS/EDTA). Cells were stained with fixable Zombie UV Live/Dead dye (BioLegend) for 6 min at room temperature. Excess stain was quenched with FBS-complemented DMEM. Unbound antibody was washed off thoroughly and cells were fixed in 4% PFA before intracellular staining. For intracellular detection of SARS-CoV-2 nucleoprotein, cells were permeabilized for 15 min with intracellular staining perm wash buffer (BioLegend). Cells were then incubated with 1 μg ml−1 CR3009 SARS-CoV-2 cross-reactive antibody (a gift from L. McCoy) in permeabilization buffer for 30 min at room temperature, washed once and incubated with secondary Alexa Fluor 488-donkey-anti-human IgG (Jackson Labs). All samples were acquired on a BD Fortessa X20 using BD FACSDiva software. Data were analyzed using FlowJo v.10 (Tree Star).
Immunofluorescence of infected Calu-3 cells
Infected cells were fixed using 4% PFA/formaldehyde for 1 hour (h) at room temperature and subsequently washed with PBS. A blocking step was carried out for 35h at room temperature with 10% goat serum/1%BSA/0.001 Triton-TX100 in PBS. IRF3 and dsRNA staining to was performed by primary incubation with rabbit-anti-IRF3 antibody (sc-33641, Santa Cruz), mouse-anti-dsRNA (MABE1134, Millipore) antibody for 18h and washed thoroughly in PBS. Primary antibody detection occurred using secondary anti-rabbit-AlexaFluor-488 and anti-mouse-AlexaFluor-594 conjugates (Jackson ImmunoResearch) for 1h. All cells were labeled with Hoechst33342 (H3570, Thermo Fisher). Images were acquired using the WiScan® Hermes 7-Colour High-Content Imaging System (IDEA Bio-Medical, Rehovot, Israel) at magnification 10X/0.4NA. Four channel automated acquisition was carried out sequentially. Images were acquired across a well area density resulting in 31 FOV/well and ~20,000 cells. Images were pre-processed by applying a batch rolling ball background correction in FIJI ImageJ software package 74 prior to quantification. IRF3 translocation analysis was carried out using the Athena Image analysis software (IDEA BioMedical, Rehovot, Israel) and data post-processed in Python. Infected cell populations were determined by thresholding of populations with greater than 2 segmented dsRNA punctae.
mRNA extraction and sequencing of infected cells
RNA was extracted using the RNeasy Micro Kits (Qiagen) following manufacturers instructions or TRIzol (Invitrogen). Library preparation and sequencing were performed by Azenta Life Science using the following conditions: rRNA depletion for mRNA and long noncoding species, standard RNAseq run in Illumina® HiSeq 4000™ with a depth of 20–30 million reads per sample.
Mass spectrometry proteomics sample preparation of infected cells
Samples were lysed in 6M guanidine hydrochloride (Sigma), boiled at 95°C for 5 minutes, and stored on dry ice. Lysed samples were thawed and sonicated using a probe sonicator 1x for 15 seconds at 20% amplitude. Insoluble material was pelleted by spinning samples at max speed (~13,000 rpm) for 10 minutes. Supernatant was transferred to a new protein lo-bind tube and protein was quantified using a Bradford assay. Approximately 500ug of protein sample was used for further processing, starting with reduction and alkylation using a 1:10 sample volume of tris-(2-carboxyethyl) (TCEP) (10mM final) and 2-chloroacetamide (4.4mM final) for 5 minutes at 45°C with shaking. Prior to protein digestion, the 6M guanidine hydrochloride was diluted 1:6 with 100mM Tris-HCl pH8 to increase the activity of trypsin and LysC proteolytic enzymes, which were subsequently added at a 1:100 (wt/wt) enzyme-substrate ratio and placed in a 37°C water bath overnight (~16–20 hours). Following digestion, 10% trifluoroacetic acid (TFA) was added to each sample to a final pH of ~2. Samples were desalted using a vacuum manifold with 50mg Sep Pak C18 cartridges (Waters). Each cartridge was activated with 1 mL 80% acetonitrile (ACN)/0.1% TFA, then equilibrated with 3 × 1 mL of 0.1% TFA. Following sample loading, cartridges were washed with 3 × 1 mL of 0.1% TFA, and samples were eluted with 1 × 0.8 mL 50% ACN/0.25% formic acid (FA). Ten percent (10%) of the resulting volume (~50μg) was reserved for protein abundance measurements, and the remainder was used for phosphopeptide enrichment (thus, the same starting material was used for the abundance proteomics and phosphoproteomics analysis). All samples were dried by vacuum centrifugation. For phosphopeptide enrichment of samples for phosphoproteomics, IMAC beads (Ni-NTA from Qiagen) were prepared by washing 3x with HPLC water, incubating for 30 minutes with 50mM EDTA pH 8.0 to strip the Ni, washing 3x with HPLC water, incubating with 50mM FeCl3 dissolved in 10% TFA for 30 minutes at room temperature with shaking, washing 3x with and resuspending in 0.1% TFA in 80% acetonitrile. Peptides were enriched for phosphorylated peptides using a King Fisher Flex (KFF). For a detailed KFF protocol, please contact the authors.
Mass spectrometry proteomics data acquisition of infected cells
Digested samples were analyzed on an Orbitrap Exploris 480 mass spectrometry system (Thermo Fisher Scientific) equipped with an Easy nLC 1200 ultra-high pressure liquid chromatography system (Thermo Fisher Scientific) interfaced via a Nanospray Flex nanoelectrospray source. For all analyses, samples were injected on a C18 reverse phase column (25 cm × 75 μm packed with ReprosilPur 1.9-μm particles). Analytical columns were equilibrated with 6 μl of mobile phase A with a max pressure of 650 bar. For abundance proteomics (phosphoproteomics same unless indicated in parentheses) mobile phase A consisted of 0.1% FA, and mobile phase B consisted of 0.1% FA / 80% ACN. Peptides were separated by an organic gradient from 4% (2%) to 30% (25%) mobile phase B over 62 min followed by an increase to 45% (40%) B over 10 min, then held at 95% B for 8 min at a flow rate of 300 nl min−1. Data-independent analysis (DIA) was performed on abundance and phosphoproteomics samples using an 80 minute gradient. An MS scan at 60,000 resolving power over a scan range of 350–1100 m/z, a normalized AGC target of 300%, and an RF lens setting of 40%. This was followed by DIA scans at 15000 resolving power, using 20 m/z isolation windows over 350–1100 m/z at a normalized HCD collision energy of 30%. Loop control was set to All. To build a spectral library, one sample from each set of biological replicates was acquired in a data-dependent manner. Data-dependent analysis (DDA) was performed by acquiring a full scan over a m/z range of 350–1100 in the Orbitrap at 60,000 resolving power with a normalized AGC target of 300% and an RF lens setting of 40%. Dynamic exclusion was set to 45s, with a 10-ppm exclusion width setting. Peptides with charge states 2–6 were selected for MS/MS interrogation using higher-energy collisional dissociation (HCD), with 20 MS/MS scans per cycle. For phosphopeptide-enriched samples, MS/MS scans were analyzed in the Orbitrap using isolation width of 1.6 m/z, normalized HCD collision energy of 30%, and normalized AGC of 200% at a resolving power of 15,000 with a 22ms (40ms for phosphoproteomics) maximum ion injection time.
Kinase activity screen
We conducted an ADP-GLO based assay to identify human kinases able to phosphorylate full-length SARS-CoV-2 nucleocapsid (N) protein. Assay is done in 96-well plates with a total reaction volume of 25uL. There are 3 types of sample setups according to the assay components: (1) Kinase only (Kinase + buffer + ATP = 5+15+5 = 25uL), (2) N-protein substrate only (substrate protein + buffer + ATP = 5+15+5 = 25uL), and (3) N-protein and Kinase (Kinase + substrate protein + buffer + ATP = 5+5+10+5=25uL). Each condition was performed in biological duplicate. Briefly, after each component of the assay is added, we shake for 1 minute, incubate the plate at 24C for 40 minutes. We then add 25ul of ADP-GLO reagent to each well, shake for 1 minute, incubate the plate at 24C for an additional 40 minutes. We then add 50ul of KDR (kinase detection reagent) to each well, shake for 1 minute, incubate the plate at 24C for 30 minutes, and used GLOMAX to quantify each well. Novel hits were defined as kinases with greater activity against N than our positive control (when comparing kinase + N to kinase alone) and at least half the magnitude of the positive control substrate for that kinase (kinase + kinase-specific positive control substrate).
Construct generation for affinity purification mass spectrometry (APMS) studies
Mutations were defined based on covariants.org, accessed on Jan 5,2022, and correspond to Alpha 20I V1, Beta 20H V2, Delta 21J, Gamma 20J V3, and Omicron 21K. Mutagenesis and subsequent plasmid preparation were performed by Genscript Biotech. Each sequence was codon optimized for expression in mammalian cells by Genscript Biotech. All plasmids were cloned in the lentiviral constitutive expression vector pLVX-EF1alpha-IRES-Puro (Takara Bio). Constructs are available from the authors upon request. Nsp3 plasmids were acquired from Lars Plate 75 and mutagenesis was performed by GenScript Biotech.
Transfections for APMS studies
For each viral protein construct (e.g., “bait”), n = 3 independent biological replicates were prepared for affinity purification and seven million HEK293T cells were plated per 15-cm dish. The WT and mutant baits for each SARS-CoV-2 protein were transfected as one experiment on the same day, and one GFP control and one empty vector (pLVX-EF1α-IRES-Puro) control were included in each experiment. The amount of bait plasmid transfected was determined based on previous affinity purification experiments of wave 1 only SARS-CoV-2 baits (2020 Nature paper). Total plasmid was topped up to 15 μg with empty vector and the following amounts of each bait or control plasmid were transfected: 2 μg GFP; 2.5 μg N, Orf3a, Orf9b; 5.0 μg Orf7b, Nsp2, Nsp6; 6.125 μg Nsp3; 7.5 μg E, Orf8, Nsp7, Nsp9, Nsp10, Nsp16; 10 μg Orf6, Nsp4, Nsp5, Nsp8, Nsp11, Nsp15; 12.5 μg S, M, Nsp12, Nsp14; 15 μg Orf3b, Orf7a, Orf9c, Orf10, Nsp1, Nsp13, empty vector. Each 15 μg plasmid per 15-cm dish was complexed with PolyJet Transfection Reagent (SignaGen Laboratories) at a 1:3 μg:μl ratio of plasmid:transfection reagent based on the manufacturer’s recommendations. After more than 38h, cells were dissociated on ice using 10 ml Dulbecco’s phosphate-buffered saline without calcium and magnesium (DPBS) supplemented with 10 mM EDTA for at least 5 minutes and subsequently washed three times with 10 ml DPBS. Each step was followed by centrifugation at 200g, 4 °C for 5 min. Cell pellets were frozen immediately on dry ice and stored at −80°C.
Sample preparation for APMS studies
Frozen cell pellets were thawed on ice for 15–20 min and resuspended in 1 ml IP lysis buffer. IP lysis buffer (50 mM Tris-HCl, pH 7.4 at 4 °C, 150 mM NaCl, 1 mM EDTA) was supplemented immediately before use with 0.5% Non-idet P40 substitute (NP40; Fluka Analytical) and cOmplete mini EDTA-free protease and PhosSTOP phosphatase inhibitor cocktails (Roche). Samples were then frozen on dry ice for 10–20 min and partially thawed at 37 °C before incubation on a tube rotator for 30 min at 4 °C and centrifugation at 13,000g, 4 °C for 15 min to pellet debris. Up to 96 samples were arrayed into a 96-well Deepwell plate for affinity purification on the KingFisher Flex (KFF) Purification System (Thermo Scientific) as follows: MagStrep ‘type3’ beads (30 μl; IBA Lifesciences) were equilibrated twice with 1 ml wash buffer (IP buffer supplemented with 0.05% NP40) and incubated with 0.95 ml lysate for 2h. Beads were washed three times with 1 ml wash buffer and then once with 1 ml IP buffer. To directly digest bead-bound proteins as well as elute proteins with biotin, beads were manually suspended in IP buffer and divided in half before transferring to 50 μl denaturation–reduction buffer (2 M urea, 50 mM Tris-HCl pH 8.0, 1 mM DTT) and 50 μl 1× buffer BXT (IBA Lifesciences) dispensed into a single 96-well KFF microtitre plate. Purified proteins were first eluted at room temperature for 30 min with constant shaking at 1,100 rpm on a ThermoMixer C incubator. After removing eluates, on-bead digestion proceeded. Streptagged protein expression in lysates and enrichment in eluates was assessed by western blot and silver stain, respectively. The KFF Purification System was placed in the cold room and allowed to equilibrate to 4 °C overnight before use. All automated protocol steps were performed using the slow mix speed and the following mix times: 30 s for equilibration and wash steps, 2h for binding and 1 min for final bead release. Three 10s bead collection times were used between all steps. Bead-bound proteins were denatured and reduced at 37°C for 30 min and, after being brought to room temperature, alkylated in the dark with 3 mM iodoacetamide for 45 min and quenched with 3 mM DTT for 10 min. Proteins were then incubated at 37 °C, initially for 4 h with 1.5 μl trypsin (0.5 μg/μl; Promega) and then another 1–2 h with 0.5 μl additional trypsin. To offset evaporation, 15 μl 50 mM Tris-HCl, pH 8.0 was added to each sample before trypsin digestion. All steps were performed with constant shaking at 1,100 rpm on a ThermoMixer C incubator. Resulting peptides were combined with 50 μl 50 mM Tris-HCl, pH 8.0 to rinse beads and then acidified with trifluoroacetic acid (0.5% final, pH < 2.0). Acidified peptides were desalted for MS analysis using a BioPureSPE Mini 96-Well Plate (20 mg PROTO 300 C18; The Nest Group) according to standard protocols.
Mass spectrometry proteomics data acquisition for APMS studies
Samples were resuspended in 0.1% formic acid and analyzed on a Q-Exactive Plus mass spectrometry system (Thermo Fisher Scientific) equipped with an Easy nLC 1200 ultra-high pressure liquid chromatography system (Thermo Fisher Scientific) interfaced via a Nanospray Flex nanoelectrospray source. For all analyses, samples were injected on a C18 reverse phase column (25 cm × 75 μm packed with ReprosilPur 1.9-μm particles). Analytical columns were equilibrated with 5 μl of mobile phase A with a max pressure of 650 bar. Mobile phase A consisted of 0.1% FA, and mobile phase B consisted of 0.1% FA / 80% ACN. Peptides were separated by an organic gradient from 2% to 7% mobile phase B over 1 minute, followed by an increase to 36% B over 53 min, then held at 95% B for 13 min, then reduced back down to 2% B for 11 minutes at a flow rate of 300 nl min−1. Data-dependent analysis (DDA) was performed by acquiring a full scan over a m/z range of 300–1500 in the Orbitrap at 70,000 resolving power with an AGC target of 1e6. Top 20 peptides were selected for MS/MS interrogation using in-source collision-induced dissociation (CID), with 20 MS/MS scans per cycle and 17,500 resolving power.
Affinity-purification western blot studies
For affinity purification (AP) western blot analysis, HEK293T cells were transfected with the indicated plasmid constructs using lipofectamine 2000 (Invitrogen). Twenty four (24) hours post-transfection, cells were harvested in NP-40 lysis buffer (50mM Tris-Cl pH 7.5, 150mM NaCl, 0.5% NP-40, 1mM EDTA) supplemented with cOmplete mini protease inhibitor cocktail and PhosSTOP phosphatase inhibitor cocktail (Roche). Clarified cell lysates were incubated with MagStrep ‘type3’ beads (IBA Lifesciences) for 2–4 h at 4°C, followed by washing the magnetic beads with NP-40 lysis buffer for five times. Protein complexes were eluted by direct incubation in 1X SDS loading buffer and heating at 95 °C. Eluates and whole-cell lysates were analyzed by western blotting using the indicated antibodies. The ORF clone for Flag-MARK2 was obtained from Genscript (#OHu23943D). The antibodies used in the study include: rabbit polyclonal anti-beta-actin (Cell Signaling Technology #4967, RRID:AB_330288, used at 1:2000); mouse monoclonal anti-Strep tag (QIAGEN #34850, RRID:AB_2810987, used at 1:1000); rabbit polyclonal anti-flag antibody (Sigma Aldrich #F7425, RRID:AB_439687, used at 1:2000); rabbit polyclonal anti-LEO1 antibody (Atlas antibodies #HPA040741, RRID:AB_10794859, used at 1:1000); rabbit polyclonal anti-WDR61 antibody (Atlas antibodies # HPA040065, RRID: AB_10793926, used at 1:1000); rabbit polyclonal anti-PAF1 antibody (Proteintech # 15441–1-AP, RRID: AB_2174457, used at 1:1000); rabbit polyclonal anti-CTR9 antibody (Proteintech # 21264–1-AP, RRID: AB_10734585, used at 1:1000).
Plitidepsin treatment of virus-infected mice
Animal studies using the K18-hACE2 (Strain #034860 from the Jackson Laboratories) were performed in animal biosafety level 3 (BSL3) facility at the Icahn school of Medicine in Mount Sinai Hospital, New York City. All work was conducted under protocols approved by the Institutional Animal Care and Use Committee (IACUC). We utilized five female mice 4-week-old specific pathogen–free per group. Mice were anesthetized with a mixture of ketamine/xylazine before each intranasal infection (e.g. nares) with different SARS-CoV-2 strains (Alpha, Beta, Gamma, Delta. Omicron and Washington strain, WA). Mice were infected with an inoculum of 2.5×10⁴ pfu in 50ul of PBS. Four (4) days post-infection (dpi) animals were humanely euthanized. Lungs were harvested for viral titration. Silica glass beads tubes were used for the homogenization. For viral titers, whole lung was homogenized in PBS then frozen at −80°C for viral titration via TCID50. Briefly, infectious supernatants were collected at 48 h post-infection and frozen at −80 °C until later use. Infectious titers were quantified by limiting dilution titration using Vero TMPRSS2 cells. Briefly, Vero-TMPRSS2 cells were seeded in 96-well plates at 20,000 cells/well. The next day, SARS-CoV-2-containing supernatant was applied at serial 10-fold dilutions ranging from 10−1 to 10−8 and, after 4 days, viral cytopathic effect (CPE) was detected by staining cell monolayers with crystal violet. TCID50/ml were calculated using the method of Reed and Muench. The R statistical software (package rstatix) was used to determine differences in lung titers using a twotailed, unpaired t-test assuming equal variances at a confidence interval of 95%. Not all infections were successful in the mice; we speculate this to be attributable to the nasal-oral interface being thin in this mouse strain, resulting in much of the inoculum going into the stomach instead of the lung in some animals. However, the exact cause remains unclear. To remove outlier mice from our analyses, we used a Hampel filter which excludes animals that deviated more than 3 standard deviations from the median.
Virus-like particle (VLP) assays
Virus-like particle assays were performed as previously described 12,14. Plasmids CoV2-N (0.67), CoV2-M-IRES-E (0.33), CoV-2-S (0.0016) and Luc-T20 (1.0) at indicated mass ratios for a total of 375 ng of DNA were diluted in 37.5 μL Opti-MEM containing 1.125 μg PEI (polyethyleneimine, Polysciences). For experiments with N*, mass ratios were 0.33 (N), 0.33 (N*), 0.33 (M-IRES-E), 0.0016 (S), Luc-T20 (1.0). Transfection mixture was incubated for 20 minutes at room temperature and then added to HEK293T cells in each well of a 96-well plate containing 150 μL of DMEM (with fetal bovine serum and penicillin/streptomycin). Media was changed after 24 hours of transfection. At 48 hours post-transfection, VLP containing supernatant was collected and filtered using a 0.45 μm pore size filter plate. VLP containing supernatant (50 μL) was added to 50 μL of cell suspension containing 50,000 receiver cells (HEK293T ACE2/TMPRSS2) in each well of tissue culture treated opaque white 96-well plate (Corning). Cells were allowed to attach and take up VLPs overnight. The next day, supernatant was removed, and cells were lysed in 20 μL passive lysis buffer (Promega) for 15 minutes at room temperature with gentle rocking. Using a TECAN Spark plate reader, 50 μL of reconstituted luciferase assay buffer (Promega) was added to each well and mixed for 15 seconds followed immediately by luminescence measurement. Expression of VOC N protein constructs was evaluated previously 12 and found to be equivalent across constructs 14.
QUANTIFICATION AND STATISTICAL ANALYSIS
mRNA sequencing quantitative analysis
All reads were mapped to the human host genome (ensembl 101) using HISAT2 aligner 76. Host transcript abundances were estimated using human annotations (ensembl 101) using StringTie 77. Differential gene expression was calculated on the basis of read counts extracted for each protein-coding gene using featureCount and significance was determined by the DESeq2 R package 78. On average, we quantified ~16,000–17,000 mRNA transcripts above 1 count per million reads.
SARS-CoV-2 genome reconstruction
Forward and reverse reads from mRNA sequence data were merged into one file and were not treated as paired-end for denovo assembly. Reads were normalized such that the maximum genome coverage would be no more than 200x using bbnorm from the bbmap package (https://jgi.doe.gov/data-and-tools/software-tools/bbtools/bb-tools-user-guide/bbmap-guide/). This aided assembly of genomes with high variability in coverage. Normalized reads were then assembled with SPAdes 79 (v3.15.3) with various k-mer sets ranging from 27 to 97. Assemblies were compared to the reference SARS-CoV-2 genome and complete assemblies of the entire genome were selected for further analysis.
Mass spectrometry proteomics data search for infected cells
Mass spectra from each DDA dataset were used to build experiment-specific libraries for DIA searches using the Pulsar search engine integrated into Spectronaut v. 16.0.220606.53000 (Hawking) by searching against a database of Uniprot Homo sapiens sequences (downloaded 22 March 2022) and a SARS-CoV-2 proteome of 149 protein sequences spanning five variants of concern (Alpha 20I V1, Beta 20H V2, Gamma 20J V3, Delta 21J, and Omicron 21K) and 32 viral proteins, including N-star (N*). For Experiment 3, directDIA search settings were used. For protein abundance samples, data were searched using the default Biognosys (BGS) settings, variable modification of methionine oxidation, static modification of carbamidomethyl cysteine, and filtering to a final 1% false discovery rate (FDR) at the peptide, peptide spectrum match (PSM) and protein level. For phosphopeptide-enriched samples, BGS settings were modified to include phosphorylation of S, T and Y as a variable modification. The generated search libraries were used to search the DIA data. For protein abundance samples, default BGS settings were used, with no data normalization performed. For phosphopeptide-enriched samples, the PTM site localization score in Spectronaut was applied. Imputation was removed for all analyses.
Mass spectrometry proteomics quantitative analysis for infected cells
Quantitative analysis was performed in the R statistical programming language (v.4.1.3). Initial quality control analyses, including inter-run clusterings, correlations, principal component analysis (PCA), peptide and protein counts and intensities were completed with the R package artMS (v. 1.12.1). On the basis of obvious outliers in intensities, correlations and clusterings in PCA analysis, one run was discarded from the phosphoproteomics dataset: Experiment 1, IC10_10h.1. Statistical analysis of phosphorylation and protein abundance changes between mock and infected runs, as well as between infected runs from different variants were computed using peptide ion fragment data output from Spectronaut and processed using artMS. Quantification of phosphorylation differences was performed using artMS as a wrapper around MSstats, via functions artMS::doSiteConversion and artMS::artmsQuantification with default settings. All peptides containing the same set of phosphorylated sites were grouped and quantified together into phosphorylation site groups. For both phosphopeptide and protein abundance MSstats pipelines, MSstats performs normalization by median equalization, no imputation of missing values, and median smoothing to combine intensities for multiple peptide ions or fragments into a single intensity for their protein or phosphorylation site group. Lastly, statistical tests of differences in intensity between infected and control time points were performed. When not explicitly indicated, we used defaults for MSstats for adjusted P values, even in cases of n = 2. By default, MSstats uses the Student’s t-test for P value calculation and the Benjamini–Hochberg method of FDR estimation to adjust P values.
Quantifying viral RNAs in infected cells
Coronavirus RNA transcripts were characterized by the junction of the leader with the downstream subgenomic sequence. Reads containing possible junctions were extracted by filtering for exact matches to the 3’ end of the leader sequence “CTTTCGATCTCTTGTAGATCTGTTCTC” or the mutated form “CTTTTGATCTCTTGTAGATCTGTTCTC” (mutation underlined) as appropriate for BA.2, BA.4 and BA.5 using the tool bbduk from the BBTools package (version 38.96; Bushnell B. - sourceforge.net/projects/bbmap/). This subset of leader-containing reads were then left-trimmed to remove the leader, also using bbduk. The filtered and trimmed reads were then matched against a full length genomic sequence with the bbmap tool from BBtools using settings (maxindel=100, strictmaxindel=t, local=t). The left-most mapped position in the reference was used as the junction site. Full length genome sequences were assembled de novo from all reads from a late time point sample of the same virus in the same batch using SPAdes 79, as described above. The position numbers between viral genomes were standardized to a reference SARS-CoV-2 sequence (accession NC_045512.2) using global pairwise alignments of full length sequences. Junction sites were labeled according to canonical locations of TRS sequences, or other known site with a +/− 5 base pair window as follows (genomic = 67, S = 21553, orf3 = 25382, E = 26237, M = 26470, orf6 = 27041, orf7 = 27385, orf8 = 27885, N = 28257, orf9b = 28280, N* = 28878).
Quantifying viral proteins in infected cells
Peptide ions or “features” (each charge state treated separately) that were likely false identifications based on an unexpected observation within the mock-infected samples were excluded. This exclusion was based on a categorical linear regression of log2 intensity values at 24 hours post infection using the R function lm per peptide ion, encoding category names to treat all mock-infected samples as the intercept, and requiring a significant coefficient on each and all of the virus samples (log2FC > 1, p-value < 0.05, two sided t-test). This exclusion was done separately per experiment. For the rSARS-CoV-2 N D3L and −3 deletion mutant virus experiment (exp. 6), we removed falsely identified peptide ions by required peptide ion intensities to be at least 10x greater in the average of infection conditions relative to the mock conditions. Once final features were selected, viral protein intensities were calculated as the sum of feature intensities that mapped to each viral protein (as determined by the Spectronaut search, above).
Quantifying viral protein phosphorylation in infected cells
We started by systematically determining the amino acid mutations present within each VOC (Table S1) relative to the Wuhan reference, annotated by its position within each viral protein. Deletions or insertions were annotated in relation to the Wuhan reference. Phosphorylated peptide intensities were defined as the sum of phosphorylated peptide ion (i.e., same peptide could have different charge states or other modifications such as oxidation) intensities from the phosphoproteomics data (per biological replicate), requiring that summed peptides had identical phosphorylation site modification(s). For example, a peptide with two forms, phosphorylated on one site or two, were quantified separately. Importantly, only phosphorylated peptides that possessed a conserved sequence across each pair of viruses being compared were used for quantification of phosphorylated peptide intensities to control for physicochemical peptide properties that may affect their quantitation using mass spectrometry. Viral protein intensities were defined as the sum of peptide feature intensities from the abundance proteomics data that mapped to each viral protein (as determined by the Spectronaut search, above). We then calculated the ratio between each corresponding phosphorylated peptide intensity and viral protein intensity per biological replicate (phosphorylated peptide intensity / viral protein intensity). Next, we performed a two-tailed t-test, assuming unequal variance, generating a t-statistic and p-value per phosphorylated peptide. We required at least two biological replicates per condition to perform the t-test (see Table S2 for full set of results).
Mutation and structure analysis
For the conservation analysis, SARS-CoV-2 protein sequences were downloaded from Uniprot 80 and the orf1ab polyprotein split into sub-sequences based on the Uniprot annotation. A custom reference database was generated based on the NCBI virus coronavirus genomes dataset (NCBI Resource Coordinators, 2018), which includes sequences from a large range of coronaviruses. SARS-CoV-2, SARS and MERS sequences were filtered to only contain sequences from the Wuhan-Hu-1 strain, the Urbani strain and the HCoV-EMC/2012 strain respectively. Without this the dataset contains very large numbers of almost identical sequences from patient samples, which are not informative since SIFT4G looks to compare across species. The remaining sequences were clustered using MMseqs2 81 with an overlap threshold of 0.8 and a sequence identity threshold of 0.95, which grouped other duplicate sequences into representative clusters. SIFT4G Scores were generated for all possible variants to the SARS-CoV-2 sequences based on this database. A modified copy of SIFT4G was used, which reports scores to 5 decimal places instead of the usual 2.
For the structural destabilization analysis, structures were sourced from the SWISS-Model 64,82 SARS-CoV-2 repository (https://swissmodel.expasy.org/repository/species/2697049), which contains experimental structures and homology models. Models were required to have greater than 30% sequence identity and a QMean score 83 greater than −4, as recommended by SWISS-Model. Suitable models were available for 19 of the 28 viral proteins. Models were ordered by priority; firstly experimental models over homology models and then by QMean Score. Models were examined in turn and any position not covered by a higher priority model was added to the FoldX analysis pipeline. FoldX’s RepairPDB command was used to pre-process selected SWISS-Model PDB files. All mutations at each position assigned to each model were modeled using the BuildModel command, using the average ΔΔG prediction from three runs.
For the structural accessibility analysis, we used Naccess (Hubbard and Thornton, 1993), which was run on each structure using the default settings. Structures were filtered to only include the chain corresponding to the appropriate SARS-CoV-2 protein. This means some surface accessible positions are usually found in interfaces rather than facing the solvent. Since structures are not always complete, surface accessibility is an approximation and will not be accurate in all cases. The code managing the pipeline and analyses are available at https://github.com/allydunham/mutfunc_sars_cov_2. The web service source code is available at https://github.com/allydunham/mutfunc_sars_cov_2_frontend. The pipeline is managed through Snakemake 84. For more information about the mutation and structure analysis, see prior work 85.
Mass spectrometry proteomics data search for APMS studies
Resulting mass spectra were searched using MaxQuant (v.1.6.12.0) 86,87 using default settings and searching against a database of Uniprot Homo sapiens sequences (downloaded 22 March 2022), a SARS-CoV-2 proteome of 149 protein sequences spanning five variants of concern (Alpha 20I V1, Beta 20H V2, Gamma 20J V3, Delta 21J, and Omicron 21K) and 32 viral proteins, including N-star (N*), and the enhanced green fluorescence protein (eGFP) sequence. Detected peptides and proteins were filtered to 1% false-discovery rate in MaxQuant.
Scoring protein-protein interactions for APMS studies
Identified proteins were subjected to protein–protein interaction scoring with both SAINTexpress (v.3.6.3)88 and MiST (https://github.com/kroganlab/mist) 89,90 scoring algorithms. For SAINT scoring, each APMS experimental batch was scored separately relative to independent negative controls: empty vector (EV) and enhanced green fluorescence protein overexpression (eGFP). For MiST scoring, all samples across all batches were scored together. Three scoring thresholds were generated, all included the requirement of average spectral counts (AvgSpec) to be greater than two: (i) SAINT only requiring SAINT BFDR<0.05, (ii) SAINT and MiST requiring BFDR<0.05 & MiST>0.5, and our final selected threshold (iii) SAINT, MiST, and Gordon et al. (2020) requiring [BFDR<0.05 & MiST>0.5] | [BFDR<0.05 & present in Gordon et al. (2020)]. These thresholds had to be satisfied in either the mutant or wave 1, but not both, for every mutant and wave 1 pair. Although (iii) is our final, most high-confidence, scoring scheme, interactions in (i) and (ii) are worth consideration for follow-up studies (see Table S3 for full list of unthresholded and highconfidence interactions).
Differential protein-protein interaction analysis for APMS studies
We used the R package MSstats 91 to quantify changes in “prey” protein abundance between the corresponding mutant (VOC) and wave 1 “bait” forms. We first converted MaxQuant evidence files to MSstats format using MaxQtoMSstatsFormat with proteinID=”Leading.razor.protein”, useUniquePeptides=FALSE, summaryforMultipleRows=sum, removeFewMeasurements=FALSE, removeOxidationMpeptides=FALSE, and removeProtein_with1Peptide=FALSE. We then ran the dataProcess function with featureSubset=”all”, normalization=”equalizeMedians”, MBimpute=FALSE, and summaryMethod=”TMP”. In essence, we performed normalization by median equalization, did not impute missing values, and combined (i.e., “summarized”) intensities for multiple peptide ions or fragments into a single intensity for their protein group. Lastly, statistical tests of differences in intensity between mutant and wave 1 were performed. We used defaults for MSstats for adjusted P values, even in cases of n = 2. By default, MSstats uses the Student’s t-test for P value calculation and the Benjamini–Hochberg method of FDR estimation to adjust P values. This analysis resulted in log2 fold changes (log2FC) and p-values per interaction between corresponding mutant and wave 1 baits. We defined differential interactions based on two criteria: (1) The prey must be a high-confidence interaction in either the mutant or wave 1 bait (see scoring thresholds above) and (2) the prey must be changing in abundance between the mutant and wave 1 forms with an absolute value log2FC>0.05 and p<0.05. For all proteins that fulfilled these criteria, we extracted information about the stable protein complexes that they participated in from the CORUM database of known protein complexes 63. We visualized differential interactions and CORUM complexes using Cytoscape (v.3.8.0) 92. We exported the cytoscape network as PDF and imported the PDF into Adobe Illustrator to refine the aesthetics and add annotations for protein complexes and biological processes. Biological process terms were manually refined from a set of GO Biological Process enrichments acquired using the clusterProfiler package 93 in R.
Defining functional modules for integrative computational analysis
To define the genes and functional modules involved in host response, infection-regulated host genes were defined by requiring significant changes at any time point versus time-matched mocks using thresholds of absolute log2FC > 1 and p-value < 0.001 for phosphoproteomics and transcriptomics. Using a single unadjusted p-value, as opposed to a FDR threshold, across all viruses allowed for the application of consistent thresholds per virus without favoring any while still keeping the FDR to a reasonable level (0.00x to 0.00x for all contrasts) based on the high number of regulated genes. For phosphoproteomics, we further limited the set to only the likely functionally-important phosphorylation sites by requiring a functional score greater than 0.4 according to Ochoa et al. 94. For the proteomics data with lower number of regulated proteins, there was more need to control the FDR, so we used thresholds of absolute log2FC > log2(1.5) and FDR-adjusted (Benjamini-Hochberg) p-value < 0.05. Additionally, within each of the three different omics, a gene or phosphosite had to pass these thresholds twice at either different time points, viruses, or batches. All genes that passed thresholds of regulation in any omics in batches Experiment 1 and 2 were pooled to define the total set of infection-regulated genes. A subnetwork of STRING (version 11.5) was then extracted that contained all matching STRING proteins using STRING’s gene alias table, and all edges between any pair of these STRING proteins with composite score greater than 0.6. A matrix of network distances between all genes was calculated using Diffusion State Distance (DSD) 95. DSD evaluates inter-gene network distance based on differences of diffusion by random walks from the two genes, and was a major portion of the best overall method for network module detection in Choobdar et al. 96. The DSD distance matrix was used as input to the R function hclust with agglomeration method set to “average”. The resultant hierarchical clustering was divided into modules by the function cutreeHybrid in R package dynamicTreeCut (version 1.63–1) with deepSplit set to 3. Modularization was visualized by coloring genes by module on a t-SNE plot of the regulated genes built using the R package Rtsne (version 0.16) with the DSD distance matrix as input. Modules were named by performing over representation analysis on sets of genes annotated by all gene ontology terms using the R package clusterProfiler (version 4.4.1) and the R annotations package org.Hs.eg.db (version 3.15.0). From among the eight GO terms with the lowest p-value per module, the term with the greatest number of genes was chosen for the module’s name, with ties broken by lowest p-value.
Calculating module correlations for integrative computational analysis
For each unique combination of batch, virus, timepoint, and omics, the response of a module to infection was calculated as the mean of all observed genes’ absolute log2FC vs mock. The mean of all modules’ values from transcriptomics was used as the Average Host Response (AHR). Correlation values between modules, using each of proteomics, phosphoproteomics and transcriptomics separately, and the AHR or virus protein levels were calculated as Pearson’s R using the values from the 11 samples from 7 different viruses in experiments 1 and 2. Each module gets a separate correlation to the AHR for its proteomics, phosphoproteomics and transcriptomics. These three different correlations were summarized to a composite R value using geometric mean to rank them for their correlation to AHR. The geometric mean was used to favor consistently high correlation across the three omics. To rank those least correlated, we defined the composite R value by first transforming by subtracting from 1, taking the geometric mean, and then subtracting from 1 again to convert back to a similar scale as the original R values. This transformation allowed for the handling of negative R values and still enabled the property of geometric means to favor consistently high numbers to find those that are consistently low. For correlating modules with virus protein intensity, the log2 virus protein intensities were used.
Network propagation version of integrative computational analysis
We downloaded the human physical protein-protein interaction network from String, version 11.5 97. We focused on genes with full RNA data across the 11 conditions whose encoded proteins are present in the network. For each gene and each condition, we set its log2 fold-change (24hpi relative to mock) in absolute value as a prior value for that condition. We subjected these values to a network propagation process with symmetric normalization and a parameter of 0.5, which smooths the values across the network while accounting for their prior values 98. The resulting values were averaged for every module and condition and compared to these averages across all modules (AHR, average host response). We further computed nominal p-values per module by comparing a module’s AHR correlation value to those obtained by randomizing module assignment while preserving module sizes. Similar analyses were conducted for abundance and phosphoproteomics data by completing missing (prior) data with zeros.
Variant-specific integrative computational analysis
The variant-specific analysis was performed by calculating the residual for each variant from the x=y line in a plot of AHR versus each module abs(log2FC). Modules with between 1 and 3 variants (but not more) with abs(residuals) > 0.5 were retained and visualized in a heatmap.
Supplementary Material
Supplementary Figure 1. Primary cell infections and proteomics quality control for Calu-3 cells, related to Figure 1. (A-C) Primary human airway epithelial (HAE) cells infected with 1500 E copies per cell of indicated VOCs. (A) Apical release of virus measured over time or (B) intracellular E levels at 72 hours post infection (hpi; n=5–7). (C) Apical release over time for Alpha, Delta and two independent Omicron BA.1 isolates. For D and E, VOCs were compared to IC19 by Mann-Whitney test at each time point. (D) Number of unique peptides (intensity > 2E5) detected in each sample from data independent acquisition (DIA) mass spectrometry abundance proteomics analysis of Calu-3 cells at 10 and 24 hpi for experiment 1 (left) and 2 (right). (E) Number of unique proteins mapping to peptides in (A). (F) Number of unique phosphorylated (PH) peptides (intensity > 2E5) detected in each sample from DIA mass spectrometry phosphoproteomics analysis of Calu-3 cells at 10 and 24 hpi for experiment 1 (left) and 2 (right). (G) Fraction of peptides with a phosphate modification in phospho-enriched samples, corresponding to peptides from (F). (H) Number of unique phosphorylated (PH) proteins mapping to peptides in (F). (I) Pairwise correlation of peptide intensities within condition (black) and between conditions (gray) for abundance proteomics (left) and phosphoproteomics (right) analysis in experiments 1 and 2. (J) Principal components analysis (PCA) of peptide intensities (protein abundance and phosphorylation, left and middle) or transcript counts (RNA, right) for virus infections in Calu-3 cells at 10 and 24 hpi. Experiment number is annotated by shape and time point by shape size. The percent of explained variance is indicated in parentheses for each principal component. Although the second principal component often separates according to the experiment, the rank ordering of the same viruses across different experiments is well preserved along the first principal component, which explains the greatest variance in the data.
Supplementary Figure 2. Viral RNA and protein expression, reverse genetics, and virus-like particles, related to Figure 2. (A) Western blot of Calu-3 cells infected with 2000 E copies per cell of VIC, IC19, Alpha, Beta, Gamma, Delta and Omicron BA.1 at 24 hours post infection (hpi). Of note, the lack of Orf9b detection in the Omicron infection samples may be due to mutations in Omicron Orf9b affecting the epitope for the antibody. (B) Correlation between viral RNA and protein expression for each virus relative to VIC. Dashed line indicates x=y line. (C) Percentage of RNA reads mapping to each SARS-CoV-2 viral gene. Genomic refers to reads mapping to Orf1a. Bold indicates N*. (D) Expression of viral RNA (left) and protein (right) at 48 hpi in Calu-3 cells infected with an wave 1 SARS-CoV-2 (W1), one mutant with a D3L change in N (GAU→CUA), one mutant with a deletion at the −3 position upstream from the translation start site for N, and one with both mutations, created using reverse genetics approaches. Quantifications are normalized to genomic (leader + orf1a) counts or sum of Nsps per virus to control for differences in viral replication and defined relative to wildtype virus (log2(counts/genomic/W1)). Statistical significance testing is performed using a two-tailed t-test assuming unequal variance. *, p<0.05; **, p<0.01; ***, p<0.001. ns=not significant. (E) Expression of viral RNA from bulk mRNA sequencing at 24 hpi for Alpha, a Wuhan early-lineage control, and two attempts at creating R203K/G204R mutants within the Wuhan background (mutant 1 and 2). All TMP counts are normalized to genomic (leader + orf1a) per virus to account for differences in viral replication. (F) Expression of SARS-CoV-2 N* (N-star) subgenomic RNA from bulk mRNA sequencing at 24 hpi in Calu-3 cells for all viruses in experiments 1 and 2. N* is a viral protein encoded within, and in-frame with, the N protein sequence, containing the C-terminal part of N from amino acid position 210 to the end of N. (G) Genomic sequence of viruses under study, highlighting the region surrounding the translation start site of N*. Mutations within the N* TRS in Alpha, Gamma, and Omicron (corresponding to the R203K/G204R mutations in N) are predicted to enhance the N* TRS leading to increased N* sgRNA production. (H) Expression of viral subgenomic RNA from bulk mRNA sequencing at 24 hpi in Calu-3 cells with an early-lineage SARS-CoV-2 (W1) from Wuhan and two individual attempts at constructing a virus with a GGG→AAC mutation (corresponding to the R203K/G204R in N), created using reverse genetics approaches. Quantifications are normalized to genomic (leader + Orf1a) counts per virus to control for differences in viral replication and defined relative to the average of wave 1, mutant 1, and mutant 2 (counts/mean(counts)) per viral gene. It was not possible to normalize or statistically compare to wildtype because zero N* counts were detected in the wildtype condition (n.d.). (I) Cartoon depiction of virus-like particle (VLP) system 12. Plasmids encoding SARS-CoV-2 structural proteins and luciferase are transfected into HEK293T, which produce virus particles containing the luciferase RNA as a genome. These VLPs were collected from the supernatant and administered to fresh HEK293T cells expressing ACE2 and TMPRSS2 from which the production of luciferase luminescence is quantified. (J) Results from VLP experiment described in (I). N proteins encoding mutations from Alpha, Gamma, and Omicron or N* were transfected alongside W1 forms of the other structural proteins (S, E, and M) and the resulting luminescence quantified. Interestingly, N* alone (no full length N) is able to package RNA and produce VLPs. All error bars in this figure represent the standard error (SE). </p/>(K) Results from VLP experiment described in (I). N proteins encoding mutations from each VOC were transfected alongside W1 forms of the other structural proteins (S, E, and M) and the resulting luminescence of VLP infection quantified. Error bars depict standard error (SE) of 4 biological replicates.
Supplementary Figure 3. Virus-host phosphorylation and protein-protein interactions, related to Figures 2 and 3. (A) Global phosphoproteomics map of viral protein phosphorylation sites detected during infection with at least one virus at any time point (Alpha, Beta, Gamma, Delta, Omicron BA.1, VIC, or IC19) in Calu-3 cells (black lollipops). Colors delineate known protein domains.(B) Heatmap of significantly changed phosphorylated peptides mapping to N protein at 24hpi. Rows indicate the comparison (first virus is numerator, second is denominator) and columns indicate the phosphorylated peptides. Color represents the t-statistic and black bounding boxes indicate if p≤0.001. Gray boxes indicate peptides that were either not detected in one or both viruses or did not possess identical sequences between viruses. (C) Left: Density distribution of naccess surface accessibility calculations for mutations within the VOCs (colored lines) compared to all possible mutations (background, gray shaded region). Only viral proteins with solved structures were included. Shift to the right indicates increased surface accessibility for mutations in VOCs compared to the background. Right: Distribution of FoldX ΔΔG predictions for mutations in SARS-CoV-2 variants of concern (VOCs) compared to the background distribution of all possible mutations. Interpretation is that VOC mutations are generally less structurally destabilizing and more evolutionarily tolerated than background. FoldX was run based on the highest quality structure available in the SARS-CoV-2 SWISS-model repository 64 containing 19 of the 28 viral proteins.(D) Jitter plot showing log2 fold changes (log2FC) of interactions conserved (gray) between VOC and W1, increased in binding to mutant (red) and decreased in binding to mutant (blue), for each viral “bait” protein. Positive and negative infinity log2FC values indicate interactions detected in mutant or W1 only, respectively. Significant increase in mutant binding affinity (red) is defined as log2 fold-change>0.5 & p<0.05. Significant decrease in mutant binding affinity (blue) is defined as log2 fold-change<−0.5 & p<0.05. Right, same but broken down by VOC. (E) Affinity purification western blot of strep-tagged VOC N or N*, blotting for endogenous PAF complex members: LEO1, WDR61, PAF1, and CTR9. This confirms APMS results showing N* specific interaction with the human PAF complex. (F) Affinity purification western blot of strep-tagged Orf9b (coding changes from Omicron (P10S and ENAdel) and Delta (T60A)) and flag-tagged MARK2 to confirm the enhanced interaction between Delta orf9b and MARK2 observed by APMS.
Supplementary Figure 4. Heatmap of affinity purification mass spectrometry data, related to Figure 3. Each block represents a single annotated viral protein. Black lines denote viral bait proteins that are complete with all consensus mutations present in each variant of concern (“complete VOC construct”). If multiple mutations exist in a single VOC protein, all are combined together in the same construct. Purple lines depict other constructs possessing individual mutations or other combinations of mutations to assess the impact of single mutations on protein interactions (“non-complete or individual mutations”). Color indicates the log2 fold change of the abundance of each prey protein in the affinity purification between the mutant and W1 form. Red indicates increased binding to mutant and blue indicates decreased binding to mutant. Black bounding boxes indicate a significant differential interaction (p<0.05). White-dashed boxes indicate a prey detected in only the mutant (red) or W1 (blue). To simplify the diagram, only human prey proteins that were significantly differentially interacting (abs(log2FC)>0.5 & p<0.05) for one of the “complete variant constructs” are visualized for the remaining constructs. See Table S3 for the complete list of interactions.
Supplementary Figure 5. Functional interrogation of host pathways hijacked by VOCs, related to Figure 4. (A) Network propagation analysis of multiomics datasets as done for integrative computational analysis to confirm findings using an orthogonal approach (see Methods). (B) Variant-specific analysis. We calculated the residual for each variant from the x=y line in a plot of AHR versus each module abs(log2FC). Modules with between 1 and 3 variants (but not more) with residuals > 0.5 were retained and visualized in a heatmap. Colors correspond to residuals. Black boxes indicate if residual > 0.5. (C) Translation related modules within the top 10 most correlated with the AHR. Scatter plot, linear regression lines, and Pearson’s R correlation coefficients are shown for each module from the RNA dataset. (D) Experimental workflow for in vivo pharmacological study. K19-ACE2 mice were treated with a VOC, wave 1 control (Washington strain or WA), or vehicle (PBS) on day 0 and dosed with 0.3mg/kg plitidepsin once a day for three days. Mouse lungs were harvested on the fourth day and viral titers were assessed by TCID50. Five mice were included per group. Mice with low infection were excluded from subsequent analyses. (E) Comparison of viral titers (log10 TCID50/mL) in K18-ACE2 mice from each virus, comparing plitidepsin treatment to vehicle. Statistical significance was determined using a two-tailed t-test, p values are annotated. Error bars represent the standard error (SE). Pairwise comparisons against Mock at each time point were performed using Mann-Whitney test. (F) Replication of indicated isolates measured by E copies (top) or N-expression (bottom) in Calu-3 cells (n=3). (G-H) Expression of IFNβ (G) or CXCL10 (H) in infected Calu-3 cells at 24 hours post infection (hpi) for RNA (left) and protein (right) (n=3). (I) Viral replication and expression of IFNB or IFIT1 of 3 independent Omicron BA.1 isolates in comparison to VIC, IC19, Alpha and Delta are shown at 24hpi (n=3). (J) Nuclear-to-cytoplasmic IRF3 ratio measured by single-cell immunofluorescence at 24 hpi in Nucleocapsid positive Calu-3 cells infected at 2000 E copies per cell. Per condition, 1500 randomly sampled cells are shown. For (F)-(J), pairwise comparisons were performed using One-Way ANOVA. (K) Nuclear-to-cytoplasmic IRF3 ratio measured by single-cell immunofluorescence measured in Nucleocapsid positive or negative cells. Stars indicate significance relative to Mock using One-Way ANOVA. (L) Western blot for Orf9b expression levels in Calu-3 cells infected with Alpha wild-type (WT) or Alpha Orf9b knock-out (ΔOrf9b) at 24hpi. (M) Replication and IFNB or IFIT2 expression over time in Calu-3 cells infected with Alpha WT or Alpha ΔOrf9b (n=3). (N) Replication of Alpha WT or Alpha ΔOrf9b reverse genetics mutant virus in primary human airway epithelial (HAE) cells over time in the absence (left) or presence (right) of ruxolitinib (Rux) (n=3). For (M)-(N), pairwise statistical comparison at each timepoint was performed using One-Way ANOVA. </p/>p<0.5, *; p<0.01, **; p<0.001, ***; p<0.0001, ****. Significance is indicated by *. ns=not significant.
Supplementary Figure 6. Heatmaps of inflammatory gene expression during VOC infection, related to Figures 4 and 5. (A) Heatmap of interferon stimulated genes (ISGs) and pro-inflammatory genes (RNA) for experiment 1 (top) and 2 (bottom). Color indicates the log2 fold change in expression relative to VIC. (B) Same as in (A) but for the Omicron subvariant experiment (RNA). (C) Same as in (A) but for protein. Only ISGs are included because pro-inflammatory genes were sparsely detected at the protein level, perhaps because they are typically excreted from the cell. (D) Same as in (B) but for protein. Only ISGs are included because pro-inflammatory genes were sparsely detected.
Supplementary Figure 7. Inflammatory response and viral gene expression for Omicron subvariants and Orf6 knock-out virus, related to Figure 5. (A) RNA expression of interferon stimulated genes (ISG; left) and pro-inflammatory genes (right) at 48 hours post infection (hpi) for all viruses used in the Omicron subvariant experiment (Alpha, Delta, IC19, BA.1, BA.2, BA.4, and BA.5). Values are the average log2 fold change in expression relative to VIC. (B) Relationship between ISG and pro-inflammatory gene expression across all viruses listed in (A). (C) Viral RNA expression for viruses listed in (A) at 24 hpi. Quantity on the x-axis is the log2 of RNA counts normalized to genomic (Orf1a + leader) counts, then normalized to IC19. (D) Same as in (C) but at 48 hpi. (E) Same as in (C) but for viral protein. Quantity on the x-axis is the log2 of protein intensity normalized to the sum of non-structural protein intensities, then normalized to IC19. (F) Pro-inflammatory gene regulation by Alpha, Omicron BA.1, an Orf6 knock-out (KO) virus in the Alpha background generated using reverse genetics, and poly I:C, compared to VIC. All error bars in this figure represent the standard error (SE).
Table S1. Consensus mutations in the VOCs from CoVariants.org, related to Figure 1.
Table S2. Viral RNA, protein, and phosphorylation site abundances during infection, including analysis comparing viral phosphorylated peptide intensities across VOCs, related to Figures 2 and 5.
Table S3. Affinity purification mass spectrometry (APMS) metadata and results, related to Figure 3.
Table S4. Integrative computational analysis metadata and results, related to Figure 4.
Key resources table
| REAGENT or RESOURCE | SOURCE | IDENTIFIER |
|---|---|---|
| Antibodies | ||
| Anti-human IFIT1 rabbit monoclonal antibody, clone: D2X9Z | Cell Signaling Technology | Cat# 14769, RRID:AB_2783869 |
| Anti-human MX1 rabbit monoclonal antibody, clone: D3W7I | Cat# 37849, RRID:AB_2799122 | |
| Anti-SARS Coronavirus Spike rabbit polyclonal antibody | Thermo Fisher Scientific |
Cat# PA1-41165, RRID:AB_1087210 |
| Anti-SARS-CoV-2 ORF6 rabbit polyclonal antibody | Abnova | Cat#: PAB31757 |
| Anti-SARS-CoV-2 ORF9b rabbit polyclonal antibody | ProSci | Cat#: 9191 |
| Anti-SARS-CoV N human monoclonal antibody, clone: Cr3009 | A gift from Laura McCoy, UCL | described in Thorne et al, 2021 |
| Alexa Fluor 488-conjugated AffiniPure F(ab’)2 Fragment Donkey Anti-Human IgG | Jackson ImmunoResearch | Cat# 709-546-149; RRID: AB_2340569 |
| Alexa Fluor® 594 AffiniPure F(Ab’)2 Fragment Goat Anti-Mouse IgG | Jackson ImmunoResearch | Cat#: 115-585-006; AB_2338872 |
| Anti-human beta-Actin rabbit monoclonal antibody, clone: 6L12 | Sigma-Aldrich | Cat# A2066, RRID:AB_476693 |
| Goat anti-Mouse IgG H&L (IRDye® 680RD) | Abcam | Cat# ab216776 |
| Goat anti-Rabbit IgG H&L (IRDye® 800CW) | Abcam | Cat# ab216773 |
| Goat anti-Mouse IgG H&L (IRDye® 800CW) | Abcam | Cat# ab216772 |
| Goat Anti-Rabbit IgG H&L (IRDye® 680RD) | Abcam | Cat# ab216777 |
| IRDye 800CW Goat anti-Human IgG Secondary Antibody | Li-Cor | Cat#: 926-32232 |
| Anti-dsRNA mouse monoclonal antibody, clone: rJ2 | Millipore | Cat# MABE1134, RRID:AB_2819101 |
| Anti-human IRF-3 mouse monoclonal antibody, clone: SL-12 | Santa Cruz Biotechnology | Cat# sc-33641, RRID:AB_627826 |
| Bacterial and virus strains | ||
| SARS-CoV-2 Alpha (B.1.1.7) | A gift from Wendy Barclay, Imperial College London | hCoV-19/England/204690005/2020 EPI_ISL_693401 |
| SARS-CoV-2 Beta (B.1.351) | A gift from Alex Sigal, AHRI | hCoV-19/South Africa/KRISP-K005325/2020 EPI_ISL_678615 |
| SARS-CoV-2 Gamma (P.1) | A gift from Wendy Barclay, Imperial College London | hCoV-19/England/520336_B1_P0/2021 EPI_ISL_2080492 |
| SARS-CoV-2 Delta (PANGO lineage B.1.617.2) | A gift from Wendy Barclay, Imperial College London | hCoV-19/England/SHEF-10E8F3B/2021 EPI_ISL_1731019 |
| SARS-CoV-2 BA.1 (PANGO lineage B.1.1.529.1) | A gift from Wendy Barclay, Imperial College London | Peacock et al, 2022 |
| SARS-CoV-2 BA.1 (PANGO lineage B.1.1.529.1) (isolate B) | A gift from Wendy Barclay, Imperial College London | N/A |
| SARS-CoV-2 BA.1 (PANGO lineage B.1.1.529.1) (isolate C) | A gift from Wendy Barclay, Imperial College London | N/A |
| SARS-CoV-2 BA.2 (PANGO lineage B.1.1.529.2) | A gift from Wendy Barclay, Imperial College London | Peacock et al, 2022 |
| SARS-CoV-2 BA.4 (PANGO lineage B.1.1.529.4) | A gift from Alex Sigal, AHRI | EPI_ISL_12268495. 2 |
| SARS-CoV-2 BA.5 (PANGO lineage B.1.1.529.5) | A gift from Alex Sigal, AHRI | EPI_ISL_12268493.2 |
| SARS-CoV-2 VIC (PANGO lineage B) | NISBC | BetaCoV/Australia/V IC01/2020 |
| SARS-CoV-2 IC19 (PANGO lineage B.1.13) | A gift from Wendy Barclay, Imperial College London | hCoV-19/England/IC19/2020 EPI_ISL_475572 |
| SARS-CoV-2 Alpha WT virus | This paper | N/A |
| SARS-CoV-2 Alpha Orf6 deletion virus (Alpha Orf6 KO) | This paper | N/A |
| SARS-CoV-2 Alpha Orf9b deletion virus (Alpha Orf9b KO) | This paper | N/A |
| SARS-CoV-2 Wuhan-Hu-1-D614G WT | This paper | N/A |
| SARS-CoV-2 Wuhan-Hu-1-D614G R203K/G204R (mutant 1) | This paper | N/A |
| SARS-CoV-2 Wuhan-Hu-1-D614G R203K/G204R (mutant 2) | This paper | N/A |
| Biological samples | ||
| Bronchial human airway epithelial cells | Epithelix | Cat #: EP51AB |
| Chemicals, peptides, and recombinant proteins | ||
| Intracellular Staining Permeabilization Wash Buffer | Biolegend | Cat# 421002 |
| RLT Buffer (RNeasy Lysis Buffer) | Qiagen | Cat# 79216 |
| β-mercaptoethanol (Sigma-Aldrich) | Sigma-Aldrich | Cat# M3148 |
| TaqMan™ Master-Mix | ThermoFisher | Cat# 4369016 |
| SuperScript™ IV Reverse Transcriptase | ThermoFisher | Cat# 18090050 |
| Fast SYBR™ Green Master Mix | Applied Biosystems | Cat# 4385612 |
| Hoechst33342 | ThermoFisher | Cat# H3570 |
| Sep-Pak C18 cartridge | Waters | Cat#WAT054955 |
| Sequencing-grade modified trypsin | Promega | Cat#V5111 |
| Guanidine Hydrochloride | Fisher | Cat# G3272-500G |
| PureCube Fe-NTA MagBeads | Cube Biotech | Cat# 31505-Fe |
| Critical commercial assays | ||
| Human IFN-beta Quantikine ELISA Kit | Bio-Techne/R&D systems | Cat#: DIFNB0 |
| Human CXCL10/IP-10 DuoSet ELISA | Bio-Techne/R&D systems | Cat#: DY266 |
| Deposited data | ||
| Infection proteomics data | This paper | PRIDE Project ID: PXD036968 |
| AP-MS proteomics data | This paper | PRIDE Project ID: PXD036798 |
| Infection RNAseq data | This paper | GEO: GSE213759 |
| Experimental models: Cell lines | ||
| Vero E6 | ATCC | Cat# CRL-1586 |
| Vero TMPRSS2 | BPS Bioscience | Cat# 78081 |
| A549-ACE2 | Miorin et al. 2022 | |
| Calu-3 | ATCC or AddexBio | Cat#: HTB-55 or C0016001 |
| Caco-2 | a gift from D. Bailey | N/A |
| Experimental models: Organisms/strains | ||
| Oligonucleotides | ||
| GAPDH fw: 5’-ACATCGCTCAGACACCATG-3’ | Thorne et al, 2022 | N/A |
| GAPDH rv: 5’-TGTAGTTGAGGTCAATGAAGGG-3’ | Thorne et al, 2022 | N/A |
| IFNB fw: 5’-GCTTGGATTCCTACAAAGAAGCA-3’ | Thorne et al, 2022 | N/A |
| IFNB rv: 5’-ATAGATGGTCAATGCGGCGTC-3’ | Thorne et al, 2022 | N/A |
| CXCL10 fw: 5’-TGGCATTCAAGGAGTACCTC-3’ | Thorne et al, 2022 | N/A |
| CXCL10 rv: 5’-TTGTAGCAATGATCTCAACACG-3’ | Thorne et al, 2022 | N/A |
| IFIT1 fw: 5’-CCTCCTTGGGTTCGTCTACA-3’ | Thorne et al, 2022 | N/A |
| IFIT1 rv: 5’-GGCTGATATCTGGGTGCCTA-3’ | Thorne et al, 2022 | N/A |
| IFIT2 fw: 5′-CAGCTGAGAATTGCACTGCAA-3′ | Thorne et al, 2022 | N/A |
| IFIT2 rv: 5′-CGTAGGCTGCTCTCCAAGGA-3′. | Thorne et al, 2022 | N/A |
| SARS-CoV-2 E_Sarbeco_Fwd: 5’-ACAGGTACGTTAATAGTTAATAGCGT-3 | Thorne et al, 2022 | N/A |
| SARS-CoV-2 E_Sarbeco_Rev: 5′-ATATTGCAGCAGTACGCACACA-3’ | Thorne et al, 2022 | N/A |
| SARS-CoV-2 E_Sarbeco_Probe1: 5’-FAM-ACACTAGCCATCCTTACTGCGCTTCG-TAMRA-3’ | Thorne et al, 2022 | N/A |
| Recombinant DNA | ||
| SARS-CoV-2 VOC viral protein plasmids (Table S11) | This paper | N/A |
| Software and algorithms | ||
| Image Studio Lite Ver 5.2 | Li-Cor | N/A |
| GraphPad Prism 9 | GraphPad | https://www.graphpad.com/ |
| FlowJo v.10.6.2 | FlowJo LCC (BD) | https://www.flowjo.com |
| FIJI ImageJ software package | Schindelin et al. 2012 | |
| Other | ||
HIGHLIGHTS.
Systems analyses reveal the host selective forces that drive SARS-CoV-2 evolution.
Variants remodel viral protein levels, phosphorylation, and virus-host complexes.
Variants converge on innate immune suppression by modulating viral proteins.
Understanding innate/adaptive immune balance will aid future pandemic preparedness.
ACKNOWLEDGEMENTS
We thank Wendy Barclay (Imperial College London, UK), and Alex Sigal and Khadija Khan (Africa Health Research Institute, Durban, South Africa) for the generous gifts of VOC isolates. SARS-CoV-2 cross-reactive antibody was a gift from Laura McCoy (University College London, UK), and Caco-2 cells were a gift from D. Bailey. We thank Lars Plate and colleagues Katherine M Almasy and Jonathan P Davies (Vanderbilt University, Nashville, Tennessee) for the gift of plasmids expressing SARS-CoV-2 Nsp3 fragments. We thank Randy Albrecht for support with the BSL3 facility and procedures at the ISMMS as well as Richard Cadagan for excellent technical assistance. We are grateful to Tom Peacock at Imperial College London for helpful discussions. We also thank E. J. Louis, University of Leicester, for generously providing the TAR in yeast system which was used to generate the reverse genetics-derived viruses. This work was funded by National Institutes of Health grant U19AI171110 (NJK, ME), U19AI135990 (NJK), U19AI135972 (NJK, AG-S), R21AI159666 (JAD), U19AI142733, U54CA260560, 1R43AI165089-01 (LMS), 1R01AI161363-01 (LMS), 1R01AI161175-01A1 (LMS), and K99AI163868 (MB). Also by Defense Advanced Research Projects Agency (DARPA) Cooperative Agreement #HR0011-19-2-0020 (NJK, AG-S; The views, opinions, and/or findings contained in this material are those of the authors and should not be interpreted as representing the official views or policies of the Department of Defense or the U.S. Government). We acknowledge additional funding from the Laboratory for Genomics Research (LGR) Excellence in Research Award #133122P (NJK), F. Hoffmann-La Roche (NJK), Vir Biotechnology (NJK), Gifts from QCRG philanthropic donors (NJK), Pharmamar (AG-S, KW), CRIPT (Center for Research on Influenza Pathogenesis and Transmission), a NIAID funded Center of Excellence for Influenza Research and Response (CEIRR, contract # 75N93021C00014), the JPB and OPP foundations and an anonymous philanthropic donor to AG-S, Department of Defense W81XWH2110103 (LMS), Department of Defense W81XWH2110095 (LMS), National Institutes of Health contract number 75N93021C00014 (LMS), San Antonio Partnership for Precision Therapeutics (LMS), San Antonio Medical Foundation (LMS), Marie Skłodowska-Curie Individual Fellowships no. 896014. (RR), European Research Council (ERC-Stg no. 639429) (PB), The Rosetrees Trust (M362-F1; M553) (PB), NIHR GOSH BRC (PB), CF Trust (SRC006; SRC020) (PB), Wellcome Investigator Award 223065 (CJ), 220863 and Wellcome Collaborative Award 214344 (GJT), Wellcome Trust (206369/Z/17/Z) (MP), and MRC/UKRI G2P-UK National Virology consortium (MR/W005611/1) (GJT, CJ, MP, and AHP). RS and NKJ were partially supported by a QBI/UCSF-TAU joint grant in Computational Biology and Drug Discovery.
DECLARATION OF INTERESTS
The Krogan Laboratory received research support from Vir Biotechnology, F. Hoffmann-La Roche, and Rezo Therapeutics. Nevan Krogan has previously held financially compensated consulting agreements with the Icahn School of Medicine at Mount Sinai, New York and Twist Bioscience Corp. He currently has financially compensated consulting agreements with Maze Therapeutics, Interline Therapeutics, Rezo Therapeutics and GEn1E Lifesciences, Inc. He is on the Board of Directors of Rezo Therapeutics and is a shareholder in Tenaya Therapeutics, Maze Therapeutics, Rezo Therapeutics, and Interline Therapeutics. The A.G.-S. laboratory received research support from Pfizer, Senhwa Biosciences, Kenall Manufacturing, Blade Therapeutics, Avimex, Johnson & Johnson, Dynavax, 7Hills Pharma, PharmaMar, ImmunityBio, Accurius, Nanocomposix, Hexamer, N-fold LLC, Model Medicines, Atea Pharma, Applied Biological Laboratories and Merck. A.G.-S. has consulting agreements for the following companies involving cash and/or stock: Castlevax, Amovir, Vivaldi Biosciences, Contrafect, 7Hills Pharma, Avimex, Vaxalto, Pagoda, Accurius, Esperovax, Farmak, Applied Biological Laboratories, PharmaMar, Paratus, CureLab Oncology, CureLab Veterinary, Synairgen and Pfizer. A.G.-S. has been an invited speaker in meeting events organized by Seqirus, Janssen, Abbott and Astrazeneca. A.G.-S. is inventor on patents and patent applications on the use of antivirals and vaccines for the treatment and prevention of virus infections and cancer, owned by the Icahn School of Medicine at Mount Sinai, New York. MB is a financially compensated scientific advisor for GEn1E Lifesciences. C.Y. and L.M.-S are co-inventors on a patent application directed to reverse genetics approaches to generate recombinant SARS-CoV-2. The Regents of the University of California have patents issued and pending for CRISPR technologies on which J.A.D. is an inventor. J.A.D. is a co-founder of Caribou Biosciences, Editas Medicine, Scribe Therapeutics, Intellia Therapeutics, and Mammoth Biosciences. J.A.D. is a scientific advisory board member of Vertex, Caribou Biosciences, Intellia Therapeutics, Scribe Therapeutics, Mammoth Biosciences, Algen Biotechnologies, Felix Biosciences, The Column Group and Inari. J.A.D. is Chief Science Advisor to Sixth Street, a Director at Johnson & Johnson, Altos and Tempus, and has research projects sponsored by Apple Tree Partners and Roche. John Pham, Molly Lyons, Laura Donahue, Aliesha Griffin, Rebecca Nugent, Kevin Holden, and Robert Deans are employees and shareholders of Synthego Corporation. DLS has financially compensated consulting agreements with Maze Therapeutics and Rezo Therapeutics. PA, JAL, and JMJ are employees and shareholders of Pharma Mar, S.A (Madrid, Spain). JAL is a co-inventor of a patent for Plitidepsin (WO2008135793A1). JMJ holds stocks of Pangaea Oncology, has a non-remunerated role in the Scientific Advisory Board, and holds stocks of Promontory Therapeutics, and a co-inventor of two patents for Plitidepsin (WO99-42125).
Footnotes
Publisher's Disclaimer: This is a PDF file of an article that has undergone enhancements after acceptance, such as the addition of a cover page and metadata, and formatting for readability, but it is not yet the definitive version of record. This version will undergo additional copyediting, typesetting and review before it is published in its final form, but we are providing this version to give early visibility of the article. Please note that, during the production process, errors may be discovered which could affect the content, and all legal disclaimers that apply to the journal pertain.
REFERENCES
- 1.Planas D. et al. Considerable escape of SARS-CoV-2 Omicron to antibody neutralization. Nature 602, 671–675 (2022). [DOI] [PubMed] [Google Scholar]
- 2.Viana R. et al. Rapid epidemic expansion of the SARS-CoV-2 Omicron variant in southern Africa. Nature 603, 679–686 (2022). [DOI] [PMC free article] [PubMed] [Google Scholar]
- 3.Hoffmann M. et al. The Omicron variant is highly resistant against antibody-mediated neutralization: Implications for control of the COVID-19 pandemic. Cell 185, 447–456.e11 (2022). [DOI] [PMC free article] [PubMed] [Google Scholar]
- 4.Peacock TP et al. The altered entry pathway and antigenic distance of the SARS-CoV-2 Omicron variant map to separate domains of spike protein. Preprint at 10.1101/2021.12.31.474653. [DOI] [Google Scholar]
- 5.Tegally H. et al. Emergence of SARS-CoV-2 Omicron lineages BA.4 and BA.5 in South Africa. Nat. Med (2022) doi: 10.1038/s41591-022-01911-2. [DOI] [PMC free article] [PubMed] [Google Scholar]
- 6.Hachmann NP et al. Neutralization Escape by SARS-CoV-2 Omicron Subvariants BA.2.12.1, BA.4, and BA.5. N. Engl. J. Med 387, 86–88 (2022). [DOI] [PMC free article] [PubMed] [Google Scholar]
- 7.Thorne LG et al. Evolution of enhanced innate immune evasion by SARS-CoV-2. Nature 602, 487–495 (2022). [DOI] [PMC free article] [PubMed] [Google Scholar]
- 8.Banerjee AK et al. SARS-CoV-2 Disrupts Splicing, Translation, and Protein Trafficking to Suppress Host Defenses. Cell 183, 1325–1339.e21 (2020). [DOI] [PMC free article] [PubMed] [Google Scholar]
- 9.Thoms M. et al. Structural basis for translational shutdown and immune evasion by the Nsp1 protein of SARS-CoV-2. Science 369, 1249–1255 (2020). [DOI] [PMC free article] [PubMed] [Google Scholar]
- 10.Bouhaddou M. et al. The Global Phosphorylation Landscape of SARS-CoV-2 Infection. Cell 182, (2020). [DOI] [PMC free article] [PubMed] [Google Scholar]
- 11.Parker MD et al. Altered Subgenomic RNA Expression in SARS-CoV-2 B.1.1.7 Infections. bioRxiv 2021.03.02.433156 (2021) doi: 10.1101/2021.03.02.433156. [DOI] [Google Scholar]
- 12.Syed AM et al. Rapid assessment of SARS-CoV-2-evolved variants using virus-like particles. Science 374, 1626–1632 (2021). [DOI] [PMC free article] [PubMed] [Google Scholar]
- 13.Lu S. et al. The SARS-CoV-2 nucleocapsid phosphoprotein forms mutually exclusive condensates with RNA and the membrane-associated M protein. Nat. Commun 12, 502 (2021). [DOI] [PMC free article] [PubMed] [Google Scholar]
- 14.Syed AM et al. Omicron mutations enhance infectivity and reduce antibody neutralization of SARS-CoV-2 virus-like particles. Proc. Natl. Acad. Sci. U. S. A 119, e2200592119 (2022). [DOI] [PMC free article] [PubMed] [Google Scholar]
- 15.Carlson CR et al. Phosphoregulation of Phase Separation by the SARS-CoV-2 N Protein Suggests a Biophysical Basis for its Dual Functions. Mol. Cell 80, 1092–1103.e4 (2020). [DOI] [PMC free article] [PubMed] [Google Scholar]
- 16.Johnson BA et al. Nucleocapsid mutations in SARS-CoV-2 augment replication and pathogenesis. PLoS Pathog. 18, e1010627 (2022). [DOI] [PMC free article] [PubMed] [Google Scholar]
- 17.Yaron TM et al. Host protein kinases required for SARS-CoV-2 nucleocapsid phosphorylation and viral replication. Sci. Signal 15, eabm0808 (2022). [DOI] [PMC free article] [PubMed] [Google Scholar]
- 18.Wang C. et al. GPS 5.0: An Update on the Prediction of Kinase-specific Phosphorylation Sites in Proteins. Genomics Proteomics Bioinformatics 18, 72–80 (2020). [DOI] [PMC free article] [PubMed] [Google Scholar]
- 19.Gordon DE et al. A SARS-CoV-2 protein interaction map reveals targets for drug repurposing. Nature 583, (2020). [DOI] [PMC free article] [PubMed] [Google Scholar]
- 20.Gordon DE et al. Comparative host-coronavirus protein interaction networks reveal pan-viral disease mechanisms. Science 370, (2020). [DOI] [PMC free article] [PubMed] [Google Scholar]
- 21.Krogan NJ et al. RNA polymerase II elongation factors of Saccharomyces cerevisiae: a targeted proteomics approach. Mol. Cell. Biol 22, 6979–6992 (2002). [DOI] [PMC free article] [PubMed] [Google Scholar]
- 22.Zhu B. et al. The human PAF complex coordinates transcription with events downstream of RNA synthesis. Genes Dev. 19, 1668–1673 (2005). [DOI] [PMC free article] [PubMed] [Google Scholar]
- 23.Van Oss SB, Cucinotta CE & Arndt KM Emerging Insights into the Roles of the Paf1 Complex in Gene Regulation. Trends Biochem. Sci 42, 788–798 (2017). [DOI] [PMC free article] [PubMed] [Google Scholar]
- 24.Marazzi I. et al. Suppression of the antiviral response by an influenza histone mimic. Nature 483, 428–433 (2012). [DOI] [PMC free article] [PubMed] [Google Scholar]
- 25.Rodriguez-Boulan E. & Macara IG Organization and execution of the epithelial polarity programme. Nat. Rev. Mol. Cell Biol 15, 225–242 (2014). [DOI] [PMC free article] [PubMed] [Google Scholar]
- 26.Miorin L. et al. SARS-CoV-2 Orf6 hijacks Nup98 to block STAT nuclear import and antagonize interferon signaling. Proc. Natl. Acad. Sci. U. S. A 117, 28344–28354 (2020). [DOI] [PMC free article] [PubMed] [Google Scholar]
- 27.Szklarczyk D. et al. The STRING database in 2021: customizable protein–protein networks, and functional characterization of user-uploaded gene/measurement sets. Nucleic Acids Research vol. 49 D605–D612 Preprint at 10.1093/nar/gkaa1074 (2021). [DOI] [PMC free article] [PubMed] [Google Scholar]
- 28.Man K, Simons CT, Mohamed-Osman A, Travers SP & Zhao K. Chemosensory losses in past and active likely delta variant break-through COVID-19 cases. Med 3, 450–451 (2022). [DOI] [PMC free article] [PubMed] [Google Scholar]
- 29.Coelho DH, Reiter ER, French E. & Costanzo RM Decreasing Incidence of Chemosensory Changes by COVID-19 Variant. Otolaryngol. Head Neck Surg 168, 704–706 (2023). [DOI] [PMC free article] [PubMed] [Google Scholar]
- 30.White KM et al. Plitidepsin has potent preclinical efficacy against SARS-CoV-2 by targeting the host protein eEF1A. Science 371, (2021). [DOI] [PMC free article] [PubMed] [Google Scholar]
- 31.Varona JF et al. Preclinical and randomized phase I studies of plitidepsin in adults hospitalized with COVID-19. Life Sci Alliance 5, (2022). [DOI] [PMC free article] [PubMed] [Google Scholar]
- 32.Laing AG et al. A dynamic COVID-19 immune signature includes associations with poor prognosis. Nat. Med 26, 1623–1635 (2020). [DOI] [PubMed] [Google Scholar]
- 33.Hadjadj J. et al. Impaired type I interferon activity and inflammatory responses in severe COVID-19 patients. Science 369, 718–724 (2020). [DOI] [PMC free article] [PubMed] [Google Scholar]
- 34.Chen G. et al. Clinical and immunological features of severe and moderate coronavirus disease 2019. J. Clin. Invest 130, 2620–2629 (2020). [DOI] [PMC free article] [PubMed] [Google Scholar]
- 35.Abers MS et al. An immune-based biomarker signature is associated with mortality in COVID-19 patients. JCI Insight 6, (2021). [DOI] [PMC free article] [PubMed] [Google Scholar]
- 36.Del Valle DM et al. An inflammatory cytokine signature predicts COVID-19 severity and survival. Nat. Med 26, 1636–1643 (2020). [DOI] [PMC free article] [PubMed] [Google Scholar]
- 37.Lucas C. et al. Longitudinal analyses reveal immunological misfiring in severe COVID-19. Nature 584, 463–469 (2020). [DOI] [PMC free article] [PubMed] [Google Scholar]
- 38.Wang S. et al. Targeting liquid-liquid phase separation of SARS-CoV-2 nucleocapsid protein promotes innate antiviral immunity by elevating MAVS activity. Nat. Cell Biol 23, 718–732 (2021). [DOI] [PubMed] [Google Scholar]
- 39.Liu H. et al. SARS-CoV-2 N Protein Antagonizes Stress Granule Assembly and IFN Production by Interacting with G3BPs to Facilitate Viral Replication. J. Virol 96, e0041222 (2022). [DOI] [PMC free article] [PubMed] [Google Scholar]
- 40.Reuschl A-K et al. Enhanced innate immune suppression by SARS-CoV-2 Omicron subvariants BA.4 and BA.5. bioRxiv 2022.07.12.499603 (2022) doi: 10.1101/2022.07.12.499603. [DOI] [Google Scholar]
- 41.Nextstrain. https://nextstrain.org/. [Google Scholar]
- 42.Addetia A. et al. SARS-CoV-2 ORF6 Disrupts Bidirectional Nucleocytoplasmic Transport through Interactions with Rae1 and Nup98. MBio 12, (2021). [DOI] [PMC free article] [PubMed] [Google Scholar]
- 43.Li T. et al. Molecular Mechanism of SARS-CoVs Orf6 Targeting the Rae1-Nup98 Complex to Compete With mRNA Nuclear Export. Front Mol Biosci 8, 813248 (2021). [DOI] [PMC free article] [PubMed] [Google Scholar]
- 44.Huang X, Zheng W, Pearce R. & Zhang Y. SSIPe: accurately estimating protein-protein binding affinity change upon mutations using evolutionary profiles in combination with an optimized physical energy function. Bioinformatics 36, 2429–2437 (2020). [DOI] [PMC free article] [PubMed] [Google Scholar]
- 45.Tenthorey JL, Emerman M. & Malik HS Evolutionary Landscapes of Host-Virus Arms Races. Annu. Rev. Immunol 40, 271–294 (2022). [DOI] [PubMed] [Google Scholar]
- 46.Zuliani-Alvarez L. et al. Evasion of cGAS and TRIM5 defines pandemic HIV. Nat Microbiol 7, 1762–1776 (2022). [DOI] [PMC free article] [PubMed] [Google Scholar]
- 47.Hui KPY et al. SARS-CoV-2 Omicron variant replication in human bronchus and lung ex vivo. Nature 603, 715–720 (2022). [DOI] [PubMed] [Google Scholar]
- 48.Shuai H. et al. Attenuated replication and pathogenicity of SARS-CoV-2 B.1.1.529 Omicron. Nature 603, 693–699 (2022). [DOI] [PubMed] [Google Scholar]
- 49.Wei C. et al. Evidence for a mouse origin of the SARS-CoV-2 Omicron variant. J. Genet. Genomics 48, 1111–1121 (2021). [DOI] [PMC free article] [PubMed] [Google Scholar]
- 50.Mallapaty S. Where did Omicron come from? Three key theories. Nature 602, 26–28 (2022). [DOI] [PubMed] [Google Scholar]
- 51.Butt AA et al. Severity of Illness in Persons Infected With the SARS-CoV-2 Delta Variant vs Beta Variant in Qatar. JAMA Intern. Med 182, 197–205 (2022). [DOI] [PMC free article] [PubMed] [Google Scholar]
- 52.Twohig KA et al. Hospital admission and emergency care attendance risk for SARS-CoV-2 delta (B.1.617.2) compared with alpha (B.1.1.7) variants of concern: a cohort study. Lancet Infect. Dis 22, 35–42 (2022). [DOI] [PMC free article] [PubMed] [Google Scholar]
- 53.Ong SWX et al. Clinical and Virological Features of SARS-CoV-2 Variants of Concern: A Retrospective Cohort Study Comparing B.1.1.7 (Alpha), B.1.315 (Beta), and B.1.617.2 (Delta). SSRN Electronic Journal Preprint at 10.2139/ssrn.3861566. [DOI] [PMC free article] [PubMed] [Google Scholar]
- 54.Sigal A, Milo R. & Jassat W. Estimating disease severity of Omicron and Delta SARS-CoV-2 infections. Nat. Rev. Immunol 22, 267–269 (2022). [DOI] [PMC free article] [PubMed] [Google Scholar]
- 55.Abdullah F. et al. Decreased severity of disease during the first global omicron variant covid-19 outbreak in a large hospital in tshwane, south africa. International Journal of Infectious Diseases vol. 116 38–42 Preprint at 10.1016/j.ijid.2021.12.357 (2022). [DOI] [PMC free article] [PubMed] [Google Scholar]
- 56.Veneti L. et al. Reduced risk of hospitalisation among reported COVID-19 cases infected with the SARS-CoV-2 Omicron BA.1 variant compared with the Delta variant, Norway, December 2021 to January 2022. Euro Surveill. 27, (2022). [DOI] [PMC free article] [PubMed] [Google Scholar]
- 57.Nyberg T. et al. Comparative Analysis of the Risks of Hospitalisation and Death Associated with SARS-CoV-2 Omicron (B.1.1.529) and Delta (B.1.617.2) Variants in England. SSRN Electronic Journal Preprint at 10.2139/ssrn.4025932. [DOI] [PMC free article] [PubMed] [Google Scholar]
- 58.Sievers C. et al. SARS-CoV-2 Omicron variants BA.1 and BA.2 both show similarly reduced disease severity of COVID-19 compared to Delta, Germany, 2021 to 2022. Euro Surveill. 27, (2022). [DOI] [PMC free article] [PubMed] [Google Scholar]
- 59.Kislaya I. et al. SARS-CoV-2 BA.5 vaccine breakthrough risk and severity compared with BA.2: a case-case and cohort study using Electronic Health Records in Portugal. medRxiv 2022.07.25.22277996 (2022) doi: 10.1101/2022.07.25.22277996. [DOI] [Google Scholar]
- 60.Mautner L. et al. Replication kinetics and infectivity of SARS-CoV-2 variants of concern in common cell culture models. Virol. J 19, 76 (2022). [DOI] [PMC free article] [PubMed] [Google Scholar]
- 61.Pires De Souza GA et al. Choosing a cellular model to study SARS-CoV-2. Front. Cell. Infect. Microbiol 12, 1003608 (2022). [DOI] [PMC free article] [PubMed] [Google Scholar]
- 62.Stolp B. et al. SARS-CoV-2 variants of concern display enhanced intrinsic pathogenic properties and expanded organ tropism in mouse models. Cell Rep. 38, 110387 (2022). [DOI] [PMC free article] [PubMed] [Google Scholar]
- 63.Giurgiu M. et al. CORUM: the comprehensive resource of mammalian protein complexes-2019. Nucleic Acids Res. 47, D559–D563 (2019). [DOI] [PMC free article] [PubMed] [Google Scholar]
- 64.Waterhouse A. et al. SWISS-MODEL: homology modelling of protein structures and complexes. Nucleic Acids Res. 46, W296–W303 (2018). [DOI] [PMC free article] [PubMed] [Google Scholar]
- 65.Perez-Riverol Y. et al. The PRIDE database resources in 2022: a hub for mass spectrometry-based proteomics evidences. Nucleic Acids Res. 50, D543–D552 (2022). [DOI] [PMC free article] [PubMed] [Google Scholar]
- 66.Barrett T. et al. NCBI GEO: archive for functional genomics data sets--update. Nucleic Acids Res. 41, D991–5 (2013). [DOI] [PMC free article] [PubMed] [Google Scholar]
- 67.Miorin L. et al. The oral drug nitazoxanide restricts SARS-CoV-2 infection and attenuates disease pathogenesis in Syrian hamsters. bioRxiv 2022.02.08.479634 (2022) doi: 10.1101/2022.02.08.479634. [DOI] [Google Scholar]
- 68.Thorne LG et al. SARS-CoV-2 sensing by RIG-I and MDA5 links epithelial infection to macrophage inflammation. EMBO J. 40, e107826 (2021). [DOI] [PMC free article] [PubMed] [Google Scholar]
- 69.Zhou J. et al. Mutations that adapt SARS-CoV-2 to mink or ferret do not increase fitness in the human airway. Cell Reports vol. 38 110344 Preprint at 10.1016/j.celrep.2022.110344 (2022). [DOI] [PMC free article] [PubMed] [Google Scholar]
- 70.Thi Nhu Thao T. et al. Rapid reconstruction of SARS-CoV-2 using a synthetic genomics platform. Nature 582, 561–565 (2020). [DOI] [PubMed] [Google Scholar]
- 71.Pattabirama C. et al. Genomic epidemiology reveals multiple introductions and spread of SARS-CoV-2 in the Indian state of Karnataka. Preprint at 10.1101/2020.07.10.20150045. [DOI] [PMC free article] [PubMed] [Google Scholar]
- 72.Ye C. et al. Rescue of SARS-CoV-2 from a Single Bacterial Artificial Chromosome. MBio 11, (2020). [DOI] [PMC free article] [PubMed] [Google Scholar]
- 73.Amanat F. et al. An In Vitro Microneutralization Assay for SARS‐CoV‐2 Serology and Drug Screening. Current Protocols in Microbiology vol. 58 Preprint at 10.1002/cpmc.108 (2020). [DOI] [PMC free article] [PubMed] [Google Scholar]
- 74.Schindelin J. et al. Fiji: an open-source platform for biological-image analysis. Nat. Methods 9, 676–682 (2012). [DOI] [PMC free article] [PubMed] [Google Scholar]
- 75.Almasy KM, Davies JP & Plate L. Comparative Host Interactomes of the SARS-CoV-2 Nonstructural Protein 3 and Human Coronavirus Homologs. Mol. Cell. Proteomics 20, 100120 (2021). [DOI] [PMC free article] [PubMed] [Google Scholar]
- 76.Kim D, Paggi JM, Park C, Bennett C. & Salzberg SL Graph-based genome alignment and genotyping with HISAT2 and HISAT-genotype. Nat. Biotechnol 37, 907–915 (2019). [DOI] [PMC free article] [PubMed] [Google Scholar]
- 77.Kovaka S. et al. Transcriptome assembly from long-read RNA-seq alignments with StringTie2. Genome Biol. 20, 278 (2019). [DOI] [PMC free article] [PubMed] [Google Scholar]
- 78.Love MI, Huber W. & Anders S. Moderated estimation of fold change and dispersion for RNA-seq data with DESeq2. Genome Biol. 15, 550 (2014). [DOI] [PMC free article] [PubMed] [Google Scholar]
- 79.Bankevich A. et al. SPAdes: a new genome assembly algorithm and its applications to single-cell sequencing. J. Comput. Biol 19, 455–477 (2012). [DOI] [PMC free article] [PubMed] [Google Scholar]
- 80.Consortium UniProt. UniProt: the universal protein knowledgebase in 2021. Nucleic Acids Res. 49, D480–D489 (2021). [DOI] [PMC free article] [PubMed] [Google Scholar]
- 81.Steinegger M. & Söding J. MMseqs2 enables sensitive protein sequence searching for the analysis of massive data sets. Nat. Biotechnol 35, 1026–1028 (2017). [DOI] [PubMed] [Google Scholar]
- 82.Bienert S. et al. The SWISS-MODEL Repository-new features and functionality. Nucleic Acids Res. 45, D313–D319 (2017). [DOI] [PMC free article] [PubMed] [Google Scholar]
- 83.Benkert P, Biasini M. & Schwede T. Toward the estimation of the absolute quality of individual protein structure models. Bioinformatics 27, 343–350 (2011). [DOI] [PMC free article] [PubMed] [Google Scholar]
- 84.Köster J. & Rahmann S. Snakemake--a scalable bioinformatics workflow engine. Bioinformatics 28, 2520–2522 (2012). [DOI] [PubMed] [Google Scholar]
- 85.Dunham A, Jang GM, Muralidharan M, Swaney D. & Beltrao P. A missense variant effect prediction and annotation resource for SARS-CoV-2. bioRxiv 2021.02.24.432721 (2021) doi: 10.1101/2021.02.24.432721. [DOI] [Google Scholar]
- 86.Cox J. & Mann M. MaxQuant enables high peptide identification rates, individualized p.p.b.-range mass accuracies and proteome-wide protein quantification. Nature Biotechnology vol. 26 1367–1372 Preprint at 10.1038/nbt.1511 (2008). [DOI] [PubMed] [Google Scholar]
- 87.Cox J. et al. Accurate proteome-wide label-free quantification by delayed normalization and maximal peptide ratio extraction, termed MaxLFQ. Mol. Cell. Proteomics 13, 2513–2526 (2014). [DOI] [PMC free article] [PubMed] [Google Scholar]
- 88.Teo G. et al. SAINTexpress: improvements and additional features in Significance Analysis of INTeractome software. J. Proteomics 100, 37–43 (2014). [DOI] [PMC free article] [PubMed] [Google Scholar]
- 89.Jäger S. et al. Global landscape of HIV-human protein complexes. Nature 481, 365–370 (2011). [DOI] [PMC free article] [PubMed] [Google Scholar]
- 90.Verschueren E. et al. Scoring Large-Scale Affinity Purification Mass Spectrometry Datasets with MiST. Curr. Protoc. Bioinformatics 49, 8.19.1–8.19.16 (2015). [DOI] [PMC free article] [PubMed] [Google Scholar]
- 91.Choi M. et al. MSstats: an R package for statistical analysis of quantitative mass spectrometry-based proteomic experiments. Bioinformatics vol. 30 2524–2526 Preprint at 10.1093/bioinformatics/btu305 (2014). [DOI] [PubMed] [Google Scholar]
- 92.Shannon P. et al. Cytoscape: a software environment for integrated models of biomolecular interaction networks. Genome Res. 13, 2498–2504 (2003). [DOI] [PMC free article] [PubMed] [Google Scholar]
- 93.Wu T. et al. clusterProfiler 4.0: A universal enrichment tool for interpreting omics data. The Innovation vol. 2 100141 Preprint at 10.1016/j.xinn.2021.100141 (2021). [DOI] [PMC free article] [PubMed] [Google Scholar]
- 94.Ochoa D. et al. The functional landscape of the human phosphoproteome. Nat. Biotechnol 38, 365–373 (2019). [DOI] [PMC free article] [PubMed] [Google Scholar]
- 95.Cao M. et al. Going the Distance for Protein Function Prediction: A New Distance Metric for Protein Interaction Networks. PLoS One 8, e76339 (2013). [DOI] [PMC free article] [PubMed] [Google Scholar]
- 96.Choobdar S. et al. Assessment of network module identification across complex diseases. Nat. Methods 16, 843–852 (2019). [DOI] [PMC free article] [PubMed] [Google Scholar]
- 97.Szklarczyk D. et al. STRING v11: protein-protein association networks with increased coverage, supporting functional discovery in genome-wide experimental datasets. Nucleic Acids Res. 47, D607–D613 (2019). [DOI] [PMC free article] [PubMed] [Google Scholar]
- 98.Cowen L, Ideker T, Raphael BJ & Sharan R. Network propagation: a universal amplifier of genetic associations. Nat. Rev. Genet 18, 551–562 (2017). [DOI] [PubMed] [Google Scholar]
Associated Data
This section collects any data citations, data availability statements, or supplementary materials included in this article.
Supplementary Materials
Supplementary Figure 1. Primary cell infections and proteomics quality control for Calu-3 cells, related to Figure 1. (A-C) Primary human airway epithelial (HAE) cells infected with 1500 E copies per cell of indicated VOCs. (A) Apical release of virus measured over time or (B) intracellular E levels at 72 hours post infection (hpi; n=5–7). (C) Apical release over time for Alpha, Delta and two independent Omicron BA.1 isolates. For D and E, VOCs were compared to IC19 by Mann-Whitney test at each time point. (D) Number of unique peptides (intensity > 2E5) detected in each sample from data independent acquisition (DIA) mass spectrometry abundance proteomics analysis of Calu-3 cells at 10 and 24 hpi for experiment 1 (left) and 2 (right). (E) Number of unique proteins mapping to peptides in (A). (F) Number of unique phosphorylated (PH) peptides (intensity > 2E5) detected in each sample from DIA mass spectrometry phosphoproteomics analysis of Calu-3 cells at 10 and 24 hpi for experiment 1 (left) and 2 (right). (G) Fraction of peptides with a phosphate modification in phospho-enriched samples, corresponding to peptides from (F). (H) Number of unique phosphorylated (PH) proteins mapping to peptides in (F). (I) Pairwise correlation of peptide intensities within condition (black) and between conditions (gray) for abundance proteomics (left) and phosphoproteomics (right) analysis in experiments 1 and 2. (J) Principal components analysis (PCA) of peptide intensities (protein abundance and phosphorylation, left and middle) or transcript counts (RNA, right) for virus infections in Calu-3 cells at 10 and 24 hpi. Experiment number is annotated by shape and time point by shape size. The percent of explained variance is indicated in parentheses for each principal component. Although the second principal component often separates according to the experiment, the rank ordering of the same viruses across different experiments is well preserved along the first principal component, which explains the greatest variance in the data.
Supplementary Figure 2. Viral RNA and protein expression, reverse genetics, and virus-like particles, related to Figure 2. (A) Western blot of Calu-3 cells infected with 2000 E copies per cell of VIC, IC19, Alpha, Beta, Gamma, Delta and Omicron BA.1 at 24 hours post infection (hpi). Of note, the lack of Orf9b detection in the Omicron infection samples may be due to mutations in Omicron Orf9b affecting the epitope for the antibody. (B) Correlation between viral RNA and protein expression for each virus relative to VIC. Dashed line indicates x=y line. (C) Percentage of RNA reads mapping to each SARS-CoV-2 viral gene. Genomic refers to reads mapping to Orf1a. Bold indicates N*. (D) Expression of viral RNA (left) and protein (right) at 48 hpi in Calu-3 cells infected with an wave 1 SARS-CoV-2 (W1), one mutant with a D3L change in N (GAU→CUA), one mutant with a deletion at the −3 position upstream from the translation start site for N, and one with both mutations, created using reverse genetics approaches. Quantifications are normalized to genomic (leader + orf1a) counts or sum of Nsps per virus to control for differences in viral replication and defined relative to wildtype virus (log2(counts/genomic/W1)). Statistical significance testing is performed using a two-tailed t-test assuming unequal variance. *, p<0.05; **, p<0.01; ***, p<0.001. ns=not significant. (E) Expression of viral RNA from bulk mRNA sequencing at 24 hpi for Alpha, a Wuhan early-lineage control, and two attempts at creating R203K/G204R mutants within the Wuhan background (mutant 1 and 2). All TMP counts are normalized to genomic (leader + orf1a) per virus to account for differences in viral replication. (F) Expression of SARS-CoV-2 N* (N-star) subgenomic RNA from bulk mRNA sequencing at 24 hpi in Calu-3 cells for all viruses in experiments 1 and 2. N* is a viral protein encoded within, and in-frame with, the N protein sequence, containing the C-terminal part of N from amino acid position 210 to the end of N. (G) Genomic sequence of viruses under study, highlighting the region surrounding the translation start site of N*. Mutations within the N* TRS in Alpha, Gamma, and Omicron (corresponding to the R203K/G204R mutations in N) are predicted to enhance the N* TRS leading to increased N* sgRNA production. (H) Expression of viral subgenomic RNA from bulk mRNA sequencing at 24 hpi in Calu-3 cells with an early-lineage SARS-CoV-2 (W1) from Wuhan and two individual attempts at constructing a virus with a GGG→AAC mutation (corresponding to the R203K/G204R in N), created using reverse genetics approaches. Quantifications are normalized to genomic (leader + Orf1a) counts per virus to control for differences in viral replication and defined relative to the average of wave 1, mutant 1, and mutant 2 (counts/mean(counts)) per viral gene. It was not possible to normalize or statistically compare to wildtype because zero N* counts were detected in the wildtype condition (n.d.). (I) Cartoon depiction of virus-like particle (VLP) system 12. Plasmids encoding SARS-CoV-2 structural proteins and luciferase are transfected into HEK293T, which produce virus particles containing the luciferase RNA as a genome. These VLPs were collected from the supernatant and administered to fresh HEK293T cells expressing ACE2 and TMPRSS2 from which the production of luciferase luminescence is quantified. (J) Results from VLP experiment described in (I). N proteins encoding mutations from Alpha, Gamma, and Omicron or N* were transfected alongside W1 forms of the other structural proteins (S, E, and M) and the resulting luminescence quantified. Interestingly, N* alone (no full length N) is able to package RNA and produce VLPs. All error bars in this figure represent the standard error (SE). </p/>(K) Results from VLP experiment described in (I). N proteins encoding mutations from each VOC were transfected alongside W1 forms of the other structural proteins (S, E, and M) and the resulting luminescence of VLP infection quantified. Error bars depict standard error (SE) of 4 biological replicates.
Supplementary Figure 3. Virus-host phosphorylation and protein-protein interactions, related to Figures 2 and 3. (A) Global phosphoproteomics map of viral protein phosphorylation sites detected during infection with at least one virus at any time point (Alpha, Beta, Gamma, Delta, Omicron BA.1, VIC, or IC19) in Calu-3 cells (black lollipops). Colors delineate known protein domains.(B) Heatmap of significantly changed phosphorylated peptides mapping to N protein at 24hpi. Rows indicate the comparison (first virus is numerator, second is denominator) and columns indicate the phosphorylated peptides. Color represents the t-statistic and black bounding boxes indicate if p≤0.001. Gray boxes indicate peptides that were either not detected in one or both viruses or did not possess identical sequences between viruses. (C) Left: Density distribution of naccess surface accessibility calculations for mutations within the VOCs (colored lines) compared to all possible mutations (background, gray shaded region). Only viral proteins with solved structures were included. Shift to the right indicates increased surface accessibility for mutations in VOCs compared to the background. Right: Distribution of FoldX ΔΔG predictions for mutations in SARS-CoV-2 variants of concern (VOCs) compared to the background distribution of all possible mutations. Interpretation is that VOC mutations are generally less structurally destabilizing and more evolutionarily tolerated than background. FoldX was run based on the highest quality structure available in the SARS-CoV-2 SWISS-model repository 64 containing 19 of the 28 viral proteins.(D) Jitter plot showing log2 fold changes (log2FC) of interactions conserved (gray) between VOC and W1, increased in binding to mutant (red) and decreased in binding to mutant (blue), for each viral “bait” protein. Positive and negative infinity log2FC values indicate interactions detected in mutant or W1 only, respectively. Significant increase in mutant binding affinity (red) is defined as log2 fold-change>0.5 & p<0.05. Significant decrease in mutant binding affinity (blue) is defined as log2 fold-change<−0.5 & p<0.05. Right, same but broken down by VOC. (E) Affinity purification western blot of strep-tagged VOC N or N*, blotting for endogenous PAF complex members: LEO1, WDR61, PAF1, and CTR9. This confirms APMS results showing N* specific interaction with the human PAF complex. (F) Affinity purification western blot of strep-tagged Orf9b (coding changes from Omicron (P10S and ENAdel) and Delta (T60A)) and flag-tagged MARK2 to confirm the enhanced interaction between Delta orf9b and MARK2 observed by APMS.
Supplementary Figure 4. Heatmap of affinity purification mass spectrometry data, related to Figure 3. Each block represents a single annotated viral protein. Black lines denote viral bait proteins that are complete with all consensus mutations present in each variant of concern (“complete VOC construct”). If multiple mutations exist in a single VOC protein, all are combined together in the same construct. Purple lines depict other constructs possessing individual mutations or other combinations of mutations to assess the impact of single mutations on protein interactions (“non-complete or individual mutations”). Color indicates the log2 fold change of the abundance of each prey protein in the affinity purification between the mutant and W1 form. Red indicates increased binding to mutant and blue indicates decreased binding to mutant. Black bounding boxes indicate a significant differential interaction (p<0.05). White-dashed boxes indicate a prey detected in only the mutant (red) or W1 (blue). To simplify the diagram, only human prey proteins that were significantly differentially interacting (abs(log2FC)>0.5 & p<0.05) for one of the “complete variant constructs” are visualized for the remaining constructs. See Table S3 for the complete list of interactions.
Supplementary Figure 5. Functional interrogation of host pathways hijacked by VOCs, related to Figure 4. (A) Network propagation analysis of multiomics datasets as done for integrative computational analysis to confirm findings using an orthogonal approach (see Methods). (B) Variant-specific analysis. We calculated the residual for each variant from the x=y line in a plot of AHR versus each module abs(log2FC). Modules with between 1 and 3 variants (but not more) with residuals > 0.5 were retained and visualized in a heatmap. Colors correspond to residuals. Black boxes indicate if residual > 0.5. (C) Translation related modules within the top 10 most correlated with the AHR. Scatter plot, linear regression lines, and Pearson’s R correlation coefficients are shown for each module from the RNA dataset. (D) Experimental workflow for in vivo pharmacological study. K19-ACE2 mice were treated with a VOC, wave 1 control (Washington strain or WA), or vehicle (PBS) on day 0 and dosed with 0.3mg/kg plitidepsin once a day for three days. Mouse lungs were harvested on the fourth day and viral titers were assessed by TCID50. Five mice were included per group. Mice with low infection were excluded from subsequent analyses. (E) Comparison of viral titers (log10 TCID50/mL) in K18-ACE2 mice from each virus, comparing plitidepsin treatment to vehicle. Statistical significance was determined using a two-tailed t-test, p values are annotated. Error bars represent the standard error (SE). Pairwise comparisons against Mock at each time point were performed using Mann-Whitney test. (F) Replication of indicated isolates measured by E copies (top) or N-expression (bottom) in Calu-3 cells (n=3). (G-H) Expression of IFNβ (G) or CXCL10 (H) in infected Calu-3 cells at 24 hours post infection (hpi) for RNA (left) and protein (right) (n=3). (I) Viral replication and expression of IFNB or IFIT1 of 3 independent Omicron BA.1 isolates in comparison to VIC, IC19, Alpha and Delta are shown at 24hpi (n=3). (J) Nuclear-to-cytoplasmic IRF3 ratio measured by single-cell immunofluorescence at 24 hpi in Nucleocapsid positive Calu-3 cells infected at 2000 E copies per cell. Per condition, 1500 randomly sampled cells are shown. For (F)-(J), pairwise comparisons were performed using One-Way ANOVA. (K) Nuclear-to-cytoplasmic IRF3 ratio measured by single-cell immunofluorescence measured in Nucleocapsid positive or negative cells. Stars indicate significance relative to Mock using One-Way ANOVA. (L) Western blot for Orf9b expression levels in Calu-3 cells infected with Alpha wild-type (WT) or Alpha Orf9b knock-out (ΔOrf9b) at 24hpi. (M) Replication and IFNB or IFIT2 expression over time in Calu-3 cells infected with Alpha WT or Alpha ΔOrf9b (n=3). (N) Replication of Alpha WT or Alpha ΔOrf9b reverse genetics mutant virus in primary human airway epithelial (HAE) cells over time in the absence (left) or presence (right) of ruxolitinib (Rux) (n=3). For (M)-(N), pairwise statistical comparison at each timepoint was performed using One-Way ANOVA. </p/>p<0.5, *; p<0.01, **; p<0.001, ***; p<0.0001, ****. Significance is indicated by *. ns=not significant.
Supplementary Figure 6. Heatmaps of inflammatory gene expression during VOC infection, related to Figures 4 and 5. (A) Heatmap of interferon stimulated genes (ISGs) and pro-inflammatory genes (RNA) for experiment 1 (top) and 2 (bottom). Color indicates the log2 fold change in expression relative to VIC. (B) Same as in (A) but for the Omicron subvariant experiment (RNA). (C) Same as in (A) but for protein. Only ISGs are included because pro-inflammatory genes were sparsely detected at the protein level, perhaps because they are typically excreted from the cell. (D) Same as in (B) but for protein. Only ISGs are included because pro-inflammatory genes were sparsely detected.
Supplementary Figure 7. Inflammatory response and viral gene expression for Omicron subvariants and Orf6 knock-out virus, related to Figure 5. (A) RNA expression of interferon stimulated genes (ISG; left) and pro-inflammatory genes (right) at 48 hours post infection (hpi) for all viruses used in the Omicron subvariant experiment (Alpha, Delta, IC19, BA.1, BA.2, BA.4, and BA.5). Values are the average log2 fold change in expression relative to VIC. (B) Relationship between ISG and pro-inflammatory gene expression across all viruses listed in (A). (C) Viral RNA expression for viruses listed in (A) at 24 hpi. Quantity on the x-axis is the log2 of RNA counts normalized to genomic (Orf1a + leader) counts, then normalized to IC19. (D) Same as in (C) but at 48 hpi. (E) Same as in (C) but for viral protein. Quantity on the x-axis is the log2 of protein intensity normalized to the sum of non-structural protein intensities, then normalized to IC19. (F) Pro-inflammatory gene regulation by Alpha, Omicron BA.1, an Orf6 knock-out (KO) virus in the Alpha background generated using reverse genetics, and poly I:C, compared to VIC. All error bars in this figure represent the standard error (SE).
Table S1. Consensus mutations in the VOCs from CoVariants.org, related to Figure 1.
Table S2. Viral RNA, protein, and phosphorylation site abundances during infection, including analysis comparing viral phosphorylated peptide intensities across VOCs, related to Figures 2 and 5.
Table S3. Affinity purification mass spectrometry (APMS) metadata and results, related to Figure 3.
Table S4. Integrative computational analysis metadata and results, related to Figure 4.
Data Availability Statement
Further information and requests for resources and reagents should be directed to and will be fulfilled by NJK (nevan.krogan@ucsf.edu). The raw mass spectrometry proteomics infection proteomics and affinity purification mass spectrometry (APMS) data files have been deposited to the ProteomeXchange Consortium (http://proteomecentral.proteomexchange.org) via the PRIDE partner repository 65 with the dataset identifiers PXD036968 and PXD036798, respectively. All raw mRNA sequencing data files have been deposited in NCBI’s Gene Expression Omnibus 66 and are accessible through GEO Series accession number GSE213759. RNA, peptide, and protein counts, as well as quantitative statistical data, can be accessed via Mendeley Data (doi: 10.17632/prs6zjts7b.1). All other data are available in the main text or the supplementary materials.