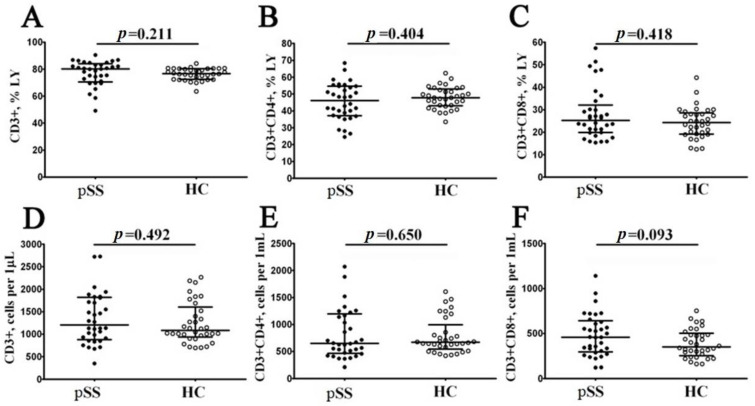
Figure 1.
Comparison of relative numbers and concentrations of the main circulating T cell subsets in patients with pSS. The scatter plots (A–C) and (D–F) illustrate the percentages (proportion of T cell subset within the total lymphocyte subset) and absolute numbers (count of cells per 1 μL of total peripheral blood) of T cells (CD3+), T-helper cells (Th, CD3+CD4+) and CD8+ T cells (Tcyt, CD3+CD8+), respectively. Patients with Sjögren’s syndrome are represented by black circles (pSS, n = 34), while white circles denote healthy controls (HC, n = 34). Each data point corresponds to an individual subject, and horizontal bars depict the group medians and interquartile ranges (median (Q25; Q75)). Statistical analysis was performed using the Mann–Whitney U test.

