Abstract
Background and Objectives
Mortality rates for neurologic diseases are increasing in the United States, with large disparities across geographical areas and populations. Racial and ethnic populations, notably the non-Hispanic (NH) Black population, experience higher mortality rates for many causes of death, but the magnitude of the disparities for neurologic diseases is unclear. The objectives of this study were to calculate mortality rates for neurologic diseases by race and ethnicity and—to place this disparity in perspective—to estimate how many US deaths would have been averted in the past decade if the NH Black population experienced the same mortality rates as other groups.
Methods
Mortality rates for deaths attributed to neurologic diseases, as defined by the International Classification of Diseases, were calculated for 2010 to 2019 using death and population data obtained from the Centers for Disease Control and Prevention and the US Census Bureau. Avertable deaths were calculated by indirect standardization: For each calendar year of the decade, age-specific death rates of NH White persons in 10 age groups were multiplied by the NH Black population in each age group. A secondary analysis used Hispanic and NH Asian populations as the reference groups.
Results
In 2013, overall age-adjusted mortality rates for neurologic diseases began increasing, with the NH Black population experiencing higher rates than NH White, NH American Indian and Alaska Native, Hispanic, and NH Asian populations (in decreasing order). Other populations with higher mortality rates for neurologic diseases included older adults, the male population, and adults older than 25 years without a high school diploma. The gap in mortality rates for neurologic diseases between the NH Black and NH White populations widened from 4.2 individuals per 100,000 in 2011 to 7.0 per 100,000 in 2019. Over 2010 to 2019, had the NH Black population experienced the neurologic mortality rates of NH White, Hispanic, or NH Asian populations, 29,986, 88,407, or 117,519 deaths, respectively, would have been averted.
Discussion
Death rates for neurologic diseases are increasing. Disproportionately higher neurologic mortality rates in the NH Black population are responsible for a large number of excess deaths, making research and policy efforts to address the systemic causes increasingly urgent.
Introduction
Mortality from neurologic diseases is increasing in the United States1 and other industrialized countries,2,3 largely because of progress in reducing death rates from other diseases (e.g., heart disease) and the aging of the population but also for reasons that remain unexplained. For example, mortality is increasing among young and middle-aged adults (ages 25–64 years) for neurologic diseases in general and for specific causes such as Alzheimer disease, epilepsy, inflammatory diseases, and cerebral palsy.4,5 As is true for a wide variety of chronic conditions, the risk and acuity of neurologic diseases, and resulting mortality rates, differ significantly across geographic regions and population groups, based on age, sex, socioeconomic status, disability, and LGBTQ populations, among other factors.6-8
According to Healthy People 2030, health equity is achieved when all people in a society have reached their full potential for health and well-being across the lifespan.9 For generations, racial and ethnic groups in the United States that have been victims of multigenerational discrimination—notably Black, Indigenous, and other people of color—have experienced shorter life expectancy and higher cause-specific mortality rates,10 and neurologic diseases are no exception. However, although the existence of racial inequities in neurologic diseases is widely accepted, the magnitude of the excess loss of life is often underappreciated. Although studies have estimated the number of avertable deaths caused by disparities in all-cause mortality among Black and White Americans,11,12 no study was identified that performed a similar analysis for neurologic diseases in particular.
As neurologic diseases ascend in importance as a leading cause of death and public health threat, and as the goal of health equity becomes a larger priority, quantifying the impact of disparities in neurologic diseases grows increasingly important. The following study was conducted under the auspices of the Working Group for Health Disparities and Inequities in Neurological Disorders, convened by the National Institute of Neurological Disorders and Stroke, National Advisory Council to advise the institute during its health equity strategic planning process. The study was designed to address the following research question: How many US deaths from neurologic diseases would have been averted in the past decade had non-Hispanic (NH) Black Americans experienced the same mortality rates as the NH White population?
Methods
Data Sources
Death counts for the most recent decade (2010–2019) were obtained from multiple cause-of-death mortality files, obtained from the Centers for Disease Control and Prevention (CDC) National Center for Health Statistics (NCHS).13 Population estimates were obtained from the CDC WONDER online database14 and the US Census Bureau's American Community Survey for 2017–2019.15
Informed consent for the study was not required because human subjects were not involved.
Cause-of-Death Classifications
Neurologic diseases were classified according to the International Classification of Diseases, Tenth Revision, Clinical Modification (ICD-10-CM),16 using ICD-10 codes that aligned closely with categories defined by the National Institutes of Health Research, Condition, and Disease Categorization (RCDC) system.17 Using a process of expert review and adjudication, the authors subdivided the RCDC list into 2 groups: (1) neurologic diseases and (2) diseases with potential neurologic manifestations (PNM). PNM diseases included conditions that are capable of producing potentially fatal neurologic complications (e.g., hypertensive heart disease, human immunodeficiency virus disease) but do not inherently involve neurologic manifestations. eAppendix 1 (links.lww.com/WNL/C925) lists the ICD-10 codes for neurologic and PNM diseases.
Data Analysis
Cause-Specific Mortality Rates
Age-adjusted mortality rates for deaths from all neurologic diseases were calculated by year for the decade spanning 2010 to 2019. To achieve statistical stability, pooled data for the most recent 3 years (2017–2019) were used to compute (1) age-specific mortality rates from all neurologic diseases combined and (2) age-adjusted mortality rates for all neurologic diseases combined and specific neurologic and PNM diseases by race/ethnicity, sex, and educational attainment (a marker for socioeconomic status). Racial-ethnic groups included Hispanic and NH Asian (including Asian, Native Hawaiian, and other Pacific Islander), American Indian and Alaska Native, Black, and White populations. Age adjustment was performed by direct standardization, using the 2000 standard US population.18 The standard error (i.e., 1.96 ×  ) was used to determine the upper and lower bounds of the 95% confidence interval.19 All mortality rates are expressed as deaths per 100,000 population.
Avertable Deaths
Indirect standardization of mortality rates was performed in accordance with previously published methods,11 using the NH White population as the reference population and mortality rates for neurologic diseases (not including PNM diseases). For each calendar year during 2010 to 2019, the age-specific mortality rates of NH White patients in 10 age groups (0–4 years, 10-year age groups between 5 and 84 years, and 85 years and older) were multiplied by the the NH Black population in the corresponding age groups. A hypothetical crude, race-specific mortality rate (approximating conditions had the NH Black population experienced the age-specific death rates of the NH White population) was derived by dividing the total number of calculated deaths, summed across the age groups, by the NH Black population. This hypothetical rate was subtracted from the actual NH Black crude mortality rate and multiplied by the total NH Black population to estimate the number of avertable deaths in that calendar year. The total deaths for each calendar year were summed to derive the number of NH Black deaths that could have been averted over the decade.
As part of a data exploration exercise, the same method was used to calculate avertable deaths, using Hispanic and NH Asian populations as the reference group.
Results
Demographic Disparities in Neurologic Mortality Rates
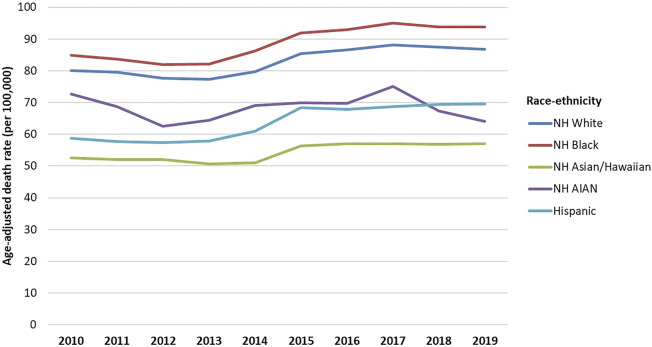
After a preceding decade of declining mortality rates, age-adjusted mortality rates for neurologic diseases began increasing in the United States after 2013, with a pronounced increase occurring between 2013 and 2015 (Figure 1). The NH Black population consistently experienced higher mortality rates from neurologic diseases than did the NH White population, and both groups experienced higher rates than NH American Indian and Alaska Native, Hispanic, and NH Asian populations. The Black-White gap in neurologic mortality rates reached its nadir in 2011 (a difference in mortality rates of 4.2 individuals per 100,000) but increased thereafter, widening to 7.0 per 100,00 in 2019.
Figure 1. Age-Adjusted Mortality for Neurologic Diseases by Race/Ethnicity, United States, 2010–2019.
Notes: Race/ethnicity was categorized as Hispanic and NH Asian (including Asian, Native Hawaiian, and other Pacific Islander), American Indian and Alaska Native (AIAN), Black, and White populations. Mortality rates are for neurologic diseases (not including diseases with Potential Neurologic Manifestations), as defined in eAppendix 1 (links.lww.com/WNL/C925). NH = non-Hispanic.
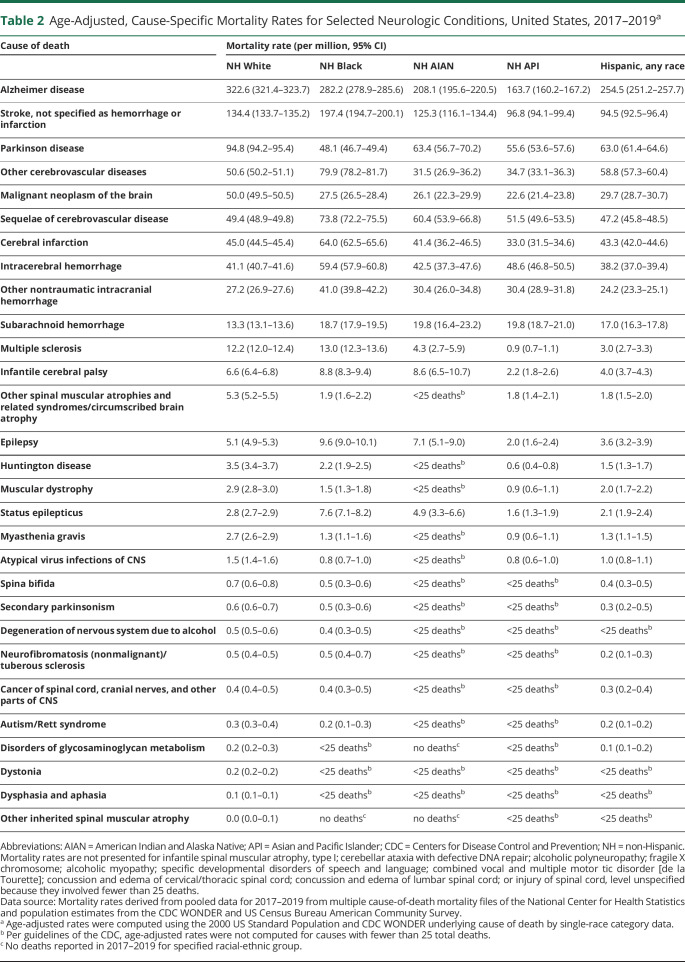
As shown in Table 1, death rates from neurologic diseases (all causes) in 2017–2019 were also higher among older age groups, the male population, and adults older than age 25 without a high school diploma. The NH Black population experienced the highest mortality rate. Table 2, which displays age-adjusted mortality rates by race/ethnicity for the most common neurologic and PNM diseases, shows that mortality rates in the NH Black population were highest for 10 of the 15 most common causes of death. However, the White population was at greater risk of death from some diseases (e.g., Alzheimer disease, Parkinson disease, malignant neoplasm of the brain).
Table 1.
Demographic Disparities in Mortality From Neurologic Diseases, United States, 2017–2019
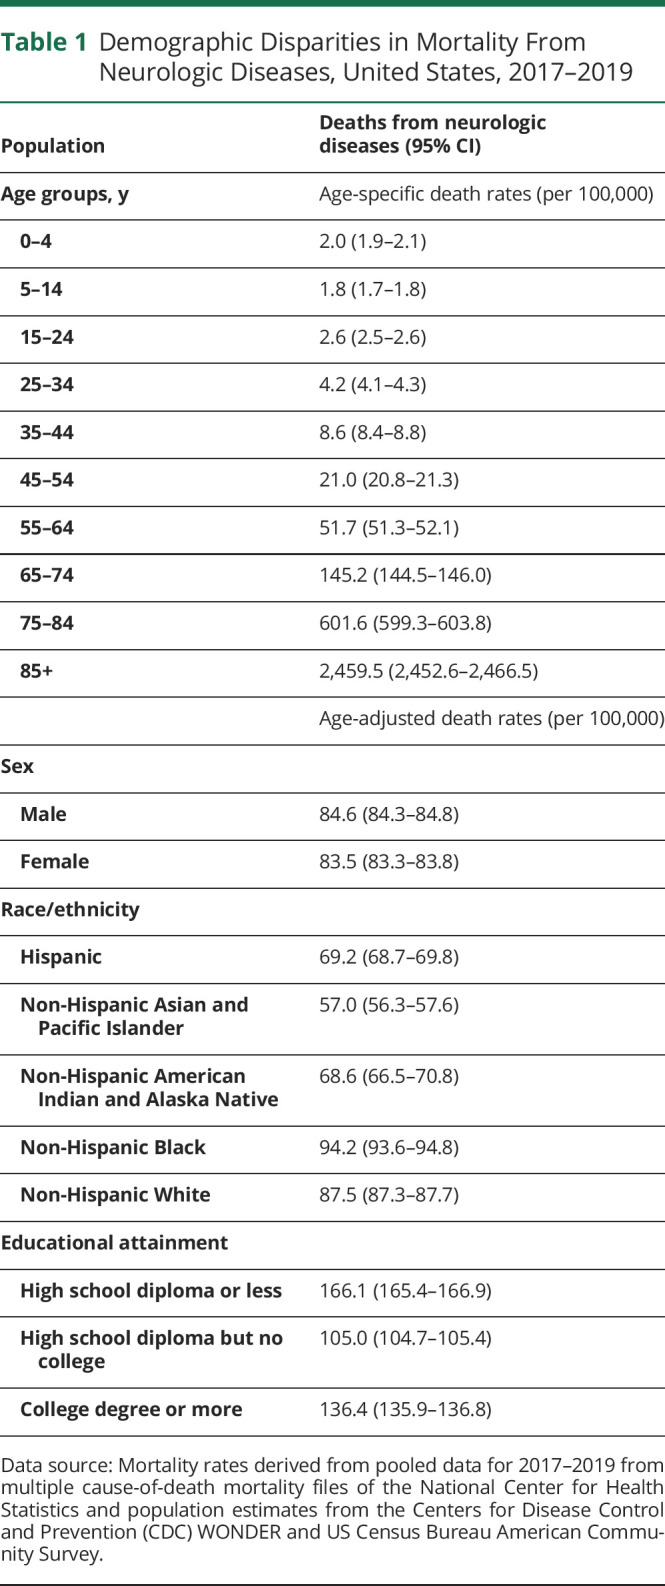
Table 2.
Age-Adjusted, Cause-Specific Mortality Rates for Selected Neurologic Conditions, United States, 2017–2019a
Avertable Deaths
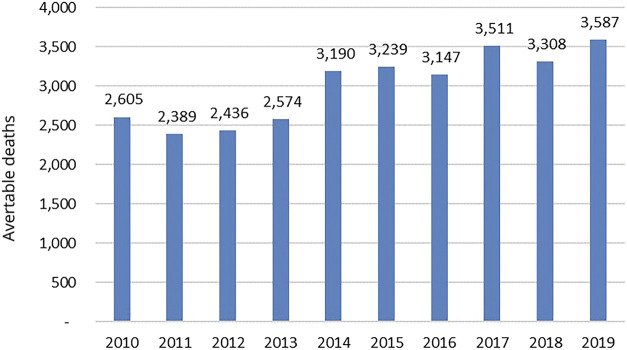
During the decade spanning 2010 to 2019, 29,986 deaths would have been averted had the NH Black population experienced the neurologic mortality rates of the NH White population (Figure 2). The annual number of avertable deaths in the NH Black population ranged from 2,389 deaths in 2011 to 3,587 deaths in 2019, when the largest number of avertable deaths of the decade occurred. If the NH Black population had experienced the mortality rates of the Hispanic population, 88,407 deaths would have been averted, and 117,519 deaths would have been averted if the NH Asian mortality rate (the lowest of all groups) applied. The data exploration exercise revealed that 88,407 deaths would have been averted in the NH Black population if it experienced the mortality rates of the Hispanic population, and 117,519 deaths would have been averted if the NH Asian mortality rate (the lowest of all groups) applied.
Figure 2. Avertable Deaths, by Year, Had the Mortality Rate From Neurologic Diseases Experienced by the Non-Hispanic White Population Applied to the Non-Hispanic Black Population (Total N = 29,986).
Notes: See methods for calculating avertable deaths.
Discussion
Within the past decade, mortality from neurologic diseases has increased substantially, even after adjustment for age, suggesting that factors beyond population aging are contributing to this ominous trend. Vital statistics indicate that premature deaths from neurologic diseases—those occurring before age 65—have also increased since the 1990s.20 Further research is needed to identify the etiologic factors for rising mortality and to study solutions.
During the period observed in this study, mortality from neurologic diseases (all causes) was consistently higher in the NH Black population than in other racial-ethnic groups. The same has been true for generations, across multiple health conditions, reflecting systemic factors such as the adverse conditions to which the NH Black population has been exposed throughout US history (e.g., enslavement, segregation, Jim Crow laws, trauma, violence) and the persistent structural factors in society that have limited access to resources important to health.21,22 Across generations, Black Americans have systematically faced barriers to education, income and wealth-building, jobs and promotions, livable and equitable wages, affordable housing and transportation, criminal justice, and health care. Segregation, economic adversity, and other factors have impeded their ability to live in housing and neighborhoods with conditions that promote health.23
Additional factors may be responsible for higher death rates from some neurologic diseases in the NH Black population and for experiencing lower death rates than NH White patients for some neurologic diseases, such as Alzheimer disease. Further research is needed to clarify whether the latter cases represent protective factors enjoyed by the Black population, ascertainment bias or other differences in the quality of the reported data, or an artifact of shorter survival rates; owing to racial inequities involving other health conditions, life expectancy has been historically lower in the NH Black than in the NH White population.10
For neurologic diseases (and many other conditions), the Hispanic and NH Asian populations have lower reported age-adjusted mortality rates than NH Black and NH White populations. This study estimated that nearly 30,000 US deaths would have been averted in the past decade if the NH Black population experienced the neurologic mortality rates of the NH White population, but nearly 2 to 3 times as many deaths would have been averted if mortality rates in the Hispanic or NH Asian populations applied, respectively.
However, the lower mortality rates reported for Hispanic and NH Asian populations must be interpreted with caution, for several reasons. First, both categories are extremely broad and encompass large, heterogeneous populations with very diverse nationalities and cultures and potentially different mortality rates. Second, mortality rates reported in the NH Asian population may be confounded by changes in immigration patterns and ethnic composition and by improvements in race classification on death certificates over time that skew trends in mortality rates.24 The same issue complicates vital statistics in the American Indian and Alaska Native population.25 Disaggregating these broad categories can expose disparate mortality rates among diverse Hispanic populations (e.g., Mexican, Puerto Rican, Honduran, Spanish) and NH Asian populations (e.g., Japanese, Chinese, Vietnamese, Korean, Pacific Islander) but is often difficult because the CDC suppresses small numbers due to data reliability and confidentiality concerns. Finally, as noted with the Black population, ascertainment bias and other differences in the quality of reported data may influence reported mortality rates.
Third, in what the literature describes as the Hispanic or immigrant “paradox,” immigrant populations often experience better health outcomes than persons born in the United States (or immigrants who have lived in the country for many years).26 The same issue applies to recent NH Black immigrants from African and Caribbean regions.27 Further research is needed to clarify whether neurologic mortality rates among NH Asian and Hispanic persons born in the United States are as low as mortality rates among those who have recently immigrated to the country.
Another area requiring further investigation is why, according to Table 1, adults with a college education experienced higher mortality rates from neurologic diseases than those with only some college. As may occur among racial and ethnic populations with a greater prevalence of comorbid conditions, adults who fail to complete college may face a higher risk of premature deaths from non-neurological diseases and succumb to these causes before neurologic disorders emerge or become fatal. In addition, particularly among marginalized racial and ethnic populations and adults with only some college, deaths from neurologic diseases may be more frequently misattributed to non-neurological causes because of limited access to health care and accurate diagnoses or to qualified medical examiners. Differential access to services may also distort observed rates. For example, adults with only a high school diploma, a population with higher poverty rates and greater Medicaid eligibility—may experience greater access to care than those with more education and disqualifying income levels. These uncertainties underscore the need for clinical and health services research to fully understand the disparities reported here.
Table 2 documents profound racial-ethnic disparities in mortality rates from PNM diseases, but this study does not demonstrate whether the same disparities apply to neurologic manifestations of these diseases. Determining the frequency with which each disease results in (a) neurologic complications and (b) fatal neurologic complications—necessary information to determine racial-ethnic disparities in mortality from neurologic complications of these diseases—was beyond the scope of this study. For many PNM diseases, such data may not exist and should be obtained in future research.
Addressing the increase in mortality from neurologic diseases (all causes) that has occurred since 2013 is an urgent priority, not only because of the threat to public health and the need to understand the etiology but also because of its enormous social and policy implications. For example, the increase in disease will heighten demands on the health care system, nursing homes, and palliative care, and it will increase health care costs, affect workforce productivity, and place growing demands on payers. Evidence that more US adults are dying from such diseases before age 654,5 has implications for workforce productivity and for today's children, whose parents are more likely to die from these diseases in the prime of their lives. This study suggests an urgent need for policy solutions and additional research, both to deal with the rising tide of neurologic diseases and to address systemic racism and the other factors responsible for persistent racial-ethnic health inequities.
This study was initiated just as the COVID-19 pandemic began and examined data only through 2019. The pandemic exacerbated preexisting disparities in access to neurologic care and health outcomes, with people of color experiencing higher rates and more severe complications from SARS-CoV-2 infection, including its complex neurologic manifestations.28 Hispanic and non-Hispanic Black and Asian populations experienced a disproportionate increase in cerebrovascular mortality in 2020 relative to 2019.29 Patients with neurologic conditions unrelated to COVID-19 also experienced gaps resulting from disruptions caused by the pandemic.30 Accordingly, the current number of excess deaths attributable to racial and ethnic disparities in neurologic mortality is likely higher than this study's estimates from 2010 to 2019 indicate.
Other methodological limitations of this study also deserve consideration. First, a fundamental weakness of calculations based on population avertable risk is the aspirational assumption that the mortality rates of the reference population can be achieved. This may not hold for conditions that are not modifiable. Second, this study applied the mortality rates of the same calendar year to calculate avertable deaths; achieving the mortality rates of a reference population is more likely to have graduated effects over time. Third, this analysis is retrospective and cannot predict the number of deaths that can be averted in future years by correcting disparities. Fourth, as already noted, rates were calculated only for broad racial-ethnic categories; disaggregated data for more specific groups would be more useful but as yet may be unavailable. Even for these broad categories, this study did not report mortality rates for certain neurologic diseases because of inadequate or censored data. Fifth, all studies relying on cause-of-death classifications on death certificates and ICD coding are subject to coding errors and misclassification. Particularly among populations with limited access to health care (notably the American Indian and Alaska Native population), ascertainment bias may limit accurate classification of causes of death and contribute to underreporting of deaths from specific causes. In addition, this study relied on the RCDC system to identify neurologic diseases.
Sixth, the authors' judgments in subclassifying RCDC diseases as inherently neurologic or PNM were subjective and may lack comparability with other studies. Moreover, as noted above, only a subset of PNM deaths involve neurologic manifestations as the underlying cause of death. The proportions vary with each disease, are generally unknown, and were not factored into the calculations. Finally, this study examines only mortality rates, and much of the burden of neurologic diseases involves nonfatal disorders that afflict patients throughout their lives. Mortality is the “tip of the iceberg,” and further research to document inequities in morbidity and functional impairment is therefore essential to fully document inequities in neurologic diseases.
Despite these limitations, the magnitude and consistency of the observed disparities in neurologic mortality rates suggest a need for additional research and interventions to eliminate the inequities.
Glossary
- CDC
Centers for Disease Control and Prevention
- ICD-10-CM
International Classification of Diseases, Tenth Revision, Clinical Modification
- NCHS
National Center for Health Statistics
- NH
non-Hispanic
Take-Home Points
→ Mortality rates from neurologic diseases have increased in the past decade.
→ Death rates from neurologic diseases are higher in the non-Hispanic Black population than in non-Hispanic White, non-Hispanic American Indian and Alaska Native, Hispanic, and non-Hispanic Asian populations.
→ The gap in the death rate for neurologic diseases between non-Hispanic Black and non-Hispanic White populations began increasing in 2011 and by 2019 had increased by almost 67%.
→ In the decade spanning 2010 to 2019, nearly 30,000 deaths from neurologic diseases would not have occurred had the non-Hispanic Black population experienced the same mortality rates as the non-Hispanic White population. If Hispanic or non-Hispanic Asian populations are used as the reference group, the estimate of avertable deaths increases to almost 90,000 or almost 120,000, respectively.
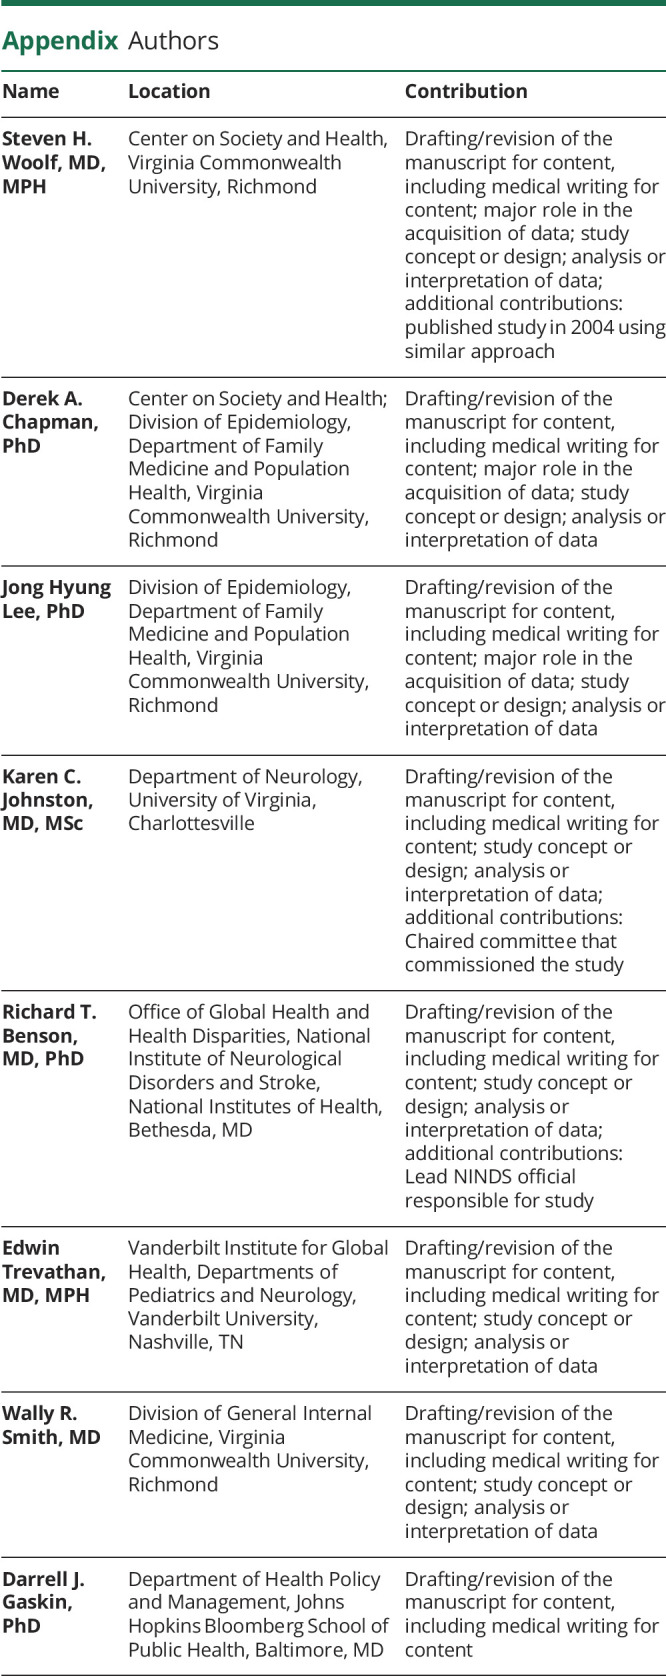
Appendix. Authors
Study Funding
The authors report no targeted funding.
Disclosure
The authors report no relevant disclosures. Go to Neurology.org/N for full disclosures.
References
- 1.Pakpoor J, Goldacre M. The increasing burden of mortality from neurological diseases. Nat Rev Neurol. 2017;13(9):518-519. [DOI] [PubMed] [Google Scholar]
- 2.Pritchard C, Rosenorn-Lanng E, Silk A, Hansen L. Controlled population-based comparative study of USA and international adult (55-74) neurological deaths 1989-2014. Acta Neurol Scand. 2017;136(6):698-707. [DOI] [PMC free article] [PubMed] [Google Scholar]
- 3.GBD 2016 Neurology Collaborators. Global, regional, and national burden of neurological disorders, 1990-2016: a systematic analysis for the Global Burden of Disease Study 2016. Lancet Neurol. 2019;18(5):459-480. [DOI] [PMC free article] [PubMed] [Google Scholar]
- 4.Woolf SH, Chapman DA, Buchanich JM, Bobby KJ, Zimmerman EB, Blackburn SM. Changes in midlife death rates across racial and ethnic groups in the United States: systematic analysis of vital statistics. BMJ. 2018;362:k3096. [DOI] [PMC free article] [PubMed] [Google Scholar]
- 5.National Academies of Sciences, Engineering, and Medicine. High and Rising Mortality Rates Among Working-Age Adults. National Academies Press; 2021. [PubMed] [Google Scholar]
- 6.The Lancet Neurology. Disparities in neurological care: time to act on inequalities. Lancet Neurol. 2020;19(8):635. [DOI] [PubMed] [Google Scholar]
- 7.GBD 2017 US Neurological Disorders Collaborators. Burden of neurological disorders across the US from 1990-2017: a Global burden of disease study. JAMA Neurol. 2021;78(2):165-176. [DOI] [PMC free article] [PubMed] [Google Scholar]
- 8.Tarko L, Costa L, Galloway A, et al. . Racial and ethnic differences in short- and long-term mortality by stroke type. Neurology. 2022;98(24):e2465-e2473. doi: 10.1212/WNL.0000000000200575 [DOI] [PubMed] [Google Scholar]
- 9.Healthy People 2030 Framework (web). Accessed September 30, 2021. healthypeople.gov/2020/About-Healthy-People/Development-Healthy-People-2030/Framework. [Google Scholar]
- 10.National Center for Health Statistics. Health, United States, 2015: With Special Feature on Racial and Ethnic Health Disparities. National Center for Health Statistics, 2016. [PubMed] [Google Scholar]
- 11.Woolf SH, Johnson RE, Fryer GE Jr, Rust G, Satcher D. The health impact of resolving racial disparities: an analysis of US mortality data. Am J Public Health. 2004;94(12):2078-2081. [DOI] [PMC free article] [PubMed] [Google Scholar]
- 12.Caraballo C, Massey DS, Ndumele CD, et al. Excess mortality and years of potential life lost among the Black population in the US, 1999-2020. JAMA. 2023;329(19):1662-1670. [DOI] [PMC free article] [PubMed] [Google Scholar]
- 13.National Center for Health Statistics. Mortality Multiple Cause of Death Public Use Data Files. Accessed January 30, 2021. cdc.gov/nchs/data_access/vitalstatsonline.htm#Mortality_Multiple. [Google Scholar]
- 14.Single-race Population Estimates, United States, 2010-2019. CDC WONDER Online Database. Updated June 25, 2020. Accessed January 30, 2021. wonder.cdc.gov/single-race-single-year-v2019.html. [Google Scholar]
- 15.US Census Bureau. American Community Survey: Table B15001. Accessed January 20, 2021. data.census.gov/cedsci/table?q=B15001&tid=ACSDT1Y2019.B15001. [Google Scholar]
- 16.World Health Organization. The ICD-10 Classification of Mental and Behavioural Disorders: Clinical Descriptions and Diagnostic Guidelines. World Health Organization; 1992. [Google Scholar]
- 17.Frequently Asked Questions about the NIH Research, Condition, and Disease Categorization (RCDC) System. Accessed November 27, 2022. report.nih.gov/funding/categorical-spending/rcdc-faqs
- 18.Anderson RN, Rosenberg HM. Age standardization of death rates: implementation of the year 2000 standard. Natl Vital Stat Rep. 1998;47(3):1-16, 20. [PubMed] [Google Scholar]
- 19.Curtin LR, Klein RJ. Direct standardization (age-adjusted death rates). Healthy People 2000 Stat Notes. 1995;6:1-10. [PubMed] [Google Scholar]
- 20.Centers for Disease Control and Prevention, National Center for Health Statistics. Underlying Cause of Death 1999-2019 on CDC WONDER Online Database, Released in 2020. Accessed January 30, 2021. wonder.cdc.gov/ucd-icd10.html. [Google Scholar]
- 21.Williams DR, Lawrence JA, Davis BA. Racism and health: evidence and needed research. Annu Rev Public Health. 2019;40:105-125. [DOI] [PMC free article] [PubMed] [Google Scholar]
- 22.Bailey ZD, Krieger N, Agénor M, Graves J, Linos N, Bassett MT. Structural racism and health inequities in the USA: evidence and interventions. Lancet. 2017;389:1453-1463. [DOI] [PubMed] [Google Scholar]
- 23.Rothstein R. The Color of Law: A Forgotten History of How Our Government Segregated America. Liveright Publishing; 2017. [Google Scholar]
- 24.Arias E, Schauman WS, Eschbach K, Sorlie PD, Backlund E. The validity of race and Hispanic origin reporting on death certificates in the United States. Vital Health Stat 2. 2008;148:1-23. [PubMed] [Google Scholar]
- 25.Arias E, Xu J, Jim MA. Period life tables for the non-hispanic American Indian and Alaska native population, 2007-2009. Am J Pub Health. 2014;104(suppl. 3):S312–S319. [DOI] [PMC free article] [PubMed] [Google Scholar]
- 26.Ruiz JM, Steffen P, Smith TB. Hispanic mortality paradox: a systematic review and meta-analysis of the longitudinal literature. Am J Public Health. 2013;103(3):e52-e60. [DOI] [PMC free article] [PubMed] [Google Scholar]
- 27.Pinheiro PS, Medina H, Callahan KE, et al. . Cancer mortality among US blacks: variability between African Americans, Afro-Caribbeans, and Africans. Cancer Epidemiol. 2020;66:101709. [DOI] [PMC free article] [PubMed] [Google Scholar]
- 28.Nolen L, Mejia NI. Inequities in neurology amplified by the COVID-19 pandemic. Nat Rev Neurol. 2021;17(2):67-68. [DOI] [PMC free article] [PubMed] [Google Scholar]
- 29.Wadhera RK, Figueroa JF, Rodriguez F, et al. . Racial and ethnic disparities in heart and cerebrovascular disease deaths during the COVID-19 pandemic in the United States. Circulation. 2021;143(24):2346-2354. [DOI] [PMC free article] [PubMed] [Google Scholar]
- 30.Burns SP, Fleming TK, Webb SS, et al. . Stroke recovery during the COVID-19 pandemic: a position paper on recommendations for rehabilitation. Arch Phys Med Rehabil. 2022;103(9):1874-1882. [DOI] [PMC free article] [PubMed] [Google Scholar]


