Abstract
Objectives:
To investigate relationships between histogram-based high-resolution CT (HRCT) indexes and pulmonary function tests (PFTs) in interstitial lung diseases.
Methods:
Forty-nine patients having baseline and 1-year HRCT examinations and PFTs were investigated. Histogram-based HRCT indexes were calculated; strength of associations with PFTs was investigated using Pearson correlation. Patients were divided into progressive and non-progressive groups. HRCT indexes were compared between the two groups using the U-test; within each group, baseline and follow-up Wilcoxon analysis was performed. Receiver operating characteristic analysis was used for predicting disease progression.
Results:
At baseline, moderate correlations were observed considering kurtosis and diffusion capacity of the lungs for carbon monoxide (DLCO) (r = 0.54) and skewness and DLCO (r = 0.559), whereas weak but significant correlations were observed between forced vital capacity and kurtosis (r = 0.368, p = 0.009) and forced vital capacity and skewness (r = 0.391, p = 0.005). Negative correlations were reported between HAA% and PFTs (from r = −0.418 up to r = −0.507). At follow-up correlations between quantitative indexes and PFTs were also moderate, except for high attenuation area (HAA)% −700 and DLCO (r = −0.397). In progressive subgroup, moderate and strong correlations were found between DLCO and HRCT indexes (r = 0.595 kurtosis, r = 0.672 skewness, r=-0. 598 HAA% −600 and r = −0.626 HAA% −700). At follow-up, we observed significant differences between the two groups for kurtosis (p = 0.029), HAA% −600 (p = 0.04) and HAA% −700 (p = 0.02). To predict progression, ROC analysis reported sensitivity of 90.9% and specificity of 51.9% using a threshold value of δ kurtosis <0.03.
Conclusion:
At one year, moderate correlations suggest that progression could be assessed through HRCT quantification.
Advances in knowledge:
This study promotes histogram-based HRCT indexes in the assessment of progressive pulmonary fibrosis.
Objective
Interstitial lung diseases (ILDs) represent a heterogeneous spectrum of parenchymal lung disorders, which overlap in clinical presentations and patterns of lung injury. 1 Among ILDs, idiopathic pulmonary fibrosis (IPF) has shown a poor prognosis, with a median survival of 3–5 years; recently, the introduction of antifibrotic drugs has extended survival up to 5–7 years. 2 These antifibrotic agents—pirfenidone and nintedanib—have been used to slow-down the fibrosing process, and to reduce the decline in lung function. 3
The IMPULSIS clinical trial has recently demonstrated that other fibrosing diseases could be at risk of developing progressive phenotype; more in detail, in this study, Nintedanib has reported a reduction of the annual rate of decline in forced vital capacity (FVC) compared to placebo, providing a new therapeutic perspective for progressive fibrosing-ILDs (PF-ILDs). 4 Therefore, the new entity of PF-ILDs has been conceptualized to describe patients who, independent from the ILD classification, exhibit progression of fibrosis; these patients may be “lumped” with the IPF patients, since they share similar biological and clinical behavior. 5 PF-ILDs include idiopathic non-specific interstitial pneumonia (iNSIP), unclassifiable idiopathic interstitial pneumonia, autoimmune ILDs, chronic sarcoidosis, chronic hypersensitivity pneumonitis (HP) and exposure-related diseases—such as asbestosis and silicosis. 1,6 To clarify how the term “progressive” should be defined, several criteria have been introduced in literature. 7,8 Cottin et al have proposed the following criteria: a relative decline in FVC ≥10%, a relative decline in the diffusing capacity of the lung for carbon monoxide ≥15%, or a relative decline in FVC ≥5% but <10% in combination with worsening of symptoms or radiographic findings in the past 24 months. 7 In the INBUILD study, the eligibility criteria proposed were as follows: (i) a relative decline in FVC ≥10%; (ii) a relative decline in FVC ≥5% but <10% in combination with worsening of respiratory symptoms or the increased extent of fibrosis observable on high-resolution CT (HRCT); (iii) worsening of respiratory symptoms combined with increased extent of fibrosis observable on HRCT in the past 24 months. 4 Recently, new clinical practice guidelines have been resealed, defining that progressive pulmonary fibrosis (PPF) refers to patients with ILD (other than IPF) having at least two of the following three criteria—occurring within the past year with no alternative explanation: (i) worsening respiratory symptoms; (ii) physiological evidence of disease progression (absolute FVC decline ≥5% and absolute DLCO decline ≥10%); (iii) radiological signs of disease progression. 9
As well described by the aforementioned studies, HRCT plays an important role in determining the fibrosing phenotype, alongside clinical and functional evaluation. However, the interpretation of radiological patterns in evolutive diseases— may be influenced by the experience of radiologists, and may be at risk for subjective analysis. In this context, a quantitative approach using histogram-based analysis could be proposed to characterize disease progression and stratify patients 10 : this HRCT quantification has provided an accurate estimation of survival in IPF patients and has shown a good degree of correlation with PFTs. 11,12
Since that the impact of quantitative analysis in the assessment of progressive phenotype has been not so far investigated in literature, the aim of this study is to extend the histogram-based analysis to PF-ILDs, investigating the relationship between quantitative HRCT indexes and PFTs—in patients having early (at 1 year from diagnosis) progressive and non-progressive phenotypes; in addition, the diagnostic capability of quantitative analysis in the prediction of the progressive fibrosing phenotype, has been evaluated.
Methods
This retrospective study was conducted by recruiting patients from electronic databases of our Referral Centre for Rare Lung Disease and radiological archives. We have performed our query starting from 2016. Being a retrospective evaluation, this study did not need approval by an institutional review board. All patients provided a personal consensus for collection and acquisition of data. The inclusion criteria adopted in our analysis were:
ILD diagnosis according to the ATS/ERS guidelines released in 2018, 13 obtained after a multidisciplinary evaluation;
ILD patients having at least two volumetric HRCT (baseline and follow-up) examinations;
PFTs—including FVC and diffusion capacity of the lungs for carbon monoxide (DLCO) acquired nearest to the HRCT examinations.
Patients were not included in our analysis in case of inadequate HRCT examinations—due to images damaged by artifacts, no high-resolution technique, no volumetric scans; patients were also discharged—if having only one volumetric HRCT scan available.
Acute pulmonary conditions (acute exacerbation of IPF, edema, infections) were also considered exclusion criteria in our analysis, due to the possibility of increased lung density, and, consequently, HRCT index alteration.
Population
According to the mentioned inclusion criteria, a total of 49 ILD patients (IPF, iNSIP, unclassifiable idiopathic interstitial pneumonia, autoimmune ILDs, chronic HP) have been selected from our electronic database—starting the recruiting since 2015. 31 patients were males (63.26%) and 18 were females (36.73%); the average age at diagnosis was 66.6 years, with a standard deviation of ±8.51.
The patients were divided into two groups, the progressive fibrosing (PF) group and non-progressive fibrosing (NPF) group—based on the presence or absence of progressively fibrosing phenotype, accordingly to the physiological criteria released by new clinical practice guidelines 9 :
absolute decline in FVC of ≥5% within 1 year of follow-up, and/or;
absolute decline in DLCO (corrected for hemoglobin) of ≥10% within 1 year of follow-up.
At the time of enrollment, patients were required to have an FVC of at least 45% of the predicted value and a DLCO (corrected for hemoglobin) of 30 to less than 80% of the predicted value. FVC and DLCO, were collected for each patient—considering the values nearest to the HRCT data acquisition (no more than 3 months). The mean time elapsed between HRCT and PFTs was 39.15 ± 15.37 days at baseline and 48.42 ± 19.57 days at follow-up.
Characteristics of patients included in our analysis have been summarized in Table 1.
Table 1.
Population study.
| Mean ± SD a or n (%) | Median (interquartile range) | |
|---|---|---|
| Age at diagnosis (years) | 66.694 ± 8.51 | 68 (65, 71) |
| Male | 31 (63.26%) | - |
| Female | 18 (36.73%) | - |
| FVCb% baseline | 80.673 ± 22.532 | 78 (65, 95) |
| FVCb% follow-up | 77.653 ± 24.012 | 79 (55, 93) |
| DLCOc baseline | 59.624 ± 20.3 | 58 (46, 74.5) |
| DLCOc follow-up | 59.47 ± 21.845 | 58.6 (43.8, 74) |
Characteristics (age, gender, functional respiratory values) of the study population.
SD, standard deviation.
FVC, forced vital capacity.
DLCO, diffusion Ccpacity of the lungs for carbon monoxide.
HRCT protocol
Volumetric HRCT examinations were included according to the following technical parameters, using a multidetector CT (MDCT) scanner (Optima 660 64 slices, General Electric Company): supine position/tube voltage, 120 kVp/tube current, 140–320 mA/thickness (single collimation width), 0.625–1.25 mm/total collimation width (40 mm)/rotation time, 0.5 s/bone plus convolution kernel/image size 512 × 512/spiral pitch factor 0.98/contiguous or overlap images/automatic tube current modulation noise index ≈23.14/no contrast media administration/no spirometry control.
Quantitative analysis
The quantitative analysis was performed using 3D Slicer © (Slicer release v. 4.11.20210226) 14 —an open-source software package for medical image informatics, biomedical image processing, and three-dimensional visualization. The total lung volume was automatically segmented from the surrounding tissue; right and left lung volumes were also calculated. For each lung, three zones of the same size were assessed: right and left upper, middle and lower portions; lung zone differentiations were automatically generated by 3D Slicer © (Slicer release v. 4.11.20210226). 14 Segmentation was applied using an algorithm to isolate the lungs from other tissues and structures – selecting pixels between −200 Hounsfield unit (HU) and −1.024 HU; a manual correction was performed, to ensure that segmentation was accurate, with no parenchymal zones excluded. Finally, the histogram analysis was achieved and specific parameters were automatically calculated. More in detail, the following HRCT indexes were derived from histogram analysis:
Kurtosis;
Skewness;
High attenuation areas at −600 HU (HAA% −600) and HAA at −700 HU (HAA% −700);
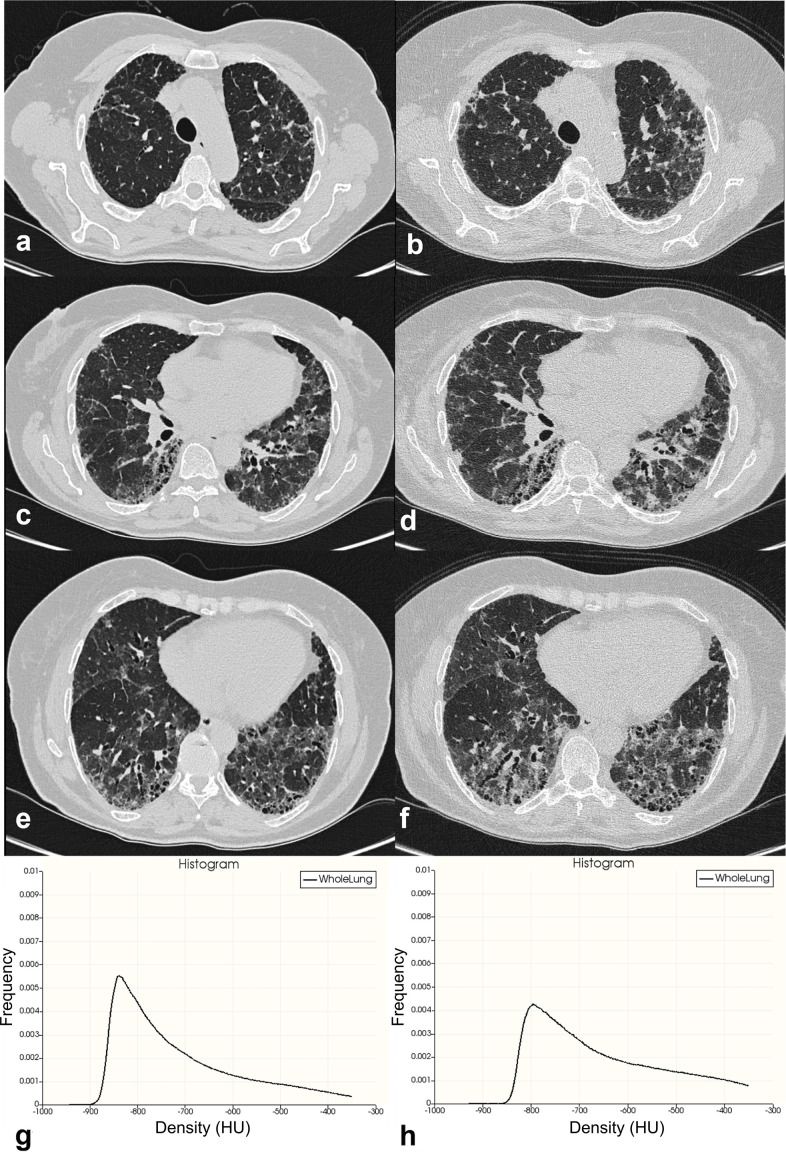
The HRCT indexes were obtained: for whole lung, left lung, right lung, and for upper, middle and lower portions of left (LUP, LMP, LLP) and right lung (RUP, RMP, RLP). An example of disease progression—assessed by quantitative histogram analysis—is provided in Figure 1.
Figure 1.
An example of disease progression assessed by quantitative histogram analysis. Figures a, c and e show a patient with a fibrosing pattern (unclassifiable idiopathic interstitial pneumonia); diffuse ground-glass opacities are well depicted, mainly distributed in the dorsal regions. Traction bronchiectasis are also recognizable in the lower lobes. At 1-year follow-up, CT images in figures b, d and f show increased representation of ground-glass opacities and traction bronchiectasis. Baseline (figure g) and follow-up (figure h) histograms based analysis clearly demonstrates a decrease of the frequency of the distributions between CT examinations. HU, Hounsfield unit.
The kurtosis represents the degree of sharpness of the peak histogram, when compared with the histogram of a normal distribution—which would have a kurtosis value of zero; it indicates how tall and sharp the central peak is. Mild fibrosis has been associated with high values of kurtosis, whereas low values of kurtosis have been observed in HRCT with a large degree of lung fibrosis. 15
Skewness measures the degree of symmetry of a distribution, and namely describes how the curve appears distorted or skewed either to the left or to the right. A skewness value of zero means that the distribution is perfectly symmetric. Low values of skewness have been associated with a more advanced stage of fibrotic disease. Finally, high attenuation areas % (HAA%) indicate the percentage of parenchyma having increased attenuation for ancillary fibrosis markers, such as ground-glass opacities and reticulations. As performed in a previous study by Ash et al., it was calculated as percentages of the extracted whole lung volume with attenuation values greater than 250 HU and less than 600 HU. 10
Statistical analysis
Statistical analysis was performed using MedCalc program (MedCalc v. 11.4.4.0, MedCalc Software bvba, Mariakerke, Belgium) and StatPlus program (StatPlus Build 8.0.3/Core v. 7.8.11).
Characteristics of the study population were reported as: mean (standard deviation) for normally distributed data, median (interquartile range) for non-normally distributed data, 16 or percentages of the relative frequency as appropriate. For main variables, 95% confidence interval (CI) values were reported. HRCT indexes were predominantly analyzed using non-parametric statistical tests: indeed, a Wilcoxon analysis was performed within each group to compare the median values of HRCT indexes between baseline and follow-up; to compare median values of HRCT indexes between the two groups (NPF group and PF group), we have performed the Mann–Whitney U-test (comparisons were calculated at baseline and follow-up).
A Pearson correlation was used to analyze the strength of associations between HRCT indexes (kurtosis, skewness, HAA%) and PFTs (FVC and DLCO); the correlation was calculated for all patients, and then investigated for each group (NPF group and PF group)—both at baseline and follow-up. The strength of correlations was graded as follows:
r > 0.80= very strong relationship;
r > 0.60 to 0.80 = strong relationship;
r > 0.40 to 0.60 = moderate relationship;
r > 0.20 to 0.40 = weak relationship;
r ≤ 0.20= no or negligible relationship.
For r values ranging from 0 to −1, the same correlation classes were considered in negative.
Each HRCT indexes δ value for all patients (δ value = HRCT index value at follow-up—HRCT index value at baseline) was subjected to a ROC analysis for predicting the presence of the progressively fibrosing phenotype, reporting the percentage value of sensitivity and specificity.
Results
Based on new clinical practice guidelines, 9 PF group finally included 22 patients (mean age of 66.27 ± 10.23), whereas NPF group was represented by 27 patients (mean age of 66.8 ± 8). More in detail, we observed 13 males (59.09%) and 9 females (40.9%) in the PF group, and 18 males (66.6%) and 9 females (33.3%) in the NPF group. A mean gap of 14.09 ± 6.18 months was reported between baseline and follow-up TC examinations; more in detail, we registered between examinations values of mean interval time equal to 14.09 ± 6.18 months and to 14.18 ± 4.23 months—in the PF and NPF groups respectively. For HRCT indexes—values of means, standard deviations, medians and interquartile ranges have been listed in Table 2.
Table 2.
HRCT indexes observed in our population study
| HRCT indexes | Mean ± SDa or n (%) | Median (interquartile range) | ||
|---|---|---|---|---|
| Kurtosis baseline | 3.018 ± 2.837 | 2.05 (1.17; 4.39) | ||
| Kurtosis baseline PFb | 2.2 ± 1.9 | 1.8 (0.785; 3.445) | ||
| Kurtosis baseline NPFc | 3.67 ± 3.3 | 2.12 (1.395; 5.155) | ||
| Kurtosis follow-up | 2.938 ± 2.986 | 2.33 (1.13; 4.1) | ||
| Kurtosis follow-up PFb | 1.775 ± 1.695 | 1.885 (0.172; 3.177) | ||
| Kurtosis follow-up NPFc | 3.887 ± 3.473 | 3.09 (1.34; 4.935) | ||
| Skewness baseline | 1.529 ± 0.599 | 1.48 (1.14; 1.98) | ||
| Skewness baseline PFb | 1.366 ± 0.505 | 1.37 (0.955; 1.67) | ||
| Skewness baseline NPFc | 1.662 ± 0.646 | 1.5 (1.21; 2.16) | ||
| Skewness follow-up | 1.493 ± 0.659 | 1.4 (1.15; 1.97) | ||
| Skewness follow-up PFb | 1.239 ± 0.568 | 1.395 (0.79; 1.675) | ||
| Skewness follow-up NPFc | 1.699 ± 0.655 | 1.4 (1.245; 2.14) | ||
| HAAd%−600 baseline | 21.06 ± 11.951 | 17.4 (12.89; 26.6) | ||
| HAAd%−600 baseline PFb | 24.125 ± 13.119 | 20.755 (14.94; 28.05) | ||
| HAAd%−600 baseline NPFc | 18.565 ± 10.5 | 16.33 (10.765; 23.53) | ||
| HAAd%−600 follow-up | 21.917 ± 14.197 | 18.65 (12; 28.06) | ||
| HAAd%−600 follow-up PFb | 27.563 ± 17.763 | 20.65 (15; 36.645) | ||
| HAAd%−600 follow-up NPFc | 17.317 ± 8.264 | 17.02 (9.55; 22.845) | ||
| HAAd%−700 baseline | 35.65 ± 18.144 | 32.51 (21.79; 42.05) | ||
| HAAd%−700 baseline PFb | 40.446 ± 18.626 | 37.5 (27.04; 45.69) | ||
| HAAd%−700 baseline NPFc | 31.746 ± 17.096 | 27.69 (19.167; 40.43) | ||
| HAAd%−700 follow-up | 36.054 ± 18.854 | 33.89 (20.77; 45.28) | ||
| HAAd%−700 follow-up PFb | 43.52 ± 21.287 | 38.045 (26.422; 56.805) | ||
| HAAd%−700 follow-up NPFc | 29.971 ± 14.3 | 28.9 (16.77; 41.28) | ||
Baseline and follow-up Pearson analysis for all patients, between HRCT indexes (Kurtosis, Skewness, HAA% −600, HAA% −700) and PFT values. Levels of significance for each correlation are reported in brackets.
SD, standard deviation.
PF, progressive fibrosing.
NPF, non-progressive fibrosing.
HAA, high attenuation area.
Wilcoxon analysis
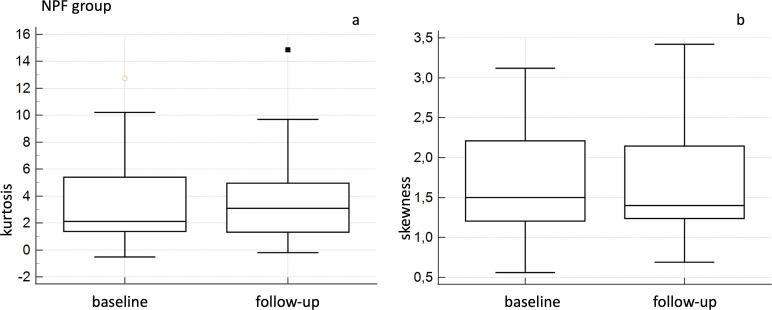
For NPF groups, Wilcoxon analysis did not report significant differences comparing baseline and follow-up values of CT quantitative indexes—with p values of 0.3 for Kurtosis, 0.381 for skewness, 0.888 for HAA% −600 and 0.809 for HAA% −700 (Figure 2).
Figure 2.
Box-and-whisker analysis for baseline and follow-up kurtosis (a) and skewness (b) values—in the NPF group. NPF, non-progressive fibrosing.
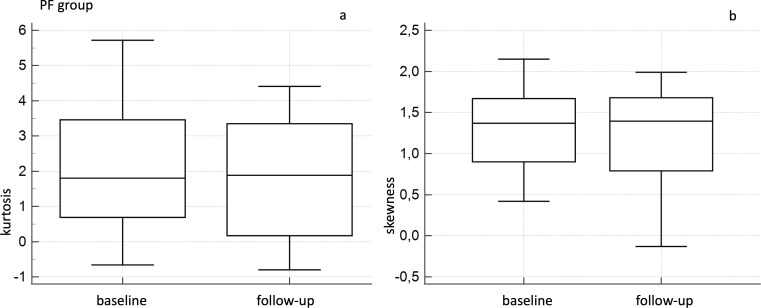
In PF group, Wilcoxon analysis showed a significant difference between baseline and follow-up kurtosis values, with a p of 0.002; more in detail, mean values of kurtosis were 2.2 ± 1.907 (median 1.805; IQR = 0.785–3.445) at baseline and 1.775 ± 1.695 (median 1.885; IQR = 0.172–3.177) at follow-up (Figure 3). Between baseline and follow-up skewness values, Wilcoxon analysis also showed a significative difference (p = 0.007), with mean values of 1.366 ± 0.505 (median 1.37; IQR = 0.955–1.670) at baseline and 1.239 ± 0.568 (median 1.395; IQR = 0.790–1.675) at follow-up (Figure 3).
Figure 3.
Box-and-whisker analysis for baseline and follow-up kurtosis (a) and skewness (b) values—in the PF group. NPF, non-progressive fibrosing; PF, progressive fibrosing.
No significant differences were observed in the PF group—comparing HAA% −600 values and HAA% −700 values (p = 0.08 and p = 0.148, respectively); mean values of HAA% −600 were 24.125 ± 13.119 (median 20.755; IQR = 14.94–28.05) at baseline and 27.563 ± 17.763 (median 20.65; IQR = 15.002–36.645). For HAA% −700, we reported mean values of 40.446 ± 18.626 (median 37.5; IQR = 27.64–45.157) at baseline and 43.52 ± 21.287 (median 38.04; IQR = 26.422–56.805).
Pearson analysis
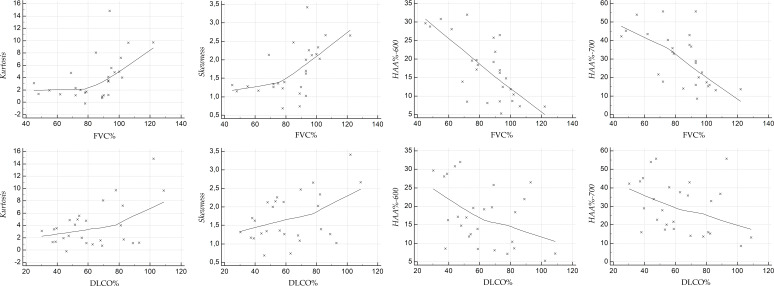
At baseline, for all patients we reported a weak correlation between kurtosis and FVC (r = 0.368, p = 0.009) and a moderate correlation between kurtosis and DLCO (r = 0.54, p = 0.00006); regarding skewness and PFTs, we found a positive weak correlation with FVC (r = 0.391, p = 0.00538), whereas a moderate degree correlation was observed with DLCO (r = 0.559, p = 0.00003). Negative moderate correlations were observed between HAA% −600 and PFTs values (r = −0.418 for FVC, p = 0.0028 and r = −0.507 for DLCO, p = 0.0002), and between HAA% −700 and PFTs values (r = −0.4254 for FVC, with a p = 0.002; r = −0.491 for DLCO, with a p = 0.00034) (Table 3).
Table 3.
Pearson analysis for all patients.
| All patients | ||||
|---|---|---|---|---|
| FVCa% baseline | DLCOb% baseline | FVCa% follow-up | DLCOb% follow-up | |
| Kurtosis | 0.368 (0.009) |
0.54 (0.00006) |
0.466 (0.00073) |
0.486 (0.0005) |
| Skewness | 0.391 (0.00538) |
0.559 (0.00003) |
0.525 (0.00011) |
0.496 (0.00038) |
| HAAc% −600 | −0.418 (0.0028) |
−0.507 (0.0002) |
−0.564 (0.00002) |
−0.46 (0.0011) |
| HAAc% −700 | −0.4254 (0.002) |
−0.491 (0.00034) |
−0.601 (<0.00001) |
−0.397 (0.00571) |
Baseline and follow-up Pearson analysis for all patients, between HRCT indexes (Kurtosis, Skewness, HAA% −600, HAA% −700) and functional values. Levels of significance for each correlation are reported in brackets.
FVC, forced vital capacity.
DLCO, diffusion capacity of the lungs for carbon monoxide.
HAA, high attenuation area.
At 1-year follow-up, almost all correlations values between kurtosis, skewness and HAA% and PFTs were moderate (Table 3): positive values were found between kurtosis and FVC (r = 0.466, p = 0.00073), kurtosis and DLCO (r = 0.486, p = 0.0005), skewness and FVC (r = 0.525, p = 0.00011), and skewness and DLCO (r = 0.496, p = 0.00038). Negative values of correlations were reported for HAA% −600 and FVC (r = −0.564, p = 0.00002), HAA% −600 and DLCO (r = −0.46, p = 0.0011) and for HAA% −700 and FVC (r = −0.601, p < 0.00001); weak correlation was found between HAA% −700 and DLCO (r = −0.397, p = 0.00571).
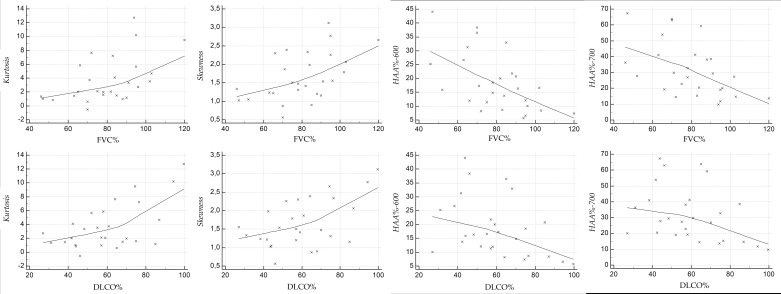
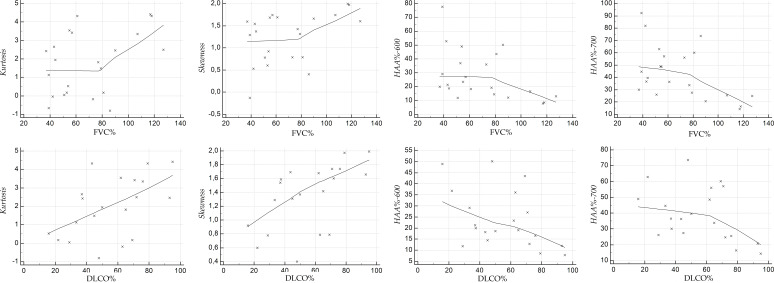
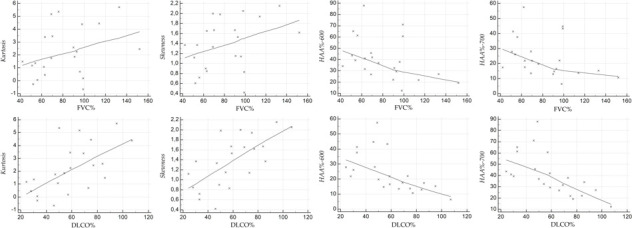
Scatterplots illustrate the relationship between the HRCT indexes and PFT values, at baseline (Figure 4 for NPF group, and Figure 5 for PF group), and at follow-up (Figure 6 for NPF group and Figure 7 for PF group).
Figure 4.
Scatter plot showing the correlation between HRCT indexes and PFTs at baseline, for NPF group. HRCT, high-resolution CT; NPF, non-progressive fibrosing; PFT, pulmonary function test.
Figure 5.
Scatter plot showing the correlation between HRCT indexes and PFTs at baseline, for PF group. HRCT, high-resolution CT; PF, progressive fibrosing; PFT, pulmonary function test.
Figure 6.
Scatter plot showing the correlation between HRCT indexes and PFTs at follow-up, for NPF group. HRCT, high-resolution CT; NPF, non-progressive fibrosing; PFT, pulmonary function test.
Figure 7.
Scatter plot showing the correlation between HRCT indexes and PFTs at follow-up, for PF group. HRCT, high-resolution CT; PF, progressive fibrosing; PFT, pulmonary function test.
For NPF group (Table 4, Figure 4), moderate correlations were observed at baseline between kurtosis and FVC (r = 0.515, p = 0.0059), kurtosis and DLCO (r = 0.587, p = 0.001), skewness and FVC (r = 0.519, p = 0.0054), skewness and DLCO (r = 0.52, p = 0.005), HAA% −600 and FVC (r = −0.573, p = 0.001), HAA% −600 and DLCO (r = −0.417, p = 0.03), and HAA%−700 and FVC (r = −0.513, p = 0.006). A weak correlation was found between HAA% −700 and DLCO (r = −0.367, p = 0.059).
Table 4.
Pearson analysis for NPF group
| NPF group | ||||
|---|---|---|---|---|
| FVCa% baseline | DLCOb% baseline | FVCa% follow-up | DLCOb% follow-up | |
| Kurtosis | 0.515 (0.0059) | 0.587 (0.001) | 0.511 (0.006) | 0.487 (0.009) |
| Skewness | 0.519 (0.0054) | 0.52 (0.005) | 0.551 (0.002) | 0.439 (0.021) |
| HAAc% - 600 | −0.573 (0.001) | −0.417 (0.03) | −0.695 (0.00006) | −0.436 (0.022) |
| HAAc% - 700 | −0.513 (0.006) | −0.367 (0.059) | −0.616 (0.00061) | −0.342 (0.08) |
Baseline and follow-up Pearson analysis between HRCT indexes (Kurtosis, Skewness, HAA% - 600, HAA% - 700) and functional values (FVC % and DLCO %) in non-progressive fibrosing group. Levels of significance for each correlation are reported in brackets.
FVC, forced vital vapacity.
DLCO, diffusion capacity of the lungs for carbon monoxide.
HAA, high attenuation area.
At follow-up (Figure 6), we have observed strong relationships between HAA% −600 and FVC (r value of −0.695, p = 0.00006), and between HAA% −700 and FVC (r = −0.616, p = 0.00061). Moderate correlations were found between skewness and FVC (r = 0.551, p = 0.002), skewness and DLCO (r = 0.439, p = 0.021), kurtosis and FVC (r = 0.511, p = 0.006), kurtosis and DLCO (r = 0.487, p = 0.009), and HAA% −600 and DLCO (r = −0.436, p = 0.022). There was only a weak correlation between HAA%−700 and DLCO (r value of −0.342, p = 0.08). For PF group (Table 5), at baseline (Figure 5) weak positive correlations were found between kurtosis and FVC (r = 0.34, p = 0.12), skewness and FVC (r = 0.359, p = 0.1) and HAA% −600 and FVC (r = −0.358, p = 0.1); strong and significant correlations—revealed at baseline in the PF group—were found between DLCO and skewness (r = 0.672, p = 0.0006), and between DLCO and HAA% −700 (r = −0.626, p = 0.001). The other correlations were graded as moderate: r = −0.412 and p = 0.056 for HAA% −700 and FVC; r = 0.595 with p = 0.0034 for kurtosis and DLCO; r = −0.598 with p = 0.003 for HAA% −600 and DLCO). At follow-up (Figure 7), kurtosis showed weak correlation with FVC (r = 0.397, p = 0.067); a weak correlation was found between HAA% −700 and DLCO (r = −0.4, p = 0.08). Moderate correlations were observed between kurtosis and DLCO (r = 0.516, p = 0.019), skewness and FVC (r = 0.432, p = 0.044), skewness and DLCO (r = 0.568, p = 0.008), HAA% −600 and FVC (r = −0.448, p = 0.036), HAA% −700 and FVC (r = −0.519, p = 0.013) and HAA% −600 and DLCO (r = −0.451, p = 0.045).
Table 5.
Pearson analysis for PF group.
| PF group | ||||
|---|---|---|---|---|
| FVCa% baseline | DLCOb% baseline | FVCa% follow-up | DLCOb% follow-up | |
| Kurtosis | 0.34 (0.12) | 0.595 (0.003) | 0.397 (0.067) | 0.516 (0.019) |
| Skewness | 0.359 (0,1) | 0.672 (0.0006) | 0.432 (0.044) | 0.568 (0.008) |
| HAAc% - 600 | −0.358 (0,1) | −0.598 (0.003) | −0.448 (0,036) | −0.451 (0.045) |
| HAAc% - 700 | −0.412 (0,056) | −0.626 (0.001) | −0.519 (0.013) | −0.4 (0.08) |
Baseline and follow-up Pearson analysis between HRCT indexes (Kurtosis, Skewness, HAA% - 600, HAA% - 700) and functional values (FVC % and DLCO %) in progressive fibrosing group. Levels of significance for each correlation are reported in brackets.
FVC, forced vital capacity.
DLCO, diffusion capacity of the lungs for carbon monoxide.
HAA, high attenuation area.
Mann–Whitney tests
At baseline, Mann–Whitney U-test analysis did not report significative differences between NPF and PF groups—for kurtosis (p = 0.14), skewness (p = 0.15), HAA% −600 (p = 0.09) and HAA% −700 (p = 0.07).
At follow-up, the Mann–Whitney U-test analysis reported a significative difference between NPF and PF groups for HAA% −600 (p = 0.04), HAA% −700 (p = 0.02) and kurtosis (p = 0.0292); for skewness, a p-value of 0.067 was reported. More in detail, median values of HAA% −600 were respectively 17.02 (95% CI = 11.76–19.86) for NPF group and 20.65 (95% CI = 16.41–36.09) for PF group; median values of HAA% −700 were respectively 28.9 (95% CI = 17.67–37.81) for NPF group and 38.04 (95% CI = 27.41–56.11) for PF group. Finally, the median values of kurtosis were respectively 3.09 (95% CI = 1.55–4.77) for NPF group and 1.885 (95% CI = 0.17–2.69) for PF group.
ROC analysis
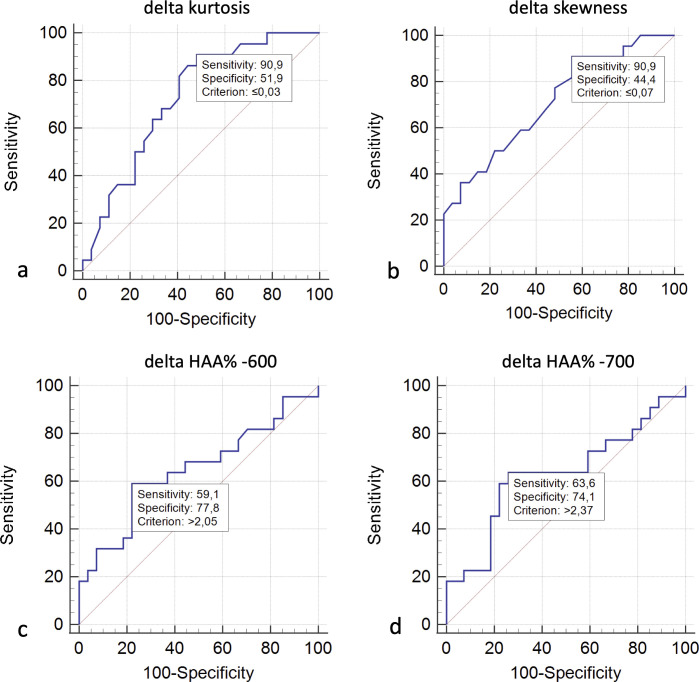
For predicting progressing phenotype, receiver operating characteristic (ROC) curve analysis (Figure 8) reported: a sensitivity of 90.9% and a specificity of 51.9%, with area under the curve (AUC) of 0.730 (p = 0.0015) – using a threshold value of δ kurtosis ≤0.03; a sensitivity of 90.9% and a specificity of 44.4%, with AUC value of 0.714 (p = 0.0038)—using a δ skewness value of ≤−0.07; a sensitivity of 59.1% and a specificity of 77.8%, with AUC of 0.647 (with no significant level—p = 0.075)—using a positive δ HAA% −600 threshold value ≥2.05; a sensitivity of 63.6% and a specificity of 74.1%, with AUC of 0.631 (p = 0.121)—using a positive δ HAA% −700 threshold value of ≥2.37.
Figure 8.
ROC analysis and AUC curves for predicting progressing phenotype—using δ kurtosis (a), δ skewness (b), δ HAA% −600 (c) and δ HAA% −700 (d). ROC, Receiver Operating Characteristic Curve; AUC, area under the curve; HAA, high attenuation area; ROC, receiver operating characteristic.
Table legends
Discussion
Based on moderate or strong degrees of correlations found at follow-up, our results promote quantitative histogram analyses as a reliable method to monitor disease evolution; since that all follow-up r values ranged from 0.4 to 0.695, the quantitative evaluation could be used in some clinical contexts—in example namely when qualitative assessment is not perfectly aligned with functional evaluations, or when qualitative assessment could be influenced by no high level of radiologist’s expertise. The relationship between quantitative HRCT parameters and PFT values has been extensively investigated in recent years, and several papers have emphasized the role of HRCT quantitative analysis in the assessment of IPF prognosis and progression. 2,10,17–19
First of all, the physiological impairment which occurs in IPF patients has been correlated with quantitative indexes; kurtosis, skewness, HAA% and mean lung attenuation have shown a moderate degree of correlation with PFT results (total lung capacity, FVC, diffusing lung capacity, forced expiratory volume in 1 s)—as reported by Best et al. in 2003. 17 The correlation has demonstrated r values which range from 0.37 up to 0.53. The histogram-based analysis could be considered as a valid diagnostic tool for monitoring diseases, even if the authors proposed its employment in multi-institutional non-spirometrically controlled study. 17
Other quantitative HRCT applications have been developed not only for the monitoring of disease but also for prognosis and diagnostic stratification. 20 In a recent paper written by Romei et al, 21 the role of a quantitative analysis using CALIPER software has been evaluated in the identification of HRCT thresholds able to predict IPF patients’ survival and lung function decline; the correlation between HRCT abnormalities and FVC has been analyzed. 21
CALIPER-derived interstitial lung disease (ILD%) extent and pulmonary vascular related structures changes at follow-up have shown a strong degree of correlation with FVC variations: more in detail, the radiological progression assessed by CALIPER was different in treated and untreated patients, with a value of ILD% progression equal to 0.067% /month in the treated group and equal to 0.372% in the untreated group. 21 Based on these results, the progression of disease in IPF patients could be assessed by quantitative analysis; in the follow-up evaluation, ILD% extent and pulmonary vascular related structures changes reported a strong correlation with FVC changes—showing a r2 values of 0.35 and 0.19 respectively. 21
The impact of serial CT imaging in monitoring disease progression needs to be further investigated: as reported by Walsh et al., a visual analysis could be influenced by a certain degree of variability in the results. 22 However, the combination of visual analysis and quantitative HRCT evaluation could reduce this heterogeneity of observations, as reported in a recent paper by Saldana et al. 23 In this work, disease extent and progression of systemic sclerosis-associated interstitial lung disease were assessed using quantitative CT. More in detail, the association between HAA%, kurtosis, skewness and mean lung attenuation (MLA) and physiological parameters, visual CT evaluation and survival were analyzed. 23 In a total of 503 CT scans SSc-ILD patients—as reported in the paper by Saldana et al. “HAA, skewness, kurtosis, and MLA were associated with lung function and visual fibrosis scores, using both baseline and change data”. 23 The changes of HAA% and MLA were associated with survival after adjustment for age, sex, pack-years, and change in visual CT. According to this recent published study, quantitative assessment is related to visual score and physiologic impairment in SSc-ILD patients. 23
The mean interval time—to assess the evolution of disease and its progression—varies across the different published studies; based on the IMPULSIS trial, there is an emerging need for quick and accurate identification of a progression phenotype diseases, which should be assessed in a period of 52 weeks. 4 In our analysis, early phenotypes of progression fibrosis have been evaluated adopting a mean interval time between baseline and follow-up CT examinations equal to 14 months in both groups (PF and NPF); in some previously published researches, quantitative assessment has analyzed the association between functional respiratory tests and quantitative HRCT indexes in longer intervals, ranging from 465 up to 1140 days. 2,10,17,24 In our study, we have investigated the role of histogram-based HRCT analysis in the assessment of disease progression considering an interval time of about 1 year between HRCT examinations: this fact should be considered of particularly importance, since that recent trials have demonstrated an emerging demand for early identification of the progressive phenotype of fibrosis.
In our study, considering skewness and kurtosis, we have found Pearson correlation values ranging from 0.368 to 0.559 at baseline, and from 0.466 to 0.525 at follow-up. At follow-up, correlations show a certain homogeneity of results in NPF group, with moderate or strong levels of relationships—except for DLCO and HAA% −700 (r = −0.342). In the same group, we have observed stable values of DLCO and FVC, having average values of DLCO and FVC equal to 60 ± 18.63 and 80 ± 17.5 at baseline, and equal to 62.55 ± 21.15 and 84.25 ± 18 at follow-up; these functional values agree with the visual HRCT assessment of fibrosis—since that these patients have been labeled as “non-progressing”— without increased extent of fibrosis on imaging. On histogram-based analysis, a slight increase of kurtosis (from 3.67 to 3.887), and skewness (from 1.66 to 1.7) were appreciable.
HAA% −600 and HAA% −700 values have shown slight changes with average values of 18.57 and 31.75 at baseline, and 17.317 and 29.971 at follow-up evaluation.
However, relationships between PFTs and HRCT indexes are still controversial, as reported in literature: Taha et al have reported that “no individual pulmonary function test closely reflects radiological progression”. 25 In our PF group, Pearson analysis at baseline reported a certain heterogeneity of results, with no significant values between FVC and histogram indexes; moderate and significant degrees of correlations were found between DLCO and HRCT indexes—ranging from 0.595 up to 0.672. At follow-up, correlations between FVC and skewness, FVC and HAA% −600 and FVC and HAA% −700 increased—reaching significant level of p values; an inverse trend was observed between DLCO and HRCT indexes. However, Wilcoxon analysis showed a significant difference between baseline and follow-up kurtosis values, with a p of 0.002; more in detail, mean values of kurtosis changed from 2.20 (median 1.8) up to 1.77 ± 1.69 (median 1.88) at follow-up. Based on our results, in presence of worsening of respiratory symptoms and decreased FVC and/or DLCO values, we could label a patient as “progressive”—even if we do not have strong relationships with HRCT indexes: the degree of correlation obtained at follow-up in progressive group was only moderate, and at baseline it was predominantly assessed on weak levels.
The progression, in our population study, was only defined according to the clinical and functional domains released by recent guidelines; in this regard, further studies are needed to explore the possibility of disease progression in subjects having worsening of clinical symptoms and increased radiological features—but with stable levels of PFTs. 26
Based on published guidelines, 13,27 the clinical scenario has enforced the concept of the so-called “mister IPF”, an individual who combines clinical probability and radiological features. In this regard, the clinical probability is embedded in the diagnosis of IPF, since that several morphological patterns of UIP probable—even without honeycomb areas—could be labeled as IPF diagnosis when adequate clinical context is found (age >60 years old, no exposure to known causes of fibrosing factors or history of previous drugs, environmental exposures). Another perspective, could enforce the possibility to achieve an evaluation of the progressive phenotype of disease in non-IPF patients: probably, if the clinical judge is able to define the identikit of mister IPF, a quantitative analysis could parallelly help clinicians and radiologists to assess the new category of patients with fibrosis—the “Mr/Mrs progressing phenotype”—on the basis of imaging quantitative features and clinical worsening.
Unfortunately, our study presents limitations, and is conditioned by several factors: first of all, number of recruited patients is very small, so further analysis is needed to confirm and validate our results. Being a retrospective analysis, the small number of patients included is also related to the different range time of HRCT evaluation: in some cases, non-IPF diagnosis are not evaluated at 1 year from the diagnosis, so that a prospective evaluation should be planned to require a larger number of subjects. Finally, we have drastically reduced the number of HRCT evaluations from our database—since that examinations acquired with different scanners have not been included. In this regard, the variability of results, which could be conditioned by different types of scanner, need to be adequately assessed.
Conclusion
Quantitative analysis may be used to assess the progressing phenotype of non-IPF disease, increasing the diagnostic capability of thoracic radiologists in the assessment of disease evolution—at 1 year of time from baseline CT scan. Further analysis is needed, in order to establish if the quantitative approach could effectively assess disease progression, in subjects having stable levels of PFTs but worsening of symptoms.
Key points:
Interstitial lung diseases may exhibit progression independently from their classification.
HRCT quantitative analysis is able to assess progression of fibrosing pattern.
Moderate correlations have reported between HRCT indexes and pulmonary function tests.
Footnotes
Acknowledgements: Authors have no acknowledgements for this manuscript.
Competing interests: SP reports personal consulting fees and/or speaker fees from Boehringer Ingelheim, F. Hoffmann-La Roche Ltd., Elma Research srl, Metanoic Health Limited and DOT tech srl outside the submitted work; he also received support for attending meetings and/or travel by Bracco Imaging spa, Bayer Schering, Eclat srl and Fondazione Menarini, not related with this submitted work. GS reports personal fees from Boehringer Ingelheim outside the submitted work. CV is part of the F. Hoffmann-La Roche Ltd. and Boehringer Ingelheim Scientific board. He has received consulting fees and/or speaker fees from AstraZeneca, Boehringer Ingelheim, Chiesi, F. Hoffmann-La Roche Ltd and Menarini.
Ethics approval and consent to participate: Being a retrospective study, based on quantitative analysis, this study did not need approval by institutional review board.
Availability of data and materials: The datasets used and/or analysed during the current study are available from the corresponding author on reasonable request.
Authors' contributions: SP, FT and FG prepared and wrote the manuscript; SP, FT, FG and LR revised the manuscript; SP, FT, FG, ST, LR, GS, AV, GV and CS collected data from articles and database. SP, FG, GF, AF and LAM have performed radiological examinations and histogram based analyses. SP, FT, FG, ST and LR prepared figures and captions. SP, FT and FG prepared the tables. SP, PVF, CV, and AB revised the final draft. All authors have read and approved the submission of the final draft.
Contributors: SP, FT and FG prepared and wrote the manuscript; SP, FT, FG and LR revised the manuscript; SP, FT, FG, ST, LR, GS, AV, GV and CS collected data from articles and database. SP, FG, GF, AF and LAM have performed radiological examinations and histogram based analyses. SP, FT, FG, ST and LR prepared figures and captions. SP, FT and FG prepared the tables. SP, PVF, CV, and AB revised the final draft. All authors have read and approved the submission of the final draft.
Data Availability: The datasets used and/or analysed during the current study are available from the corresponding author on reasonable request.
Contributor Information
Stefano Palmucci, Email: spalmucci@unict.it, spalmucci@sirm.org.
Francesco Tiralongo, Email: tiralongofrancesco91@hotmail.it.
Federica Galioto, Email: federicagalioto91@gmail.com.
Stefano Toscano, Email: stefano.toscano91@gmail.com.
Linda Reali, Email: realilinda@gmail.com.
Carlotta Scavone, Email: tottascavone.3010@gmail.com.
Giulia Fazio, Email: giuliafazio8@gmail.com.
Agata Ferlito, Email: agataferlito91@gmail.com.
Gianluca Sambataro, Email: dottorsambataro@gmail.com.
Ada Vancheri, Email: adact1@hotmail.it.
Enrico Sciacca, Email: esciacca29@gmail.com.
Giovanna Vignigni, Email: giovannavignigni@gmail.com.
Carla Spadaro, Email: carlaspadaro@live.it.
Letizia Antonella Mauro, Email: mauroletizia@tiscali.it.
Pietro Valerio Foti, Email: pietrofoti@hotmail.com.
Carlo Vancheri, Email: vancheri@unict.it.
Antonio Basile, Email: basile.antonello73@gmail.com.
REFERENCES
- 1. Cottin V, Wollin L, Fischer A, Quaresma M, Stowasser S, Harari S. Fibrosing interstitial lung diseases: knowns and unknowns. Eur Respir Rev 2019; 28(): 180100. doi: 10.1183/16000617.0100-2018 [DOI] [PMC free article] [PubMed] [Google Scholar]
- 2. Torrisi SE, Pavone M, Vancheri A, Vancheri C. When to start and when to stop antifibrotic therapies. Eur Respir Rev 2017; 26(): 170053. doi: 10.1183/16000617.0053-2017 [DOI] [PMC free article] [PubMed] [Google Scholar]
- 3. Makino S. Progressive fibrosing interstitial lung diseases: a new concept and indication of nintedanib. Mod Rheumatol 2021; 31: 13–19. doi: 10.1080/14397595.2020.1826665 [DOI] [PubMed] [Google Scholar]
- 4. Flaherty KR, Wells AU, Cottin V, Devaraj A, Walsh SLF, Inoue Y, et al. Nintedanib in progressive fibrosing interstitial lung diseases. N Engl J Med 2019; 381: 1718–27. doi: 10.1056/NEJMoa1908681 [DOI] [PubMed] [Google Scholar]
- 5. Wells AU, Brown KK, Flaherty KR, Kolb M, Thannickal VJ, IPF Consensus Working Group . What's in a name? That which we call IPF, by any other name would act the same. Eur Respir J 2018; 51(): 1800692. doi: 10.1183/13993003.00692-2018 [DOI] [PubMed] [Google Scholar]
- 6. Cottin V. Treatment of progressive fibrosing interstitial lung diseases: a milestone in the management of interstitial lung diseases. Eur Respir Rev 2019; 28(): 190109. doi: 10.1183/16000617.0109-2019 [DOI] [PMC free article] [PubMed] [Google Scholar]
- 7. Cottin V, Hirani NA, Hotchkin DL, Nambiar AM, Ogura T, Otaola M, et al. Presentation, diagnosis and clinical course of the spectrum of progressive-fibrosing interstitial lung diseases. Eur Respir Rev 2018; 27(): 180076. doi: 10.1183/16000617.0076-2018 [DOI] [PMC free article] [PubMed] [Google Scholar]
- 8. Maher TM, Corte TJ, Fischer A, Kreuter M, Lederer DJ, Molina-Molina M, et al. Pirfenidone in patients with unclassifiable progressive fibrosing interstitial lung disease: design of a double-blind, randomised, placebo-controlled phase II trial. BMJ Open Respir Res 2018; 5: e000289. doi: 10.1136/bmjresp-2018-000289 [DOI] [PMC free article] [PubMed] [Google Scholar]
- 9. Raghu G, Remy-Jardin M, Richeldi L, Thomson CC, Inoue Y, Johkoh T, et al. Idiopathic pulmonary fibrosis (an update) and progressive pulmonary fibrosis in adults: an official ATS/ERS/JRS/ALAT clinical practice guideline. Am J Respir Crit Care Med 2022; 205: e18–47. doi: 10.1164/rccm.202202-0399ST [DOI] [PMC free article] [PubMed] [Google Scholar]
- 10. Ash SY, Harmouche R, Vallejo DLL, Villalba JA, Ostridge K, Gunville R, et al. Densitometric and local Histogram based analysis of computed tomography images in patients with idiopathic pulmonary fibrosis. Respir Res 2017; 18(): 45. doi: 10.1186/s12931-017-0527-8 [DOI] [PMC free article] [PubMed] [Google Scholar]
- 11. Kolta MF, Goneimy MBI. Visual and quantitative assessment of HRCT pulmonary changes in idiopathic interstitial pneumonia with PFT correlation. Egypt J Radiol Nucl Med 2020; 51: 38. doi: 10.1186/s43055-020-0142-4 [DOI] [Google Scholar]
- 12. Torrisi SE, Palmucci S, Stefano A, Russo G, Torcitto AG, Falsaperla D, et al. Assessment of survival in patients with idiopathic pulmonary fibrosis using quantitative HRCT indexes. Multidiscip Respir Med 2018; 13: 43. doi: 10.1186/s40248-018-0155-2 [DOI] [PMC free article] [PubMed] [Google Scholar]
- 13. Raghu G, Remy-Jardin M, Myers JL, Richeldi L, Ryerson CJ, Lederer DJ, et al. Diagnosis of idiopathic pulmonary fibrosis. an official ATS/ERS/JRS/ALAT clinical practice guideline. Am J Respir Crit Care Med 2018; 198: e44–68. doi: 10.1164/rccm.201807-1255ST [DOI] [PubMed] [Google Scholar]
- 14. Fedorov A, Beichel R, Kalpathy-Cramer J, Finet J, Fillion-Robin J-C, Pujol S, et al. 3D slicer as an image computing platform for the quantitative imaging network. Magn Reson Imaging 2012; 30: 1323–41. doi: 10.1016/j.mri.2012.05.001 [DOI] [PMC free article] [PubMed] [Google Scholar]
- 15. Salaffi F, Carotti M, Di Donato E, Di Carlo M, Ceccarelli L, Giuseppetti G. Computer-aided tomographic analysis of interstitial lung disease (ILD) in patients with systemic sclerosis (SSC). correlation with pulmonary physiologic tests and patient-centred measures of perceived dyspnea and functional disability. PLoS One 2016; 11: e0149240. doi: 10.1371/journal.pone.0149240 [DOI] [PMC free article] [PubMed] [Google Scholar]
- 16. Habibzadeh F. Statistical data editing in scientific articles. J Korean Med Sci 2017; 32: 1072–76. doi: 10.3346/jkms.2017.32.7.1072 [DOI] [PMC free article] [PubMed] [Google Scholar]
- 17. Best AC, Lynch AM, Bozic CM, Miller D, Grunwald GK, Lynch DA. Quantitative CT indexes in idiopathic pulmonary fibrosis: relationship with physiologic impairment. Radiology 2003; 228: 407–14. doi: 10.1148/radiol.2282020274 [DOI] [PubMed] [Google Scholar]
- 18. Loeh B, Brylski LT, von der Beck D, Seeger W, Krauss E, Bonniaud P, et al. Lung CT densitometry in idiopathic pulmonary fibrosis for the prediction of natural course, severity, and mortality. Chest 2019; 155: 972–81. doi: 10.1016/j.chest.2019.01.019 [DOI] [PubMed] [Google Scholar]
- 19. Nakagawa H, Nagatani Y, Takahashi M, Ogawa E, Tho NV, Ryujin Y, et al. Quantitative CT analysis of honeycombing area in idiopathic pulmonary fibrosis: correlations with pulmonary function tests. Eur J Radiol 2016; 85: 125–30. doi: 10.1016/j.ejrad.2015.11.011 [DOI] [PubMed] [Google Scholar]
- 20. Jacob J, Bartholmai BJ, Rajagopalan S, van Moorsel CHM, van Es HW, van Beek FT, et al. Predicting outcomes in idiopathic pulmonary fibrosis using automated computed tomographic analysis. Am J Respir Crit Care Med 2018; 198: 767–76. doi: 10.1164/rccm.201711-2174OC [DOI] [PMC free article] [PubMed] [Google Scholar]
- 21. Romei C, Tavanti LM, Taliani A, De Liperi A, Karwoski R, Celi A, et al. Automated computed tomography analysis in the assessment of idiopathic pulmonary fibrosis severity and progression. Eur J Radiol 2020; 124: 108852. doi: 10.1016/j.ejrad.2020.108852 [DOI] [PubMed] [Google Scholar]
- 22. Walsh SLF, Devaraj A, Enghelmayer JI, Kishi K, Silva RS, Patel N, et al. Role of imaging in progressive-fibrosing interstitial lung diseases. Eur Respir Rev 2018; 27(): 180073. doi: 10.1183/16000617.0073-2018 [DOI] [PMC free article] [PubMed] [Google Scholar]
- 23. Saldana DC, Hague CJ, Murphy D, Coxson HO, Tschirren J, Peterson S, et al. Association of computed tomography densitometry with disease severity, functional decline, and survival in systemic sclerosis-associated interstitial lung disease. Ann Am Thorac Soc 2020; 17: 813–20. doi: 10.1513/AnnalsATS.201910-741OC [DOI] [PubMed] [Google Scholar]
- 24. Tanizawa K, Handa T, Nagai S, Hirai T, Kubo T, Oguma T, et al. Clinical impact of high-attenuation and cystic areas on computed tomography in fibrotic idiopathic interstitial pneumonias. BMC Pulm Med 2015; 15: 74. doi: 10.1186/s12890-015-0069-0 [DOI] [PMC free article] [PubMed] [Google Scholar]
- 25. Taha N, D’Amato D, Hosein K, Ranalli T, Sergiacomi G, Zompatori M, et al. Longitudinal functional changes with clinically significant radiographic progression in idiopathic pulmonary fibrosis: are we following the right parameters? Respir Res 2020; 21: 119. doi: 10.1186/s12931-020-01371-7 [DOI] [PMC free article] [PubMed] [Google Scholar]
- 26. Oda K, Ishimoto H, Yatera K, Naito K, Ogoshi T, Yamasaki K, et al. High-resolution CT scoring system-based grading scale predicts the clinical outcomes in patients with idiopathic pulmonary fibrosis. Respir Res 2014; 15(): 10. doi: 10.1186/1465-9921-15-10 [DOI] [PMC free article] [PubMed] [Google Scholar]
- 27. Lynch DA, Sverzellati N, Travis WD, Brown KK, Colby TV, Galvin JR, et al. Diagnostic criteria for idiopathic pulmonary fibrosis: a fleischner society white paper. Lancet Respir Med 2018; 6: 138–53. doi: 10.1016/S2213-2600(17)30433-2 [DOI] [PubMed] [Google Scholar]
Associated Data
This section collects any data citations, data availability statements, or supplementary materials included in this article.
Data Availability Statement
Availability of data and materials: The datasets used and/or analysed during the current study are available from the corresponding author on reasonable request.


