Abstract
Knowledge of the mechanism of pressure-induced inactivation of microorganisms could be helpful in defining an effective, relatively mild pressure treatment as a means of decontamination, especially in combination with other physical treatments or antimicrobial agents. We have studied the effect of high pressure on Lactobacillus plantarum grown at pH 5.0 and 7.0. The classical inactivation kinetics were compared with a number of events related to the acid-base physiology of the cell, i.e., activity of F0F1 ATPase, intracellular pH, acid efflux, and intracellular ATP pool. Cells grown at pH 5.0 were more resistant to pressures of 250 MPa than were cells grown at pH 7.0. This difference in resistance may be explained by a higher F0F1 ATPase activity, better ability to maintain a ΔpH, or a higher acid efflux of the cells grown at pH 5.0. After pressure treatment at 250 MPa, the F0F1 ATPase activity was decreased, the ability to maintain a ΔpH was reduced, and the acid efflux was impaired. The ATP pool increased initially after mild pressure treatment and finally decreased after prolonged treatment. The observations on acid efflux and the ATP pool suggest that the glycolysis is affected by high pressure later than is the F0F1 ATPase activity. Although functions related to the membrane-bound ATPase activity were impaired, no morphological changes of the membrane could be observed.
High hydrostatic pressure offers an attractive alternative to heat pasteurization as a means of producing preservative-free, microbiologically safe and stable foods. Yeasts, molds, and vegetative cells of bacteria can be inactivated by pressures in the range of 200 to 700 MPa, and the organoleptic quality of food products is retained at these pressures (1, 8, 22). A better understanding of the effects of pressure on the cell is essential for formulation of effective pressure processes, especially when combination treatments are applied, i.e., with other physical treatments or natural antimicrobial agents. Hence, elucidation of the mechanistic aspects of high-pressure inactivation of microorganisms will help in food preservation.
Enzymes are more susceptible to pressure at low and high temperatures. The optimum temperature at which the majority of enzymes are most resistant to pressure lies between 20 and 40°C (6). Since a similar pattern has been found for pressure resistance in microorganisms (11, 24), we speculate that a target enzyme may play a role in pressure-induced inactivation of microorganisms. Furthermore, there is evidence that membranes are damaged by pressure treatment (12). The similarity between pressure-induced protein denaturation and pressure-induced inactivation of microorganisms and the observation of membrane damage at high pressure directed our attention to membrane-bound enzymes (ATPases) as a target for pressure-induced inactivation of microorganisms. The majority of ATPases have been categorized as F type (F0F1 ATPase), V type (vacuolar ATPase), P type (or E1E2 ATPase), and ABC transporters (ATP binding type ATPases). It had been shown that pressure affects the activity of ATPases in eukaryotic tissues (2, 3, 15, 19), but most of these studies addressed the P-type ATPases such as Na+/K+ ATPases. In lactic acid bacteria, which do not possess an electron transport chain, a pH gradient is maintained via a proton-translocating ATPase, i.e., the F0F1 ATPase (7, 17, 18). Marquis and Bender (16) studied the effects of relatively low hydrostatic pressure (50 MPa) on the F0F1 ATPase of isolated membranes of Enterococcus hirae (formerly Streptococcus faecalis). They concluded from their experimental data that under these conditions, the proton-translocating step, and not the ATP hydrolytic step, is inhibited by pressure.
In the present study, we investigated the effects of high pressure on Lactobacillus plantarum, a bacterium which plays a role in food fermentation but is also a well-recognized spoilage microorganism of acidic products, such as processed tomatoes and dressings for salads. Regulation of the cytoplasmic or intracellular pH (pHin) is a prerequisite for the survival and viability of lactic acid bacteria in low-pH environments such as in the food products mentioned above (20). Since the ability to generate a proton gradient is closely related to the activity of F0F1 ATPase, we investigated the effect of high pressure on the activity of F0F1 ATPase in situ before and after pressure treatment and on the ability to generate a proton gradient. Because of the relationship between proton efflux and proton gradient, we also studied the effect of pressure on acid efflux. Furthermore, the intracellular ATP amount before and after pressure treatment was measured. Transmission electron microscopy was performed to determine whether morphological changes of the membrane, e.g., separation of the cell membrane from the cell wall, occurred. The above-mentioned events were compared with CFU production, the classic indicator of the viability of the cell.
MATERIALS AND METHODS
Bacteria, growth conditions, and media.
L. plantarum LA 10-11, identified by the American Type Culture Collection, no ATCC number, is a spoilage microorganism which was isolated from onion ketchup. From our experience, we considered it necessary to use identical batches of cells in all experiments for an accurate comparison of the various pressure treatments. Therefore, cells of L. plantarum LA 10-11 (8 liters) were grown in fermentors with McFeeters chemically defined medium, modified by the addition of 0.5% (vol/vol) acetate and 1.0% (wt/vol) glucose at 30°C (13). The pH was controlled at 5.0 or 7.0 with 4 N KOH, and anaerobiosis was maintained with a 90% N2–10% CO2 mixture. Exponentially growing cells were harvested at an optical density at 660 nm (OD660) of 0.5, washed twice, and resuspended in 50 mM sodium piperazine-N,N′-bis(2-ethanesulfonate) (PIPES; pH 7.0) to a final OD660 of approximately 100, which was equivalent to 1010 CFU/ml. The concentrated cell suspension was rapidly frozen in liquid nitrogen and stored at −80°C until use.
High-pressure treatment.
Before pressure treatment, the cells were thawed at room temperature, placed on ice, and subjected to pressure treatment within 30 min. The cells were treated in an isostatic high-pressure vessel (National Force, St. Niklaas, Belgium) at 250 MPa for different periods varying from 2 to 240 min and at 350 MPa for 10 min; all treatments were performed at room temperature (24 ± 2°C). Complete compression and decompression took approximately 2 min. The number of viable cells (CFU per milliliter) was determined before and after the pressure treatments by pour plate counts in MRS agar (Merck, Darmstadt, Germany), and the plates were incubated aerobically for 5 days at 30°C.
Measurement of cytoplasmic volume and determination of ΔpH.
The cytoplasmic volume was determined from the distribution of 3H2O (0.5 MBq/mmol) and [14C]inulin (1.4 GBq/mmol) by the silicone oil centrifugation technique (21). From the data, a specific internal volume of 1.68 ± 0.37 μl/mg and an extracellular volume (adhering water after silicone oil centrifugation) of 1.69 ± 0.05 μl/mg could be calculated for the culture grown at pH 5.0. For the culture grown at pH 7.0, a specific internal volume of 1.26 ± 0.17 μl/mg and an extracellular volume of 1.24 ± 0.17 μl/mg were calculated. The ΔpH with respect to the external medium was determined from the distribution of [14C]benzoic acid (0.67 GBq/mmol) after silicone oil centrifugation. A control assay was performed, with the addition of 1 μM valinomycin (K+ ionophore, dissipates the membrane potential, ΔΨ) and 1 μM nigericin (facilitates the exchange of K+ for H+, dissipates the ΔpH), in which pHin should be equal to pHout. The intracellular pH was also determined after the addition of 1 mM DCCD (N,N′-dicyclohexylcarbodiimide; Sigma no. D3128) to the buffer.
Preparation of membrane vesicles.
Inside-out membrane vesicles were prepared as follows: 1 ml of a concentrated cell suspension (OD660 = 100) was diluted with 1 ml of 50 mM PIPES (pH 7.0) buffer containing 2.5 mM MgCl2, and the cells were disrupted by sonication (Soniprep 150; Beun de Ronde B. V., Abcoude, The Netherlands) at an amplitude of 26 μm for 20 min (cycle of 15 s of treatment and 45 s of cooling). The suspension was diluted by the addition of 50 ml of 50 mM PIPES (pH 7.0) containing 2.5 mM MgCl2. The cell debris was removed by low-speed centrifugation (7700 × g). The upper two-thirds of the supernatant was collected and centrifuged at high speed (543,000 × g). The pellets were resuspended in 500 μl of 50 mM PIPES (pH 7.0) containing 2.5 mM MgCl2. Inside-out membrane vesicles were rapidly frozen and stored in liquid nitrogen until use. The protein concentration of the membrane vesicles was determined by the method of Lowry et al. (10).
ATPase activity measurements.
ATP hydrolysis by the membrane-bound ATPase was estimated from the amount of inorganic phosphate released as described by Driessen and Konings (4). Measurements were performed at 30°C in a 25 mM morpholineethanesulfonic acid (MES)–HEPES buffer (pH 6.0) containing 50 mM KCl, 5 mM MgSO4, 1 mM dithiothreitol (Aldrich Chemie no. 15,046-0), and 10 μM carbonyl cyanide m-chlorophenylhydrazone (Aldrich Chemie no. 85,781-5). ATP (Sigma no. A 2383), at a final concentration of 4 mM, was used as the substrate. Samples of 100 μl were taken after 1, 2, and 3 min of incubation at 30°C and added to 1.6 ml of malachite green molybdate reagent (MGM reagent) with 0.1% (vol/vol) Triton X-100. After exactly 5 min of incubation at room temperature, 200 μl of 34% citric acid was added, and after a further 40 min of incubation at room temperature, the absorbance of the solution was measured at 660 nm. A calibration curve was made with a phosphorus standard solution (Sigma no. 661-9) containing 645 nmol of inorganic phosphate per ml. To confirm that F0F1 ATPase activity was measured, control experiments were performed in the presence of specific ATPase inhibitors. Vanadate (0.5 mM) was used as a P-type ATPase inhibitor, KNO3 (50 mM) was used as a V-type inhibitor, and DCCD (1 mM) was used as an F-type inhibitor. The F0F1 ATPase activity of membrane vesicles isolated from L. plantarum LA 10-11 cells was measured before and after various high-pressure treatments after the addition of 1 mM DCCD or 0.2% Triton X-100. All measurements were carried out in duplicate.
Determination of the acidification of the external medium by L. plantarum cells.
The cells were washed once with MES buffer (pH 6.5) containing 50 mM KCl, resuspended in the same buffer to a final OD660 of approximately 20, and subjected to high pressure as described above. After the treatment, the acidification test was performed at 30°C with 1 ml of the cell suspension in 18 ml of 5 mM MES buffer (pH 6.5) containing 50 mM KCl. Where necessary, glucose was added to a final concentration of 0.5% to energize the cells, and the pH was monitored continuously during incubation for 1 h, until the pH reached 6. If a pH of 6 was not reached within 1 h, the experiment was not continued. The acidification rate (nanomoles of H+ per minute per milligram of protein) was calculated from the pH drop in time compared with a calibration curve (pH versus μmol of H+, added as HCl).
Determination of the amount of intracellular ATP after energization.
The amount of intracellular ATP, before and after pressure treatment of L. plantarum LA 10-11, was determined in a Lumac no. M2500 biocounter (Perstorp Analytical, Oud-Beijerland, The Netherlands) by the luciferin-luciferase reaction. The experiments were performed as specified by the manufacturer. The cells were preincubated for 10 min at 30°C in 50 mM PIPES (pH 7.0), and after incubation for 0, 5, 10, 15, 30, or 45 min at 30°C in 50 mM PIPES (pH 7.0) containing glucose (0.2% [vol/vol]), samples were analyzed for intracellular ATP. ATP concentrations were determined from a calibration curve of relative light units plotted against ATP concentration. A value for the total intracellular [ATP] was obtained by subtracting the extracellular [ATP] from the total [ATP].
Transmission electron microscopy.
For electron microscopy, cells were grown in McFeeters medium (13) at 30°C and harvested in the exponential growth phase at an OD660 of 0.5. The cells were washed twice in 50 mM PIPES (pH 7.0) and resuspended in the same buffer to an OD660 of 1.3. This concentrated cell suspension was used for high-pressure treatments of 10 min at 150, 250, or 350 MPa. After the high-pressure treatment, the cells were immediately mixed with a few drops of 2% gelatin and fixed for 4 h at 4°C in 0.1 M PIPES buffer containing 2% glutaraldehyde (pH 7.0). The cells were postfixed for 1 h at 4°C in 2% aqueous osmium tetroxide. Prior to dehydration, all samples were treated with 1% tannic acid for 1 h at room temperature, washed with 1% sodium sulfate for 5 min, and stained with 1% uranyl acetate for 2 h at room temperature. The fixed cells were then dehydrated by transfer through a series of 50, 70, 80, 90, and 100% acetone solutions. Finally, the cells were filtered and embedded in LX112. Ultrathin sections (50 nm) were cut with a Reichert-Jung Ultracut-E ultramicrotome. The sections were poststained with uranyl acetate and lead citrate and were examined in a Philips CM12 transmission electron microscope operated at 80 kV.
RESULTS
Effect of freezing on the viability and intracellular pH of L. plantarum.
The viability of untreated and pressure-treated L. plantarum cells was determined before and after freezing as described in Materials and Methods. The same cells were also checked for their ability to maintain a ΔpH. The viable counts and the ability to maintain a ΔpH were not changed after freezing.
Effect of high pressure on the viability of L. plantarum LA 10-11 cells.
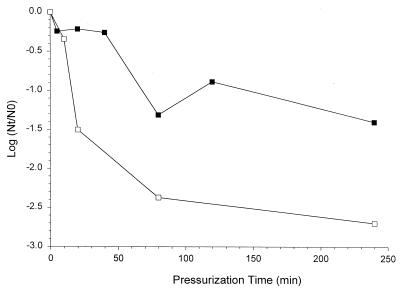
The inactivation kinetics of L. plantarum LA 10-11 after high-pressure treatment are shown in Fig. 1. The results show that cells grown at pH 5.0 are more resistant to pressure than are cells grown at pH 7.0.
FIG. 1.
Inactivation kinetics of L. plantarum LA 10-11 cells grown at pH 5.0 (▪) and pH 7.0 (□) after various pressure treatments at 250 MPa.
pH-activity profiles of F0F1 ATPase in membrane vesicles.
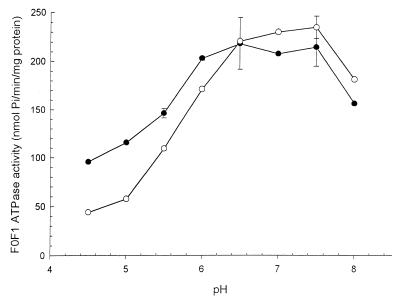
The pH-activity profiles of the ATPase in membrane vesicles from L. plantarum LA 10-11 were determined at various pH values of the standard reaction mixture (Fig. 2). The pH optimum of F0F1 ATPase activity was between 6.5 and 7.5. The ATPase activity of membrane vesicles from cells grown at pH 7.0 is lower in the pH range 4.5 to 6.0 than is the ATPase activity of cells grown at pH 5.0. Inhibitor studies were carried out to confirm that only F0F1 ATPase activity was measured and not another type of ATPase (results not shown). Hardly any inhibition of ATPase was observed in the presence of vanadate, which is a P-type ATPase inhibitor. KNO3, a V-type ATPase inhibitor, did not inhibit the measured ATPase activity. The addition of DCCD, a specific, partial inhibitor of F0F1 ATPase of gram-positive bacteria, showed the highest reduction in ATPase activity, 49% for pH 7.0-grown cells and 69% for pH 5.0-grown cells.
FIG. 2.
pH-activity profiles for the F0F1 ATPase activity of membrane vesicles obtained from L. plantarum LA 10-11 cells grown at pH 5.0 (•) and 7.0 (○). Pi, inorganic phosphate.
ATPase activity of membrane vesicles before and after high-pressure treatment.
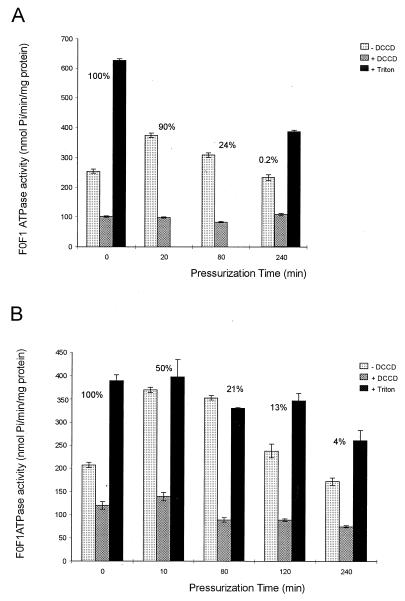
The effect of high-pressure treatment on the F0F1 ATPase activity of membrane vesicles isolated from different batches of cells grown at pH 5.0 and 7.0 is shown in Fig. 3. Contrary to our expectation, a residence time of 80 min of pressure treatment resulted in an approximately 1.2-fold increase in the ATPase activity of membrane vesicles from cells cultured at pH 5.0 (Fig. 3A) and a 1.7-fold increase for cells cultured at pH 7.0 (Fig. 3B), in comparison to untreated cells. However, after a longer residence time at the high pressure (240 min), the ATPase activity was decreased by 0.08- and 0.17-fold when the cells were grown at pH 5.0 and 7.0, respectively. A pressure treatment of 10 min at 350 MPa resulted in a reduction of 80% in the membrane ATPase activity of cells grown at pH 7.0. The addition of 1 mM DCCD to the reaction mixture containing membrane vesicles obtained from untreated cells, resulted in a decrease in ATPase activity, confirming that F0F1 ATPase activity was measured (Fig. 3). The addition of 0.2% Triton X-100 to the reaction mixture caused an increase of 2.5-fold in the F0F1 ATPase activity of membrane vesicles obtained from untreated cells grown at pH 5.0 and in an increase of 1.9-fold for cells grown at pH 7.0 (Fig. 3). Interestingly, the activity of the ATPase in membrane vesicles obtained from untreated cells at pH 7.0 treated with Triton X-100 was approximately the same as the activity observed for the membrane vesicles from cells which were pressure treated for only 10 and 80 min at 250 MPa (Fig. 3B). The addition of 0.2% Triton X-100 to the membrane vesicles from the cells that were pressure treated for 10 and 80 min resulted in only a very minor change in activity.
FIG. 3.
F0F1 ATPase activity of membrane vesicles obtained from L. plantarum LA 10-11 cells grown at pH 5.0 (A) and pH 7.0 (B) after pressure treatment at 250 MPa for 0, 10, 20, 80, 120, or 240 min, with or without the addition of 1 mM DCCD and 0.2% Triton X-100. The measurements were performed in 25 mM MES–HEPES buffer (pH 6.0). The results are the mean of two independent experiments, and the standard deviation is indicated with error bars. The percent survival after pressure treatment is indicated. Pi, inorganic phosphate.
Effect of high pressure on the intracellular pH.
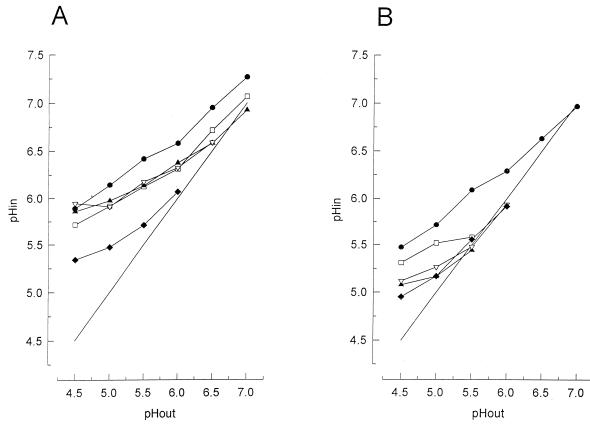
To establish whether F0F1 ATPase is important in maintaining a proton gradient, the intracellular pH was measured in the presence of DCCD. Indeed, the internal pH values were lower after the addition of DCCD (Fig. 4), indicating that F0F1 ATPase is important in generating a ΔpH. It was shown that L. plantarum LA 10-11 cells grown at pH 5.0 (Fig. 4A) maintained a greater ΔpH at low pH values than did cells grown at pH 7.0 (Fig. 4B). High-pressure treatment resulted in a drop in the intracellular pH of the cells (Fig. 4), which indicates that the regulation of the internal pH is impaired in these cells.
FIG. 4.
Ability of L. plantarum LA 10-11 cells grown at pH 5.0 (A) and pH 7.0 (B) to maintain a ΔpH at various external pH values after different durations of pressure treatment at 250 MPa. Symbols: •, 0 min; □, 0 min with the addition of 1 mM DCCD; ▴, 10 min, survival 99% (A) and 3.6% (B); ▿, 20 min, survival 41% (A) and 0.11% (B); ⧫, 80 min, survival 6.8% (A) and 0.0032% (B); —, line to indicate pHin = pHout. The percent survival is calculated by [N (number of cells after pressure)/N (number of cells before pressure)] × 100.
Effect of pressure on the acidification rate by L. plantarum LA 10-11 cells.
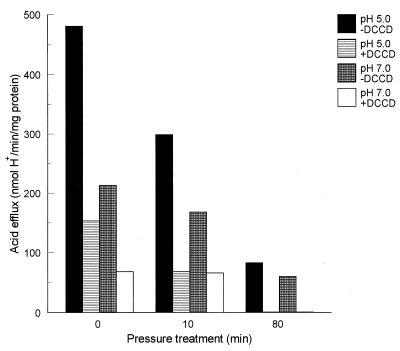
The relative acidification rate of cells grown at pH 7.0 was considerably lower than that of cells grown at pH 5.0. Furthermore, for both culture conditions, the acidification rate decreased after pressure treatment (Fig. 5). The efflux of protons both before and after high-pressure treatment was largely inhibited by DCCD (Fig. 5), suggesting that at least a part of the F0F1 ATPase was still active after high-pressure treatment, in accordance with the F0F1 ATPase activity measurements described above.
FIG. 5.
Acid efflux, in a 5 mM MES–50 mM KCl buffer (pH 6.5) after energization with glucose, of the L. plantarum LA 10-11 cells grown at pH 5.0 without and with DCCD added to the buffer and of the pH 7.0-grown cells without and with DCCD added to the buffer. The experiments were performed after high-pressure treatment at 250 MPa for 0, 10, or 80 min. The percent survival was 100, 111, and 10% (pH 5.0) and 100, 65, and 1% (pH 7.0). The percent survival is calculated by [N (number of cells after pressure)/N (number of cells before pressure)] × 100.
Amount of intracellular ATP after high-pressure treatment.
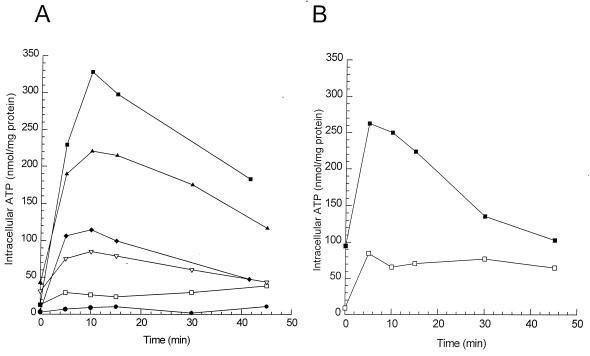
The results of the intracellular ATP measurements after energization with 0.2% glucose after different high-pressure treatments are shown in Fig. 6. After mild pressure treatments, an increase in the intracellular ATP pools was observed. This increase was higher in cells grown at pH 5.0 (Fig. 6A) than in cells grown at pH 7.0 (Fig. 6B). However, after more severe pressure treatments of cells grown at pH 5.0, this increase was no longer observed and hardly any ATP could be detected at the longest incubation times.
FIG. 6.
Amount of intracellular ATP in L. plantarum LA 10-11 cells grown at pH 5.0 (A) and pH 7.0 (B) after different durations of pressure treatment at 250 MPa. Symbols: □, 0 min; ⧫, 5 min, survival 57% (A); ▴, 10 min, survival 99% (A); ▪, 20 min, survival 41% (A) and 56% (B); ▿, 40 min, survival 55% (A); •, 80 min, survival 0.4% (A). The percent survival is calculated by [N (number of cells after pressure)/N (number of cells before pressure)] × 100.
Membrane morphology determination.
No obvious changes were observed in the morphology of the membranes from pressure-treated cells in comparison to control cells at magnifications of up to 750,000 (data not shown). Interestingly, clustering of DNA was observed when the cells were given a pressure treatment for 10 min at 250 MPa. However, almost all the cells (86%) survived this treatment, suggesting that clustering of DNA by pressure can be reversible. Clustering of DNA was also observed when cells were given a pressure treatment of 10 min at 350 MPa, with 0.05% survival of the cells. Mackey et al. (14) observed similar effects of high pressure on Salmonella and Listeria.
DISCUSSION
It can be assumed that the effects of freezing of the cells prior to measurements are negligible, since the viable counts and the intracellular pH of the cells were not affected by freezing.
The kinetics of pressure inactivation show that cells grown at pH 5.0 are more resistant to high pressure than are cells grown at pH 7.0.
As shown in Fig. 3, the measured ATPase activity in vesicles from cells grown at pH 5.0 did not differ significantly from the ATPase activity of cells grown at pH 7.0. When the vesicles were treated with Triton X-100, the apparent ATPase activity increased considerably, especially in the vesicles which were made from cells grown at pH 5.0. This increase might be explained by better exposure of occluded ATPase to ATP after treatment with Triton X-100, since the presence of right-side-out membrane vesicles (ATPase on the inside) cannot be excluded. The F0F1 ATPase activity of membrane vesicles isolated from mildly pressurized cells from both culture conditions increased significantly compared to that for untreated cells. Access of ATP to the enzyme might be enhanced by pressure. This is in line with the observation that Triton X-100 treatment did not cause a further increase in the ATPase activity of mild pressurized cells. The ATPase activity decreased gradually after longer pressure treatments.
The observations on intracellular pH seem consistent with the findings mentioned above. The ability of the cells to maintain a ΔpH decreased with increasing pressure treatment as the cells lost viability (Fig. 4). However, the intracellular pH had already decreased before the number of CFU was reduced (10 min at 250 MPa for pH 5.0 cultured cells). Furthermore, the number of viable cells was smaller after 20 min of pressure treatment than after 10 min of treatment while the ability to maintain a ΔpH remained almost the same. Moreover, Smelt et al. (23) have demonstrated that such pressure treatments extend the lag time of the same microorganism. Both observations indicate that there is an impaired physiological state of L. plantarum after high-pressure treatment and that the cells are better able to recover from a mild pressure treatment (10 min) than a severe pressure treatment. At low external pH values, the cells grown at pH 5.0 were able to maintain a greater ΔpH than were the cells grown at pH 7.0. This difference may be explained by the lower ATPase activities found for pH 7.0-grown cells in the range from pH 4.5 to 6.0 (Fig. 2). However, when the external pH was 6.5, the ΔpH was also greater for cells grown at pH 5.0 than for cells grown at pH 7.0, but, as can be seen from Fig. 2, both type of cells have a similar F0F1 ATPase activity at this pH. This may be explained by the fact that the ΔpH is measured in cells and the ATPase activity measured in membrane vesicles.
Glucose-induced acid efflux has previously been shown to be a reflection of F0F1 ATPase activity in streptococci (5). Indeed, the acid efflux could be inhibited by DCCD. L. plantarum cells grown at pH 5.0 were able to expel more protons than were cells grown at pH 7.0. These results are in agreement with earlier findings of Kobayashi et al. on Enterococcus hirae (formerly Streptococcus faecalis) (9). The relative rate of acidification was decreased after high-pressure treatment.
Addition of an energy source resulted in a dramatic increase in the intracellular ATP concentration after mild high-pressure treatment compared to that of untreated cells. The ATP in the intracellular pool is the net of ATP production minus ATP utilization. It is conceivable that after pressure treatment the F0F1 ATPase can no longer utilize ATP while the ATP-generating system is still intact. The findings suggest that the ATPase may be more sensitive than glycolysis to pressure treatment. In addition, the cells were not able to increase their ATP pool after severe pressure treatments. This might indicate that severe pressure treatment affects glycolysis.
We present evidence which suggests that the membrane-bound F0F1 ATPase is involved in high-pressure inactivation of L. plantarum. Although F0F1 ATPase is membrane bound, no direct morphological changes of the membrane could be observed.
ACKNOWLEDGMENTS
This research was partly supported by a grant from the EU AIR Project AIR1 CT92-0296 on High Pressure.
We gratefully acknowledge Ad Bos, Johan Hellemons, Bert Poolman, Guus Rijke, and Pieter ter Steeg for their helpful discussions throughout the study. We also thank William de Souza for help with the internal pH measurements, Peter Zandbelt for performing electron microscope analysis, Jan Groeneweg and Cees den Hollander for technical assistance with the high-pressure apparatus, and Stanley Brul and John Chapman for critically reading the manuscript.
REFERENCES
- 1.Cheftel J-C. Effects of hydrostatic pressure on food constituents: an overview. Colloq INSERM. 1992;224:195–209. [Google Scholar]
- 2.Chong P L, Fortes P A, Jameson D M. Mechanisms of inhibition of (Na,K) ATPase by hydrostatic pressure studied with fluorescent probes. J Biol Chem. 1985;260:14484–14490. [PubMed] [Google Scholar]
- 3.De Smedt H, Borghgraef R, Ceuterick F, Heremans K. Pressure effects on lipid-protein interactions in (Na+ + K+)-ATPase. Biochim Biophys Acta. 1979;556:479–489. doi: 10.1016/0005-2736(79)90135-4. [DOI] [PubMed] [Google Scholar]
- 4.Driessen A J P, Konings W M. Assay of phosphate in lipids. Methods Cell Biol. 1992;34:147–165. [Google Scholar]
- 5.Harold F M, Pavlasova E, Baarda J R. A transmembrane pH gradient in Streptococcus faecalis: origin, and dissipation by proton conductors and N,N′-dicyclohexylcarbodiimide. Biochim Biophys Acta. 1970;196:235–244. doi: 10.1016/0005-2736(70)90011-8. [DOI] [PubMed] [Google Scholar]
- 6.Hawley S A. Reversible pressure-temperature denaturation of chymotrypsinogen. Biochemistry. 1971;10:2436–2442. doi: 10.1021/bi00789a002. [DOI] [PubMed] [Google Scholar]
- 7.Kashket E R. Bioenergetics of lactic acid bacteria: cytoplasmic pH and osmotolerance. FEMS Microbiol Rev. 1987;46:233–244. [Google Scholar]
- 8.Knorr D. Hydrostatic pressure treatment of food microbiology. In: Gould G W, editor. New methods of food preservation. Glasgow, Scotland: Blackie; 1995. pp. 159–175. [Google Scholar]
- 9.Kobayashi H, Suzuki T, Unemoto T. Streptococcal cytoplasmic pH is regulated by changes in amount and activity of a proton-translocating ATPase. J Biol Chem. 1986;261:627–630. [PubMed] [Google Scholar]
- 10.Lowry O H, Rosebrough N J, Farr A L, Randall R J. Protein measurements with the Folin phenol reagent. J Biol Chem. 1951;193:265–275. [PubMed] [Google Scholar]
- 11.Ludwig H, Bieler C, Hallbauer K, Scigalla W. Inactivation of microorganisms by hydrostatic pressure. Colloq INSERM. 1992;224:25–32. [Google Scholar]
- 12.Macdonald A G. Effects of high hydrostatic pressure on natural and artificial membranes. Colloq INSERM. 1992;224:67–75. [Google Scholar]
- 13.MacFeeters R F, Chen K-H. Utilization of electron acceptors for anaerobic mannitol metabolism by Lactobacillus plantarum. Compounds which serve as electron acceptors. Food Microbiol. 1986;3:73–81. [Google Scholar]
- 14.Mackey B M, Forestière K, Isaacs N S, Stenning R, Brooker B. The effect of high hydrostatic pressure on Salmonella thompson and Listeria monocytogenes examined by electron microscopy. Lett Appl Microbiol. 1994;19:429–432. [Google Scholar]
- 15.MacNaughtan W, Macdonald A G. Effects of pressure and pressure antagonists on the growth and membrane-bound ATP-ase of Acholeplasma laidlawii B. Comp Biochem Physiol A. 1982;72:405–414. doi: 10.1016/0300-9629(82)90238-9. [DOI] [PubMed] [Google Scholar]
- 16.Marquis R E, Bender G R. Barophysiology of prokaryotes and protontranslocating ATPases. In: Jannasch H W, Marquis R E, Zimmerman A M, editors. Current perspectives in high pressure biology. London, United Kingdom: Academic Press Ltd.; 1987. pp. 65–73. [Google Scholar]
- 17.Nannen N L, Hutkins R W. Intracellular pH effects in lactic acid bacteria. J Dairy Sci. 1991;74:741–746. [Google Scholar]
- 18.Nannen N L, Hutkins R W. Proton-translocating adenosine triphosphatase activity in lactic acid bacteria. J Dairy Sci. 1991;74:747–751. [Google Scholar]
- 19.Péqueux A, Gilles R. Effects of high hydrostatic pressures on the activity of the membrane ATPases of some organs implicated in hydromineral regulation. Comp Biochem Physiol B. 1978;59:207–212. doi: 10.1016/0305-0491(78)90248-1. [DOI] [PubMed] [Google Scholar]
- 20.Poolman B. Energy transduction in lactic acid bacteria. FEMS Microbiol Rev. 1993;12:125–147. doi: 10.1111/j.1574-6976.1993.tb00015.x. [DOI] [PubMed] [Google Scholar]
- 21.Rottenberg J. The measurement of membrane potential and ΔpH in cells, organelles and vesicles. Methods Enzymol. 1979;55:547–569. doi: 10.1016/0076-6879(79)55066-6. [DOI] [PubMed] [Google Scholar]
- 22.Sale J H, Gould G W, Hamilton W A. Inactivation of spores by hydrostatic pressure. J Gen Microbiol. 1970;69:323–334. doi: 10.1099/00221287-60-3-323. [DOI] [PubMed] [Google Scholar]
- 23.Smelt J P P M, Courier W, Cuppers H G A, Wouters P C, Rijke A G F. Proceedings of the XXXIVth Meeting of High Pressure Bio-Science and Biotechnology. 1996. Inactivation kinetics of microorganisms by hydrostatic pressure; pp. 273–276. [Google Scholar]
- 24.Sonoike K, Setoyama T, Kuma Y, Kobayashi S. Effect of pressure and temperature on the death rate of Lactobacillus casei and Escherichia coli. Colloque INSERM. 1992;224:297–301. [Google Scholar]


