Abstract
Complement-mediated killing of bacteria was monitored by flow cytometric, luminometric, and conventional plate counting methods. A flow cytometric determination of bacterial viability was carried out by using dual staining with a LIVE/DEAD BacLight bacterial viability kit. In addition to the viable cell population, several other populations emerged in the fluorescence histogram, and there was a dramatic decrease in the total cell count in the light-scattering histogram in the course of the complement reaction. To permit luminometric measurements, Bacillus subtilis and Escherichia coli were made bioluminescent by expressing an insect luciferase gene. Addition of substrate after the complement reaction resulted in bioluminescence, the level of which was a measure of the viable cell population. All three methods gave essentially the same killing rate, suggesting that the bacteriolytic activity of serum complement can be measured rapidly and conveniently by using viability stains or bioluminescence. In principle, any bacterial strain can be used for viability staining and flow cytometric analysis. For the bioluminescence measurements genetically engineered bacteria are needed, but the advantage is that it is possible to screen automatically a large number of samples.
Immunochemical assays for complement components or fragments of complement components are the most common methods used to measure complement activity (7). The functional activity of complement is usually determined by a total hemolytic complement assay. Direct functional bacteriolytic activity of complement can be measured by using a traditional plate counting method (counting of CFU). However, this method is laborious, requires at least overnight incubation, and is therefore seldom used.
Both improvement of instruments and continuous development of new fluorescent stains have made flow cytometry an attractive choice for bacterial analysis. Numerous dyes have been introduced for distinguishing between live and dead microbes, including, for example, dyes based on membrane permeability (8) and membrane potential (3, 5). Moreover, it should be noted that flow cytometric techniques can be used for a wide range of target bacteria, including potentially pathogenic species.
Luciferases are a class of enzymes that produce light during catalysis. Insect luciferases (e.g., luciferase from the American firefly, Photinus pyralis, or the Jamaican click beetle, Phyrophorous plagiophthalamus) catalyze the following reaction: ATP + d-luciferin + O2 ⇔ ADP + PPi+ oxyluciferin + H2O. The fact that insect luciferases use ATP as one of their substrate connects the reaction of these enzymes directly to the metabolism of the cell if external ATP is not added, which makes luminescence measured in vivo a good indicator of the number of living bacteria (10).
We have previously described a kinetic luminometric method for measuring the membrane-perturbing activity of complement based on genetically engineered luminescent bacteria (9). The diffusion of the luciferase enzyme substrate through the cell membranes at physiological pH values is very slow, and therefore a change in membrane permeability was seen as a change in the in vivo luminescence of the cells. Here we describe another approach in which luminescent bacteria are used; in this method the fact that the luciferase substrate, d-luciferin, diffuses rapidly into cells at pH 5 is used. Thus, after the complement reaction is stopped, the addition of substrate to the reaction mixture results in luminescence, which is emitted only by viable cells.
We used Escherichia coli and Bacillus subtilis strains to measure complement activity in order to test the applicability of the method to both gram-negative and gram-positive bacteria.
MATERIALS AND METHODS
Materials.
A LIVE/DEAD BacLight bacterial viability kit (catalog no. L-7005) for microscopy and quantitative analysis was obtained from Molecular Probes Europe (Leiden, The Netherlands), and Fluoresbrite beads (diameter, 1.8 μm) were obtained from Polysciences Inc. (Warrington, Pa.).
Cultivation of bacteria.
E. coli JM109 and B. subtilis BR151 carrying luciferase expression plasmid pCSS962, the cultivation of those bacteria, and their sensitivity to the complement reaction have been described previously (9). In this work an overnight culture of bacteria was diluted with fresh L broth (1% tryptone, 0.5% yeast extract, 0.5% NaCl; pH 7.0) containing appropriate antibiotics to a concentration of 4 × 10⁷ bacteria/ml and cultivated to the log phase (about three generations). Bacteria were collected by centrifugation (1,500 × g, 10 min), washed with Hanks’ balanced salt solution (HBSS), resuspended in HBSS, and diluted to a concentration of 107 cells/ml with HBSS.
Serum handling.
Sera obtained from five individuals were pooled and stored in aliquots at −70°C to determine the lytic activity of complement on B. subtilis. Another similar serum pool was used with E. coli. To obtain measurements, each serum pool was diluted (2 to 50 μl/ml) with heat-inactivated (56°C, 30 min) fetal calf serum.
Complement reactions.
Complement reactions were carried out by mixing serum dilutions with bacterial dilutions at a ratio of 1:1 to obtain final serum concentrations ranging from 1 to 25 μl/ml and a bacterial concentration of 5 × 10⁶ cells/ml. Reaction mixtures were incubated for 90 min at 37°C without shaking. The reactions were stopped by placing the samples in an ice bath for 10 min prior to removal of the serum by centrifugation.
Flow cytometric analysis.
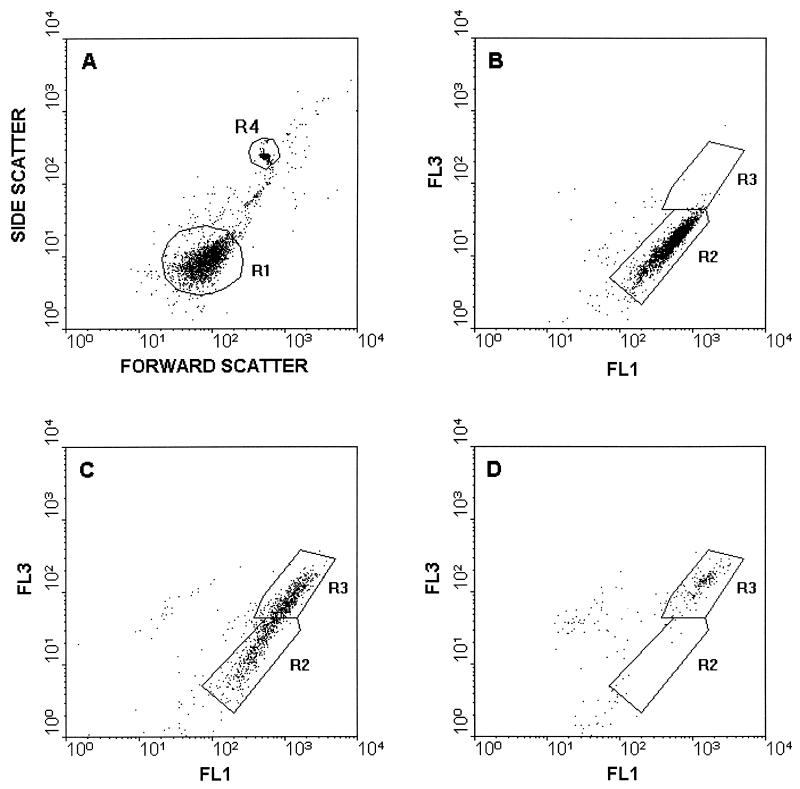
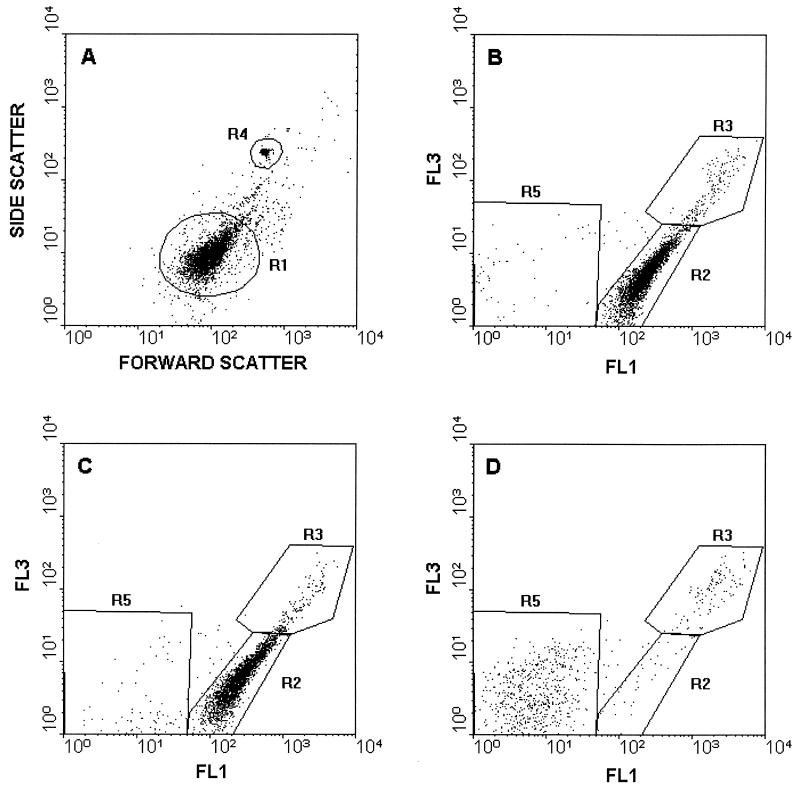
Bacteria from 1,000 μl of a complement reaction mixture were washed and resuspended in 200 μl of HBSS containing 3.34 μM stain A (SYTO9) and 20 μM stain B (propidium iodide [PI]) from the LIVE/DEAD BacLight bacterial viability kit. The suspension was incubated for 15 min in the dark at room temperature, 10 μl of the suspension was added to 980 μl of water, and, in order to calculate the absolute cell number, 10 μl of a solution containing 7.5 × 10⁷ Fluoresbrite beads/ml was added to each cytometer sample (resulting in 7.5 × 10⁵ beads/ml) and used for internal calibration. Samples were analyzed with an Epics XL flow cytometer (Coulter Corporation, Miami, Fla.) in duplicate. Samples were illuminated with a 15-mV air-cooled argon ion laser (488 nm), and the fluorescence of stain A and the fluorescence of stain B were detected through 525-nm (type FL1, green) and 620-nm (type FL3, red) band pass filters, respectively. Signals were amplified with the logarithmic mode for side scattering, forward scattering, and fluorescence. In light-scattering histograms (Fig. 1A and 2A) the bacterial cells were gated (R1) from irrelevant counts for the fluorescence histograms, and viable and nonviable bacteria were separated into R2 and R3, respectively. From the cytometric data the number of live cells was determined by using the following formula: number of viable cells per milliliter = (number of counts inside R2/number of counts inside R4) × (7.5 × 105) × 20, where R4 is the Fluoresbrite bead count.
FIG. 1.
Flow cytometric analysis of serum-treated B. subtilis. (A) Light scatter histogram of B. subtilis treated with heat-inactivated serum. (B through D) Fluorescence histograms of viability-stained B. subtilis after 90 min of incubation with 0 μl of human serum per ml (B), 5 μl of human serum per ml (C), and 6.7 μl of human serum per ml (D). The standard beads were gated in R4. Cells inside R1 are shown in panels B to D. Green fluorescence (FL1) and red fluorescence (FL3) were determined by using 525- and 620-nm band pass filters, respectively.
FIG. 2.
Flow cytometric analysis of serum-treated E. coli. (A) Light scatter histogram of E. coli treated with heat-inactivated serum. (B through D) Fluorescence histograms of viability-stained E. coli after 90 min of incubation with 0 μl of human serum per ml (B), 10 μl of human serum per ml (C), 12.5 μl of human serum per ml (D). The standard beads were gated in R4. Cells inside R1 are shown in panels B to D. Green fluorescence (FL1) and red fluorescence (FL3) were determined by using 525- and 620-nm band pass filters, respectively.
Luminometric analysis.
A 50-μl portion of a complement reaction mixture was mixed with 50 μl of luciferin solution (1 mM d-luciferin in 100 mM citrate, pH 5.0) (11), and luminescence was monitored for 30 min with an LKB-Wallac model 1251 luminometer (Wallac, Turku, Finland) at 37°C. Duplicate measurements were obtained. The luminescence values obtained 10 min after the addition of substrate were used for the viability calculations, and the luminescence values for samples with different serum concentrations were compared to the luminescence produced by the sample containing no human serum to obtain the proportion of viable cells.
CFU measurement.
Complement reaction mixtures were diluted 102- to 107-fold with 150 mM NaCl and plated onto L agar plates (L broth containing 1.6% agar) containing appropriate antibiotics. Colonies were counted after overnight incubation at 30°C (B. subtilis) or at 37°C (E. coli).
RESULTS
Cytometric measurements.
Figures 1 and 2 show examples of cytometric data, including a light-scattering histogram and the changes in the fluorescence patterns of LIVE/DEAD stains inside B. subtilis and E. coli, respectively, when they were treated with different serum concentrations. Only the cells inside R1 in light-scattering histograms (Fig. 1A and 2A) were gated for fluorescence measurements. Intact cells exhibited green fluorescence (R2 in Fig. 1B and 2B), whereas red fluorescence increased 10-fold when cell membrane integrity was compromised as a result of a complement reaction (R3 in Fig. 1C). It should be noted that the green fluorescence increased simultaneously with red fluorescence; in fact, the green fluorescence of R3 Fig. 1C is threefold greater than the green fluorescence of R2 in Fig. 1B. As the serum concentration increased further (Fig. 1D), the total cell count decreased as a result of cell disruption along with the disappearance of viable cells in R2. The numbers of CFU in plate counts were compared to the numbers of bacteria in different regions in the flow cytometric fluorescence histogram, and the number of bacteria in R2 was found to be consistent with the number of CFU, and R2 was therefore considered viable.
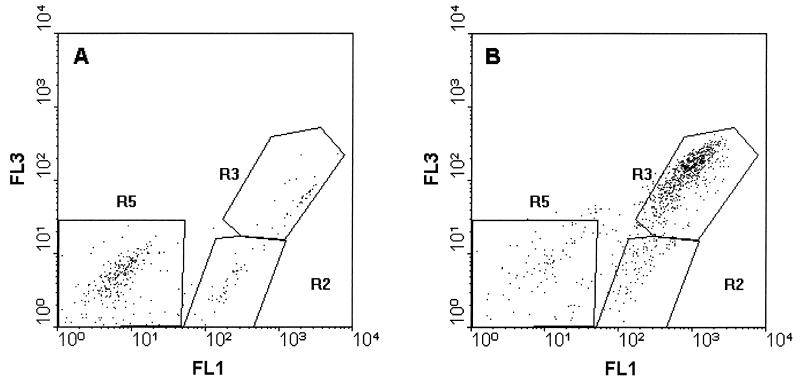
Under modified reaction conditions with a serum concentration of 20 μl/ml, additional populations appeared after 45 min of incubation of B. subtilis (R5 in Fig. 3A) and after 15 min of incubation of E. coli (R3 in Fig. 3B).
FIG. 3.
Appearance of additional populations obtained by incubating B. subtilis with 20 μl of human serum per ml for 45 min (R5 in panel A) and E. coli with 20 μl of human serum per ml for 15 min (R3 in panel B).
Luminometric measurements.
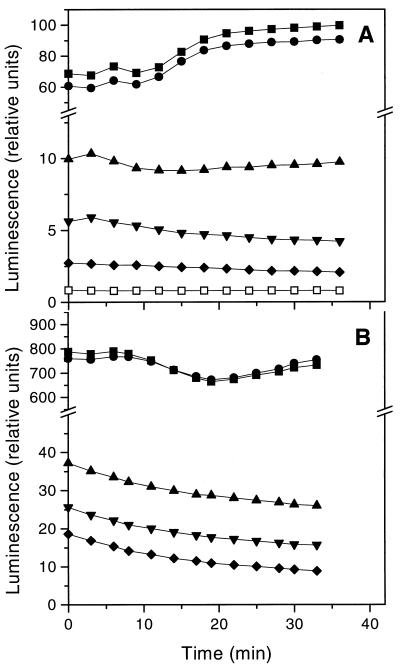
The levels of bioluminescence emitted by B. subtilis (Fig. 4A) and E. coli (Fig. 4B) decreased with increasing serum concentration and remained relatively constant at each serum concentration for 30 min after addition of the luciferase substrate. The reduction in luminescence correlated well with the reduction in the number of CFU (Fig. 5), confirming the assumption that the level of bioluminescence is a measure of the number of viable cells.
FIG. 4.
(A) Luminescence of B. subtilis after addition of the luciferase substrate, d-luciferin. The cells were incubated for 90 min with no human serum (▪) or with human serum at concentrations of 3.3 μl/ml (•), 5.0 μl/ml (▴), 5.6 μl/ml (▾), 6.7 μl/ml (⧫), and 10 μl/ml (□) prior to substrate addition. (B) Luminescence of E. coli after addition of the luciferase substrate, d-luciferin. The cells were incubated for 90 min with no human serum (▪) or with human serum at concentrations of 5.0 μl/ml (•), 12.5 μl/ml (▴), 18.3 μl/ml (▾), and 25.0 μl/ml (⧫) prior to substrate addition. The values are averages from three replicate experiments.
FIG. 5.
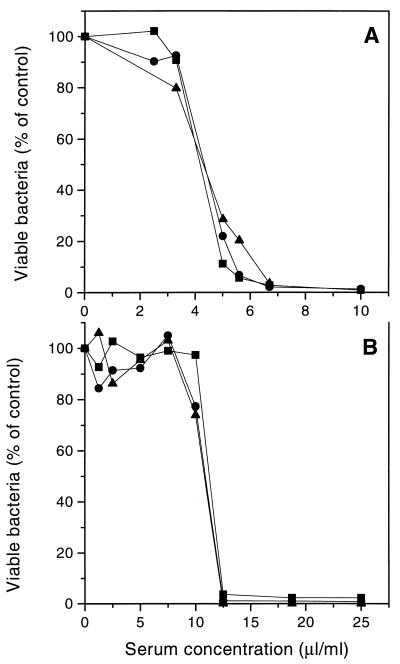
Killing of B. subtilis (A) and E. coli (B) by serum complement at different serum concentrations as measured by flow cytometry (•), luminometry (▪), and plate counting (▴). The cytometric data and plate counts are averages from duplicate experiments, and the luminometric data are averages from triplicate experiments.
Figure 5 shows that all three methods gave essentially the same killing rate, suggesting that bacteriolytic complement activity can be measured rapidly and conveniently by using viability stains or bioluminescence.
DISCUSSION
Despite the continuous development of new dyes for flow cytometry, no universal stain that is suitable for all applications has been found. In particular, staining living cells with intact or slightly damaged membranes has been found to be difficult. Jepras et al. (3) showed recently that a membrane potential dye, bis(1,3-dibutylbarbituric acid) trimethine oxonol (DiBAC4), outperforms fluorescein diacetate, carboxyfluorescein diacetate, carboxyfluorescein diacetate-acetoxymethylester, PI, ethidium monoazide, and rhodamine 123 for determining viable bacteria. However, it must be noted that DiBAC4 stains only dead bacteria, and therefore the use of DiBAC4 to measure complement activity is limited since higher serum concentrations lead to total disruption of damaged cells. Therefore, the use of a dual staining method in this study was necessary. In the LIVE/DEAD BacLight bacterial viability kit stain B is PI, which is a membrane-impermeable DNA stain. This stain has been widely used to assess the viability of bacterial cells (2). It does not penetrate intact cell membranes, in contrast to stain A (SYTO9), which according to the manufacturer (6), diffuses through plasma membranes and also binds to DNA, thus staining all cells regardless of membrane integrity. However, PI competes for nucleic acid binding sites with SYTO9, so it may displace bound SYTO9. A sixfold excess of PI may further enhance this displacement under the reaction conditions used. Therefore, a population of compromised cells can be seen as a population with higher PI intensity (R3), although the fluorescence of SYTO9 also increases considerably. The intact plasma membrane may form a slight permeability barrier to SYTO9. Thus, the diffusion of this stain into the cytoplasm should be increased by membrane damage caused by the complement reaction. Another explanation could be insufficient compensation of overlapping fluorescence signals (PI fluorescence to the green channel). Nevertheless, the two populations can be easily distinguished with the settings used, and further compensation would probably lead to inseparable populations. The reason for the appearance of a population (R5) in which the intensity of both stains is considerably decreased is obscure at present. The presence of this population could be due to leaking of the stains out of the damaged cells either freely or along with the fragmented DNA.
The bacteriolytic activity of serum includes a complicated series of events, starting with membrane integrity-perturbing activities that lead to slight damage of membranes and finally to pore formation. Serum lysozyme and intracellular lytic enzymes complete the cellular destruction. Since in the serum dilutions normally used for complement activity measurements, bacteriolytic activity is in progress for from 20 to 30 min to 2 to 3 h, depending on the serum dilution, it may not be surprising that in the course of the reaction populations other than “pure” live and “pure” dead populations appear, unlike what happens in a simple bacteriocidical system, such as ethanol. The dramatic decrease in the total cell count (R1) during complement activity is obviously due to fragmentation of the dead cells by the lytic enzymes into particles invisible in the light-scattering histogram. For killing rate calculations, however, only the R2 counts of a particular histogram compared to the R2 counts of the control reaction histogram must be considered. If the estimates of the amounts of various complement components on bacterial surfaces are made accurately, the other populations may reveal important information concerning the mechanism of the complement cascade.
Measurements of bioluminescence of naturally luminescent (1) or genetically engineered (4, 10) bacteria have been widely utilized in cytotoxicity testing to measure bacterial cell death. In addition to the bacteriocidal activity of the complement reaction described here, we have previously shown that the changes in bacterial luminescence closely correlate with the number of CFU when bacteria are killed by antimicrobial agents (10). The luminometric method offers an alternative to flow cytometry for measuring cell viability. It may have a limited range of target bacteria, because the test strain has to be made bioluminescent by genetic engineering, but it does not require expensive instruments or any special experience, in contrast to flow cytometry. The luminometric method is also easily applied to automatic screening of large numbers of samples.
ACKNOWLEDGMENTS
This work was supported by the State Technology Development Centre of Finland (TEKES).
We thank Pertti Marnila for advice during the work and Maurice O. Moss for proofreading the manuscript.
REFERENCES
- 1.Bulich A A, Tung K-K, Scheibner G. The luminescent bacteria toxicity test: its potential as an in vitro alternative. J Biolum Chemilum. 1990;5:71–77. doi: 10.1002/bio.1170050202. [DOI] [PubMed] [Google Scholar]
- 2.Davey H M, Kell D B. Flow cytometry and cell sorting of heterogeneous microbial populations: the importance of single-cell analysis. Microbiol Rev. 1996;60:641–696. doi: 10.1128/mr.60.4.641-696.1996. [DOI] [PMC free article] [PubMed] [Google Scholar]
- 3.Jepras R I, Carter J, Pearson S C, Paul F E, Wilkinson M J. Development of a robust flow cytometric assay for determining numbers of viable bacteria. Appl Environ Microbiol. 1995;61:2696–2701. doi: 10.1128/aem.61.7.2696-2701.1995. [DOI] [PMC free article] [PubMed] [Google Scholar]
- 4.Lampinen J, Korpela M, Saviranta P, Kroneld R, Karp M. Use of Escherichia coli cloned with genes encoding bacterial luciferase for evaluation of chemical toxicity. Toxicity Assessment. 1990;5:337–350. [Google Scholar]
- 5.Mason J D, Allman L-A R, Stark J M, Lloyd D. The ability of membrane potential dyes and calcofluor white to distinguish between viable and nonviable bacteria. J Appl Bacteriol. 1995;78:309–315. doi: 10.1111/j.1365-2672.1995.tb05031.x. [DOI] [PubMed] [Google Scholar]
- 6.Molecular Probes Europe BV. LIVE/DEAD BacLight bacterial viability kit product information sheet. Leiden, The Netherlands: Molecular Probes Europe BV; 1996. [Google Scholar]
- 7.Porcel J M, Peakman M, Senaldi G, Vergani D. Methods for assessing complement activation in the clinical immunology laboratory. J Immunol Methods. 1993;157:1–9. doi: 10.1016/0022-1759(93)90063-d. [DOI] [PubMed] [Google Scholar]
- 8.Shapiro H B. Practical flow cytometry. New York, N.Y: Liss; 1983. [Google Scholar]
- 9.Virta M, Karp M, Rönnemaa S, Lilius E-M. Kinetic measurement of the membranolytic activity of serum complement using bioluminescent bacteria. J Immunol Methods. 1997;201:215–221. doi: 10.1016/s0022-1759(96)00225-6. [DOI] [PubMed] [Google Scholar]
- 10.Virta M, Karp M, Vuorinen P. Nitric oxide donor-mediated killing of bioluminescent Escherichia coli. Antimicrob Agents Chemother. 1994;38:2775–2779. doi: 10.1128/aac.38.12.2775. [DOI] [PMC free article] [PubMed] [Google Scholar]
- 11.Wood K V, DeLuca M. Photographic detection of luminescence in Escherichia coli containing the gene for firefly luciferase. Anal Biochem. 1987;161:501–507. doi: 10.1016/0003-2697(87)90480-5. [DOI] [PubMed] [Google Scholar]


