

Abstract
Background:
The complex host response to sepsis is incompletely understood. The aim of this investigation is to use leukocyte RNA sequencing to characterize biological functions, cellular pathways, and key regulatory molecules driving sepsis pathophysiology.
Methods:
This was a prospective, observational study of Emergency Department patients with sepsis, at an urban, academic, tertiary care center. In the derivation cohort, we collected blood at enrollment and 90 days after hospital discharge allowing each patient to serve as an internal control. We performed RNA sequencing to quantify transcriptional expression changes during sepsis and non-sepsis states. We then performed unsupervised and supervised analyses, as well as functional and pathway analyses. We selected the top down- and up- regulated genes and key regulatory molecules for validation. Validation occurred in a cohort of septic and non-septic using real-time PCR.
Results:
The derivation cohort included 5 patients, and RNA sequencing revealed 916 unique mRNA transcripts differentially expressed during sepsis. Among these, 673 (73%) genes were up-regulated, and 243 (27%) were down-regulated. Functional enrichment analysis revealed a highly dynamic downstream effect of the transcriptional activity during sepsis. Of the 43 functional cellular pathways activated during sepsis, the top pathways were closely associated with inflammation and response to infection. Validation occurred in 18 septic and 25 non-septic control patients, with 34/45 (76%) of identified genes validated. The regulatory analysis identified several key regulators of sepsis.
Conclusions:
Highly dynamic transcriptional activity occurs in leukocytes during sepsis, activating key cellular pathways and master regulatory molecules that drive the sepsis process.
Keywords: Sepsis, transcriptome, pathophysiology
INTRODUCTION
Sepsis is common, costly, increasing in incidence, and continues to carry a high case fatality rate. [1–3] Decades of translational and clinical studies have identified numerous host alterations associated with the sepsis diagnosis and/or outcome. A wide variety of circulating protein based biomarkers or more upstream gene expression targets have been examined for utility as biomarkers for sepsis diagnosis (is the patient infected?) and prognosis (what is the risk of adverse outcome), without yielding a “gold standard” marker or set of markers. Part of the challenge is the complexity of sepsis and an inherent incomplete understanding of the host response.
The assessment of gene expression and regulatory mechanisms (transcriptomics) during the host response to sepsis may advance our understanding of sepsis pathophysiology. Prior efforts to delineate sepsis pathophysiology have traditionally used previously established assays targeting specific protein-based biomarkers (e.g. cytokines, chemokines, etc.). Evolving technologies now allow the creation of transcriptional profiles that assay the dynamic state of the entire genome both quantitatively and qualitatively, without relying on available assays. While the initial microarray and PCR-based transcriptome studies in sepsis generated intriguing results and yielded new targets,[4, 5] the genomic coverage provided in these studies was limited by the inability to fully catalogue and quantify diverse RNA molecules. Likewise, high background levels of expression due to cross-hybridization and the reliance upon existing gene sequences, further limits the reach of these initial studies. RNAseq is a deep sequencing technique that quantifies RNA expression with ultra-sensitivity at genome scale by using massively parallel sequencing. This technique allows for transcriptome analysis with a very high dynamic range at a high resolution without saturation of signals.[6] Furthermore, RNAseq enhances the ability to catalogue RNA transcripts, creating the opportunity to use a more inclusive approach to delineating the complex biological pathways activated in sepsis.
The overall objective of this study was to use RNA gene expression profiling techniques to identify master regulatory genes and key physiologic pathways in sepsis. Using deep sequencing techniques, we performed transcriptome-wide sequencing of blood leukocytes obtained from emergency department (ED) patients with sepsis, and compared these transcriptome profiles to each patient’s transcriptome after recovery. Patterns of genetic up- and down-regulation seen in this derivation cohort were validated in a second cohort of emergency patients with and without sepsis.
MATERIAL AND METHODS
Study Design
This was a prospective, multicenter observational study of a convenience sample of adult patients (≥ 18 years) with sepsis presenting to one of two urban academic EDs.
The experimental design included a derivation set and a validation set (Supplemental Figure 1). The derivation set consisted of 5 patients whose blood was drawn during an acute sepsis illness, and then again at least 90 days after the sepsis incident. We performed a transcriptome-wide analysis to identify alteration in mRNA transcripts. We selected the top 10 genes upregulated, top 10 genes down-regulated, 25 genes playing key regulatory roles. These genes were validated in 18 patients with sepsis and 25 non-infected control patients. We also performed an exploratory analysis comparing sepsis survivors to non-survivors. The study enrollment period was October 2012 to January 2014. The Committee on Clinical Investigations at Beth Israel Deaconess Medical Center, Boston, MA, and the Institutional Review Board at Saint Vincent Hospital, Worcester, MA, both approved this study, and written consent was obtained for each subject enrolled.
Patient population
Patient Selection
Study inclusion criteria were: 1) adult ED patients (age 18 years or older) meeting sepsis criteria. Sepsis was defined as the presence of an infection (defined both by the clinical treating team and through confirmatory case review) and the presence of at least 2 Systemic Inflammatory Response Syndrome (SIRS) criteria.[7]. Furthermore, for the derivation set, the septic patients had to survive the septic event for the 90-day RNA blood draw to occur. Exclusion criteria were inability to obtain written informed consent and absence of an infection. We preferentially recruited patients meeting severe sepsis (sepsis plus organ dysfunction) or septic shock (sepsis plus systolic blood pressure (SBP) < 90 mmHg after a 20 cc/kg fluid challenge).
Derivation Set
Five patients with sepsis were included in the derivation set. We collected blood during their ED presentation for sepsis, as well as at least 90 days later (while they were out of the hospital), after recovery from their illness. This approach allowed patients to serve as their own internal control by comparing an individual to themselves during sepsis and non-sepsis states. During the 90-day follow-up draw, patients needed to be without infection which was defined as fulfilling following criteria: 1) no antibiotics either current or within the past 2 weeks; 2) no reported fever or temperature > 100.4°F; and 3) no hospitalization due to an infection within the last two weeks prior to the follow-up blood draw. This subset population was the basis for the discovery set using deep RNA-sequencing (Supplemental Figure 1).
Validation Set
The validation set consisted of 18 patients with sepsis (including severe sepsis and septic shock) and 25 non-infected ED “controls”. Controls were non-infected patients from the ED. We selected patients from our general ED population, including patients with comorbid diseases in order to have a control cohort that had a similar demographic as the sepsis population.
Comparison of Patients with and Without Sepsis
The primary comparison of interest was the presence of sepsis (inclusive of severe sepsis and septic shock). The infection status was initially established by the treating clinician, and then confirmed by study investigators through detailed chart review at the completion of the hospitalization and was arbitrated using all available data (notes, radiology and laboratory testing results, etc.). Clinical confirmation (e.g. fever, cough, infiltrate on chest x-ray) was required, but not microbiological confirmation as typically less than half of patient with septic shock yield positive microbiologic cultures. Only cases where both reviewing investigators both deemed the patient as “definitely infected” based on clinical criteria were included.
Data Collection
We collected pertinent clinical and demographic variables, comorbid diseases, vital sign information, and the result of laboratory testing at enrollment. We classified patients based on their sepsis syndrome at enrollment. Sepsis was defined as 2 or more SIRS criteria, without organ dysfunction or shock.[8] Severe sepsis was defined as sepsis with concomitant organ dysfunction defined by meeting one or more of the following organ dysfunction definitions. Central nervous system: new altered mental state and/or new onset of Glasgow Coma Scale (GCS) < 15; respiratory: any mechanical ventilation, supplemental oxygen required to maintain oxygen saturation > 95%, and/or respiratory rate > 24 beats per minute; cardiovascular: any vasopressor use, SBP < 90 mmHg after 20 mL/kg bolus; renal: urine output < 0.5 mL/kg/hr, or creatinine > 50% of baseline or > 2.0 mg/dl if baseline is unknown; hepatic: AST/ALT > 80 (new); hematopoietic: platelet count < 100,000 and/or PT/PTT > 50% of normal; or metabolic: lactate > 2.5 mmol/l. Septic shock was defined as sepsis plus hypotension (SBP < 90 mmHg after 20 to 30 cc/kg fluid challenge). The sepsis severity was assessed on presentation and on a daily basis for the first 72 hours or until hospital discharge (whichever came first). Patients were classified according to the highest illness severity achieved during the first 72 hours. We also followed patients to determine mortality during the acute illness hospitalization defined as 28-day inpatient mortality.
Sample collection, processing, and analysis
A detailed description of each collection, processing, and analysis step is available in Online Appendix 2. In brief, for the Derivation cohort, whole blood was collected in RNA paxgene tubes at study entry and 90-day follow up, and frozen at – 20 °C. After at least 24 hours at – 20 °C, the RNA tube was transferred to a – 80 °C freezer. Gene expression profiling of the derivation set was performed using next-generation sequencing (NGS). The genes with multiple-test corrected p-value <0.01 and absolute change >2-fold between study entry and 90-day follow up were considered significantly and differentially expressed. In the Validation cohort, gene expression was assessed at study entry using realtime PCR analysis.
Over-represented gene categories among differentially expressed genes were identified by gene ontology analysis. Categories with p-values <0.01 and at least 3 differentially expressed genes were considered significant in this step. Next, the pathway and interactive networks significantly affected by differentially expressed genes were identified. Lastly, a regulatory module analysis identified the cascade of upstream transcriptional regulators that relate the observed gene expression changes seen between septic and non-septic states to identify key regulators (master regulators). This analysis identifies transcription regulators that are significantly altered during sepsis and determines whether they are activated or inhibited. The activation or inhibition of transcriptional regulators was determined by assessing the overlap among the data with activation or inhibition signatures of regulators.
RESULTS
Population Characteristics
In the five patient derivation cohort, the mean age was 56 ±14 years, 3/5 (60%) were male, the mean SOFA score was 4 and the mean APACHE-II score was 16.6 (Table 1). In the unpaired validation cohort (sepsis n=18; controls n=25), the mean age was 63 ± 17 years, 8 (45%) were male and the mean SOFA score was 2.9, the mean APACHE-II score was 17.0 in the sepsis cohort. In the validation set, the in-hospital mortality rate among the septic patients was 12.5%.
Table 1.
Patient characteristics. Continuous variables are reported in mean, medians, ±SD and categorical variables as n (%). PVD, peripheral vascular disease; CVD, central vascular disease; CHF, congestive heart failure; APACHE-II, Acute Physiology and Chronic Health Evaluation II score; SOFA, Sequential Organ Failure Assessment score; N/A, not applicable.
| Sepsis Derivation Cohort (n=5) |
Sepsis Validation Cohort (n=18) |
Control Validation Cohort (n=25) |
|
|---|---|---|---|
| Demographics | |||
| Age (years) | 56, 61 ±14 | 68, 70, ±15 | 57, 58, ±19 |
| Female sex | 2 (40) | 21 (53) | 23 (58) |
| -Race: | |||
| White | 2 (40) | 37 (93) | 11 (28) |
| African American | 3 (60) | 3 (8) | 29 (72) |
| Charlson score | 4.9, 5.0, ±2.8 | 3.0, 3.0, ±1.6 | 3.0, 2.5, ±2.7 |
| Comorbidities | |||
| Hypertension | 2 (40) | 19 (48) | 17 (43) |
| PVD or CAD | 0 (0) | 12 (30) | 6 (15) |
| Diabetes Mellitus | 0 (0) | 14 (35) | 4(10) |
| Cancer | 0 (0) | 4 (10) | 2 (5) |
| CHF | 0 (0) | 7 (18) | 0 (0) |
| Clinical variables | |||
| Temperature (F) | 100.3, 100.4, ±1.7 | 99.8, 99.2, ±2.3 | 98.1, 98.1, ±0.6 |
| Heart Rate | 131, 128, ±11 | 104, 107, ±21 | 73, 72, ±13 |
| Systolic BP | 140, 138, ±45 | 90, 87, ±17 | 134, 129, ±23 |
| Diastolic BP | 77, 75, ±24 | 50, 51, ±12 | 77, 78, ±14 |
| Respiratory Rate | 29, 27, ±14 | 24, 23, ±5 | 17, 16, ±2 |
| Saturation | 95, 98, ±7 | 95, 97, ±7 | 98, 99, ±2 |
| White Blood Cells ×109/l | 7.4, 8.8, ±5.9 | 15.9, 14.6, ±12.2 | 7.1, 6.6, ±2.6 |
| Neutrophils ×109/l | 76.0, 78.0, ±9.3 | 79.3, 86.7, ±20.7 | 63.8, 62.7, ±10.1 |
| -Initial Sepsis Syndrome | |||
| Sepsis | 0 (0) | 3 (8) | N/A |
| Severe Sepsis | 2 (40) | 9 (22) | N/A |
| Septic Shock | 3 (60) | 28 (70) | N/A |
| -Severity Markers | |||
| SOFA score | 4, 4, 2.5 | 5.6, 4.5, ±3.8 | 0.1, 0.0, ±0.3 |
| Lactate (mmol/L) | 3.5, 3.3, ±0.8 | 2.6, 2.1, 1.6 | N/A |
| APACHE-II Score | 16.6, 13, ± 6.4 | 17.0, 17.5, ±8.6 | 4.4, 4.0, ±3.4 |
| In-Hospital Mortality | 0 (0) | 5 (12.5) | 0 (0) |
Derivation Set – Deep RNA Sequencing in sepsis
First, we identified the expression profiles with the most significant differences using principle component analysis to establish a clear separation between the transcriptional profiles of the sepsis and non-sepsis states in the derivation subjects. We found tight clustering of transcriptional profiles in the 90-day non-sepsis draw between the derivation subjects (Supplemental Figure 2). Of ~20.000 genes in the human genome, supervised analysis of paired samples identified 910 unique genes that were differentially expressed by leukocytes in sepsis during the index visit as compared to the non-sepsis phenotypes in the same patients at day 90, after recovery from sepsis (Figure 1 and online appendix 1). There were 668 (73%) genes significantly upregulated in sepsis, and 242 (27%) down regulated genes. Table 2 shows the top genes in each category.
Figure 1.
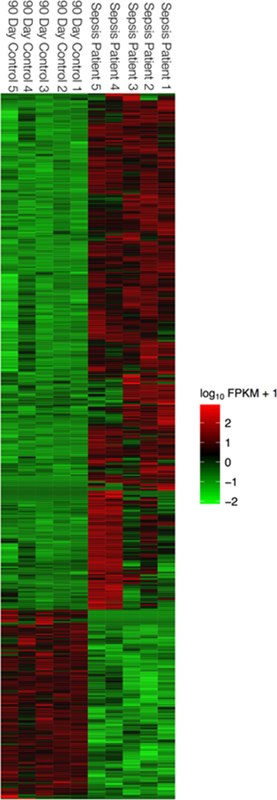
Supervised analysis of gene expression profiling data from paired samples during sepsis (0 Days) and no infection (90 Days later). no infection (90 Days later). In each heat map, rows depict differentially expressed genes and columns depict individual sepsis (0 Days) and control samples (90 Days later). The relative expression level of genes is showing using a pseudocolor scale from −3 to +3. Colors indicated log transformed standardized values (green represents down regulation and red represents up regulation).
Table 2.
Top up- and down-regulated genes and key regulatory genes in sepsis.
| Top Down-Regulated Genes | Expression During Sepsis | Expression at 90 Day Follow-up | Log 2 Fold Change | P-Value |
|---|---|---|---|---|
| IL-1α | 3.36 | 0000 | INFINITY | 0.00005 |
| LGALS2 | 1.26 | 22.18 | −4.14 | 0.0004 |
| CCL20 | 11.93 | 0000 | INFINITY | 0.00015 |
| PLD4 | 0.62 | 9.61 | −3.94 | 0.00005 |
| TIGD3 | 0.36 | 5.47 | −3.91 | 0.0003 |
| PPP2R2B | 0.15 | 2.08 | −3.82 | 0.00005 |
| CCR3 | 0.98 | 13.74 | −3.81 | 0.00005 |
| FXYD7 | 0.74 | 10.27 | −3.80 | 0.0013 |
| ALOX15 | 0.40 | 5.55 | −3.78 | 0.00005 |
| ADAMTS10 | 0.14 | 1.87 | −3.71 | 0.00025 |
| FCER1A | 0.85 | 10.26 | −3.60 | 0.0001 |
| CYP2S1 | 0.29 | 3.20 | −3.45 | 0.00015 |
| Top Up-Regulated Genes | ||||
| GPR84 | 406.36 | 1.20 | 8.40 | 0.00005 |
| MMP8 | 461.10 | 1.64 | 8.13 | 0.00005 |
| OLFM4 | 110.27 | 0.68 | 7.33 | 0.00005 |
| LCN2 | 2599.28 | 22.90 | 6.83 | 0.00005 |
| ANKRD22 | 54.87 | 0.62 | 6.48 | 0.00005 |
| TNFAIP6 | 197.01 | 2.36 | 6.38 | 0.00005 |
| G0S2 | 111.64 | 3.20 | 6.38 | 0.00005 |
| CCL3 | 54.87 | 0.78 | 6.16 | 0.00005 |
| Regulatory Genes | ||||
| OSM | 19.1 | 0.80 | 4.58 | 0.00005 |
| CEBPB | 360.4 | 45.4 | 2.52 | 0.00005 |
| S100A8 | 8551.5 | 530.3 | 4.01 | 0.00005 |
| NFKB1 | 52.7 | 11.7 | 2.17 | 0.00005 |
| SOCS1 | 30.9 | 2.53 | 3.61 | 0.00005 |
| IL-1β | 356.5 | 15.9 | 4.49 | 0.00005 |
| TLR4 | 35.5 | 7.7 | 2.21 | 0.00005 |
| EIF2AK2 | 16.7 | 3.1 | 2.44 | 0.00005 |
| TICAM1 | 26.1 | 6.46 | 2.01 | 0.00005 |
| CD40LG | 1.77 | 10.5 | −2.57 | 0.00005 |
| TLR2 | 167.0 | 29.2 | 2.51 | 0.00005 |
| CAMP | 73.4 | 7.22 | 3.35 | 0.00005 |
| IL-8 | 17.4 | 0.65 | 4.75 | 0.00005 |
| MAPK14 | 99.3 | 11.4 | 3.19 | 0.00005 |
| HGF | 14.9 | 1.07 | 3.80 | 0.00005 |
| TGM2 | 16.6 | 4.10 | 2.02 | 0.0002 |
| IRF7 | 124.5 | 26.8 | 2.21 | 0.00005 |
| HIF1A | 46.8 | 6.08 | 2.95 | 0.00005 |
| C3 | 21.6 | 0.45 | 5.57 | 0.00005 |
| NFKBIA | 341.5 | 40.7 | 3.07 | 0.00005 |
| TLR5 | 30.2 | 3.66 | 3.05 | 0.00005 |
| NFE2L2 | 50.6 | 12.0 | 2.07 | 0.00005 |
| TGFA | 4.78 | 1.08 | 2.15 | 0.00005 |
| CYP1B1 | 16.0 | 1.60 | 3.32 | 0.00005 |
| MAP3K8 | 19.8 | 3.67 | 2.43 | 0.00005 |
The gene ontology analysis demonstrated the activation of biological processes such as cellular movement, cell-to-cell signaling and interaction, immune cell trafficking, and inflammatory response (Figure 2). There was a predominance of increased activity for hematologic system development and function as well as cellular function and maintenance genes, with simultaneous down-regulation of cell death and survival genes. Pathway enrichment analysis revealed differential expression of key sepsis pathways: Toll-like receptor, NF-kB, IL-10, TREM1, IL-6, p38 MAPK, iCOS-iCOSL signaling in T helper cells, T Cell receptor, Granulocyte Adhesion and diapedesis, and CCR5 Signaling in Macrophages (Supplemental Figure 3). The regulatory analysis depicted a very cohesive interaction between all regulatory genes and their interactive molecules during sepsis (p<.01) (Supplemental Figure 4). We identified that NF-kB1, IL1B, MAPK14, and HIF1A were key regulators during sepsis, among others (Supplemental Figure 5). Finally, we identified the top upregulated genes, top down-regulated genes, the top regulatory genes as key molecules driving the sepsis phenotype. These 45 transcripts were the basis for analysis of our validation sets (Table 2).
Figure 2.

Functional enrichment analysis of genes that are differentially expressed in during sepsis identified by comparing 0 vs 90 Days sample. This downstream effects analysis depicts those biological processes and functions likely to be casually affected by up- and down-regulated genes. Furthermore, it also predicts whether those processes are increased (Blue) or decreased (Yellow). The major boxes represent a category of related functions. Each individual colored rectangle is a particular biological function. The size of the rectangles is correlated with increasing overlap significance (using FET P-value). The analysis found activation of processes linked to inflammatory response and immune cell trafficking as well as deactivation of genes linked to cell death and survival.
Validation set
The validation set included 18 ED patients with sepsis, and 25 ED patients without an acute infection that served as controls. The sepsis cohort was relatively older than the non-septic patients and had a higher comorbid burden overall. The validation sepsis subjects had an overall mortality of 12.5% (Table 1).
In our validation, using real-time PCR to assay for gene expression levels for the 45 gene targets identified in our derivation set, 34/45 (76%) of genes maintained significance in the direction of the original dataset when comparing septic patients with non-infected controls after adjusting for multiplicity testing (Table 3).
Table 3:
Validation of Top up- and down-regulated genes and key regulatory genes in sepsis
| Top Down-Regulated Genes | Controls n=25 |
Sepsis n=18 |
Log 2 fold change | P-Value (BH) |
|---|---|---|---|---|
| IL-1α | 0.03 | 0.04 | 0.49 | 0.26 |
| LGALS2 | 1.90 | 0.40 | −2.26 | 0.0003 |
| CCL20 | 0.00 | 0.01 | 1.06 | 0.17 |
| PLD4 | 1.66 | 0.13 | −3.73 | 0.0000003 |
| TIGD3 | 0.76 | 0.11 | −2.75 | 0.00000002 |
| PPP2R2B | 0.53 | 0.09 | −2.51 | 0.0009 |
| CCR3 | 4.87 | 1.15 | −2.08 | 0.0000008 |
| FXYD7 | 0.09 | 0.01 | −2.85 | 0.000002 |
| ALOX15 | 1.50 | 0.05 | −4.79 | 0.004 |
| ADAMTS10 | 0.63 | 0.10 | −2.68 | 0.00000006 |
| FCER1A | 3.78 | 0.33 | −3.51 | 0.00000000 |
| CYP2S1 | 0.63 | 0.19 | −1.76 | 0.0002 |
| Top Up-Regulated Genes | ||||
| GPR84 | 0.28 | 6.11 | 4.43 | 0.0000004 |
| MMP8 | 0.87 | 48.96 | 5.81 | 0.0007 |
| OLFM4 | 0.36 | 5.52 | 3.96 | 0.006 |
| LCN2 | 0.97 | 12.23 | 3.65 | 0.0009 |
| ANKRD22 | 0.55 | 8.31 | 3.91 | 0.0007 |
| TNFAIP6 | 3.78 | 0.33 | −3.51 | 0.00000001 |
| G0S2 | 0.77 | 5.15 | 2.74 | 0.0000022 |
| CCL3 | 0.50 | 0.29 | −0.80 | 0.02 |
| Regulatory Genes | ||||
| OSM | 1.37 | 7.05 | 2.36 | 0.000002 |
| CEBPB | 22.49 | 60.58 | 1.43 | 0.000002 |
| S100A8 | 167.60 | 1524.61 | 3.19 | 0.00002 |
| NFKB1 | 4.35 | 5.35 | 0.30 | 0.08 |
| SOCS1 | 2.50 | 3.88 | 0.63 | 0.28 |
| IL-1β | 8.32 | 17.17 | 1.05 | 0.0008 |
| TLR4 | 23.11 | 57.08 | 1.30 | 0.00004 |
| EIF2AK2 | 1.88 | 2.98 | 0.67 | 0.15 |
| TICAM1 | 1.93 | 1.89 | 0.87 | |
| CD40LG | 3.73 | 0.71 | −2.38 | 0.0000004 |
| TLR2 | 30.12 | 73.27 | 1.28 | 0.00002 |
| CAMP | 3.25 | 6.90 | 1.09 | 0.05 |
| IL-8 | 0.62 | 1.10 | 0.82 | 0.14 |
| MAPK14 | 25.82 | 102.19 | 1.98 | 0.00000009 |
| HGF | 0.87 | 6.41 | 2.88 | 0.0009 |
| TGM2 | 0.49 | 0.61 | 0.31 | 0.27 |
| IRF7 | 6.51 | 11.85 | 0.86 | 0.026 |
| HIF1A | 4.99 | 11.19 | 1.16 | 0.00002 |
| C3 | 0.13 | 0.22 | 0.79 | 0.11 |
| NFKBIA | 8.37 | 17.74 | 1.08 | 0.000002 |
| TLR5 | 2.40 | 12.46 | 2.37 | 0.0000001 |
| NFE2L2 | 9.78 | 16.08 | 0.72 | 0.0007 |
| TGFA | 1.94 | 4.30 | 1.15 | 0.0009 |
| CYP1B1 | 5.89 | 24.79 | 2.07 | 0.001 |
| MAP3K8 | 1.95 | 3.11 | 0.67 | 0.006 |
DISCUSSION
This study identified key biological pathways in sepsis using deep sequencing of leukocyte transcription profiles. This technique allows us to describe global transcriptional changes during sepsis and provides insights into the pathophysiology underlying the sepsis phenotype. The analysis revealed a complex and highly dynamic response to sepsis: 910 unique genes were differentially expressed in sepsis. We used functional and pathway enrichment analysis and regulatory analysis to hypothesize how the up- and down-regulation of these genes creates the physiologic changes we characterize as sepsis. Furthermore, this study demonstrates the dynamic downstream effects of sepsis transcriptional activity, activating of cellular processes linked to immune cell trafficking, inflammatory response, cellular movement as well as cell-to-cell signaling and interaction. A total of 43 functional pathways were identified as being enriched during sepsis. Of these, the top 10 enriched pathways were closely associated with inflammation and response to infection, in particular NF-KB, Toll-like receptors, p38 MAPK, and IL-1β. Finally, we use an approach in the derivation cohort of using a patient as their own internal control which removes inter-subject variability for the comparison and represents an attractive design for future investigations.
NF- ΚB pathways were prominent components of the transcriptional phenotype seen in our patients during sepsis. This pathway has been previously identified as crucial for the activation of innate immunity and inflammation. NF- ΚB decreases apoptosis and has a pathologic role in sepsis. Signaling pathways initiated by engagement of toll-like receptors, such as TLR2 and TLR4 lead to increased production of NF- ΚB. Independent studies have shown that increased levels of NF-KB are associated with higher mortality in patients with sepsis.[9, 10]
In the interactive regulatory analysis, we found that TLR2, TLR4, and TLR5 all exhibited a prominent role during sepsis. The toll-like receptor signaling axis initiates the innate immune response and helps to regulate the adaptive immune response. Toll-like receptor expression is up-regulated in experimental models of sepsis and human studies of sepsis [11, 12]. TLR-2 and TLR4 are known to recognize Gram-positive and Gram-negative bacteria,[13] and all three TLR’s were up-regulated in sepsis in prior studies[14].
Similarly, the p38 MAPK pathway was enriched in this study, with MAPK14 and MAP3K8 acting as top regulatory genes. The p38 MAPK pathway is responsible for intracellular signal transduction. MAPK14 is up-regulated up to 48 hours prior to clinical sepsis[14] and exhibits increased activity after cecal ligation and puncture models of sepsis[15]. Our study placed MAPK14 at the center of the interactive network of regulatory molecules during sepsis.
IL-1β also occupied a central role in sepsis regulation during the regulatory network analysis (Supplemental Figure 6). High plasma concentrations of IL-1β are important mediators in the pathogenesis of septic shock and to correlate with sepsis severity [16, 17]. In fact most of the significant differentially expressed interleukins in our study were up-regulated (IL-1R1, IL-1R2, IL-1β, IL-4R, IL-8, IL-1RAP, IL-17RA, IL-18R1, IL-18RAP) and only one was downregulated (IL-2RB)
Beyond delineating the relationships between known players in the sepsis phenotype, using deep sequencing techniques also revealed genes differentially expressed during clinical sepsis, for example FCER1A. This gene is closely related to several pathways involved in both innate and adaptive immune responses.[18, 19] High FCER1A expression levels have been associated with bacterial meningitis.[20] CCR3 is a receptor for chemokines and is best known as an alternative entry receptor for HIV-1.[21] Its eosinophil expression appears depressed in septic shock,[22] but CCR3 expression has not been heavily investigated in neutrophils in the setting of sepsis. CEBPB is a transcription factor involved in the innate immune response and in general inflammation. This gene has been implicated in sepsis-induced muscle cachexia in animal studies, but has not been investigated in clinical sepsis.[23, 24]
Prior studied have utilized transcriptional profiling extensively in experimental models of sepsis to gain new insights into complex disease pathways,[14, 25–27] identify diagnostic and prognostic biomarkers,[14, 25, 26, 28–32] and examine the impact of therapeutic treatments.[27, 33–35] While generating intriguing results, the genomic coverage provided in these studies was limited by the inability to fully catalogue and quantify the diverse RNA molecules expressed through the use of conventional microarray or PCR-based assays. High background levels due to cross-hybridization, as well as a reliance upon existing knowledge about genome sequence, allows our study to expand upon these prior investigations.
RNA sequencing is unlike microarray-based technologies since it is not limited to detecting transcripts corresponding to existing known genomic sequences. Since we are not trying to fit the biology onto a chip with fixed primers, RNA sequencing can detect the expected and unexpected RNA expression. Furthermore, compared to DNA microarrays, RNA sequencing has very low background noise, has a high dynamic range (>9,000 fold expression range).[7] Lastly, the presence of distinct mRNA isoforms for genes is not possible to detect using hybridization techniques. Distinct isoforms of genes may be responsible for unique biological functions. Thus, prior investigations using microarray techniques may have under-characterized the contribution of certain mRNA’s and their role in the regulatory genome.
Future studies with larger sample sizes are needed to validate our findings. Further exploration into subgroups including sepsis severity, infection focus, comorbidities, and microbiological diagnosis is warranted. Lastly, other analyses including epigenetics, genomics, proteomics, and metabolomics should be assessed for a more integrative view of the disease process to create a systems biology approach. The additional inclusion of miRNA (MicroRNA) in the analysis may reveal other important interactions between non-coding RNA and mRNA that may change the interpretation of the data at hand.
There are a number of limitations to our study. First, the number of patients included in this study was relatively small, and the samples were obtained from a heterogeneous cohort of patients and controls. The small sample size increases the likelihood of Type I and Type II errors, although using derivation the cohort patients as their own internal controls decreases the impact of sample size. Secondly, given our research design, patients included in the derivation cohort were by definition biased towards survivors. Third, we did not investigate the biological response in a temporal fashion with multiple time points. Fourth, we assume that our leukocyte population represents neutrophils based on their predominance, when in fact other cell types involved in the immune response may exhibit other transcriptional changes. Fifth, misclassification bias is potentially inherent in any diagnosis study of sepsis due to the lack of a gold standard of the diagnosis. Sixth, sepsis represents a broad and heterogeneous group of patients and given the relatively small numbers of our derivation and validation set, may may not have captured this in a representative way. Sixth, while using patients as therir own internal controls is a strength in the derivation set, it is a limitation in that if the controls were improperly matched, there could be unmeasured confounding limiting our results. Seventh, we do not have corresponding protein expression so we do not know the downstream expression of the identified mRNA transcripts. Finally, the magnitude of change is not necessarily related to biologic activity and other mRNA transcripts may be more influential than the ones that we identified.
CONCLUSION
Novel RNA sequencing techniques can provide insight into the molecular response of sepsis. This study quantifies the transcriptional response of leukocytes in sepsis, and it identifies key activated pathways and master regulatory genes that contribute to the sepsis syndrome. These findings shed light on the regulation of the genome-wide transcriptional activity and may open new research areas for novel biomarkers and therapies.
Supplementary Material
Schematic flow chart of the study recruitment and design.
Principle Component Analysis. Principle component analysis (PCA) of gene expression profiling data of paired 0 day (sepsis) and control (90 days later) patients RNA sequencing data. The 0 and 90 days samples are shown with red and blue colors respectively. The control (90 days) samples form separate cluster from active sepsis (0 days) samples from same patients.
Pathway enrichment analysis. Pathway enrichment analysis of genes that are differentially expressed during sepsis identified by comparing 0 vs 90 Days samples. This analysis depicts the significant effect on key inflammation-related pathways that include IL-10 signaling, IL-6 signaling, NF-kB signaling, toll like receptor signaling and p38 MAPK signaling.
Interactive network-of top regulatory molecules. Interactive network-of top regulatory molecules whose interactive molecules are significantly activated during sepsis. This analysis depicts a very cohesive interaction (p<.01) between all regulatory which themselves as well as their interactive molecules are significantly activated during sepsis. In this network, each node represents a gene and each edge represents interaction between genes. The gene classes are represented by different symbols as depicted in the legend. The intensity of the node color indicates the degree of up-regulation (green) and down-regulation (red).
Network representation of the biological processes underlying the septic response of blood leukocytes. We have expanded the network by focusing on the genes (blue) with the most connections and the most significant downstream effects: Group A, MAPK14. Group B, TLR4. Group C, IRF7. Group D, IL-1α. Group E, IL-1β. We used the Ingenuity Pathway Analysis tool (http://www.ingenuity.com) to generate the networks. The gene classes are represented by different symbols as we depict in the legend.
IL-1β Regulatory Effects. Upstream regulator analysis. IL-1β was positioned centrally in our network analysis suggesting a key role in sepsis. IL-1β regulates many upstream transcriptional regulators. The intensity of the node color indicates the degree of up-regulation (green) and down-regulation (red). The gene classes are represented by different symbols as we depict in the legend. Blue lines: activators. Yellow: deactivators.
Acknowledgements
The present work was supported by grants from Aarhus University, Denmark to SS. The authors would like to thank AC Bracey for clinical assistance.
Grant Support: This study was supported in part by A.P. Møller Fonden til Lægevidenskabens Fremme, Augustinus Fonden, and Frimodt Heineke Fonden.
Funding
This study was supported in part by A.P. Møller Fonden til Lægevidenskabens Fremme, Augustinus Fonden, and Frimodt Heineke Fonden.
Footnotes
DECLARATIONS
Ethics Approval and Consent to Participate
The Committee on Clinical Investigations at Beth Israel Deaconess Medical Center, Boston, MA, and the Institutional Review Board at Saint Vincent Hospital, Worcester, MA, both approved this study, and written consent was obtained for each subject enrolled.
Availability of data and material
All data generated or analyzed during this study are included in this published article
Competing Interests
The authors declare that they have no competing interests.
REFERENCES
- 1.Angus DC, Linde-Zwirble WT, Lidicker J, Clermont G, Carcillo J, Pinsky MR. Epidemiology of severe sepsis in the United States: analysis of incidence, outcome, and associated costs of care. Crit Care Med 29(7):1303–1310, 2001. [DOI] [PubMed] [Google Scholar]
- 2.Shapiro NI, Wolfe RE, Moore RB, Smith E, Burdick E, Bates DW. Mortality in Emergency Department Sepsis (MEDS) score: a prospectively derived and validated clinical prediction rule. Crit Care Med 31(3):670–675 2003. [DOI] [PubMed] [Google Scholar]
- 3.Kumar G, Kumar N, Taneja A, Kaleekal T, Tarima S, McGinley E, Jimenez E, Mohan A, Khan RA, Whittle J, et al. Nationwide trends of severe sepsis in the 21st century (2000–2007). Chest 140(5):1223–1231, 2011. [DOI] [PubMed] [Google Scholar]
- 4.Skibsted S, Bhasin MK, Aird WC, Shapiro NI. Bench-to-bedside review: Future novel diagnostics for sepsis - a systems biology approach. Crit Care 17(5):231, 2013. [DOI] [PMC free article] [PubMed] [Google Scholar]
- 5.Wong HR. Clinical review: sepsis and septic shock--the potential of gene arrays. Crit Care 16(1):204, 2012. [DOI] [PMC free article] [PubMed] [Google Scholar]
- 6.Wang Z, Gerstein M, Snyder M. RNA-Seq: a revolutionary tool for transcriptomics. Nat Rev Genet 10(1):57–63, 2009. [DOI] [PMC free article] [PubMed] [Google Scholar]
- 7.Bone RC, Sibbald WJ, Sprung CL. The ACCP-SCCM consensus conference on sepsis and organ failure. Chest 101(6):1481–1483, 1992. [DOI] [PubMed] [Google Scholar]
- 8.Bone RC, Balk RA, Cerra FB, Dellinger RP, Fein AM, Knaus WA, Schein RM, Sibbald WJ. Definitions for sepsis and organ failure and guidelines for the use of innovative therapies in sepsis. The ACCP/SCCM Consensus Conference Committee. American College of Chest Physicians/Society of Critical Care Medicine. Chest Jun;101(6):1644–55,1992. [DOI] [PubMed] [Google Scholar]
- 9.Bohrer H, Qiu F, Zimmermann T, Zhang Y, Jllmer T, Männel D, Böttiger BW, Stern DM, Waldherr R, Saeger HD, et al. Role of NFkappaB in the mortality of sepsis. J Clin Invest 100(5):972–985, 1997. [DOI] [PMC free article] [PubMed] [Google Scholar]
- 10.Arnalich F, Garcia-Palomero E, Lopez J, Jiménez M, Madero R, Renart J, Vázquez JJ, Montiel C. Predictive value of nuclear factor kappaB activity and plasma cytokine levels in patients with sepsis. Infect Immun 68(4):1942–1945, 2000. [DOI] [PMC free article] [PubMed] [Google Scholar]
- 11.Tsujimoto H, Ono S, Hiraki S, Majima T, Kawarabayashi N, Sugasawa H, Kinoshita M, Hiraide H, Mochizuki H. Hemoperfusion with polymyxin B-immobilized fibers reduced the number of CD16+ CD14+ monocytes in patients with septic shock. J Endotoxin Res 10(4):229–237, 2004. [DOI] [PubMed] [Google Scholar]
- 12.Armstrong L, Medford AR, Hunter KJ, Uppington KM, Millar AB. Differential expression of Toll-like receptor (TLR)-2 and TLR-4 on monocytes in human sepsis. Clin Exp Immunol 136(2):312–319, 2004. [DOI] [PMC free article] [PubMed] [Google Scholar]
- 13.Takeda K, Kaisho T, Akira S. Toll-like receptors. Annu Rev Immunol 21:335–376, 2003. [DOI] [PubMed] [Google Scholar]
- 14.Johnson SB, Lissauer M, Bochicchio GV, Moore R, Cross AS, Scalea TM. Gene expression profiles differentiate between sterile SIRS and early sepsis. Ann Surg 245(4):611–621, 2007. [DOI] [PMC free article] [PubMed] [Google Scholar]
- 15.Maitra SR, Chen E, Rosa D, Valane PD, El-Maghrabi MR, Brathwaite CE. Modulations of signal transduction pathways during sepsis and the effects of insulin and mifepristone. Acad Emerg Med 10(1):1–8, 2003. [DOI] [PubMed] [Google Scholar]
- 16.van Deuren M, van der Ven-Jongekrijg J, Vannier E, van Dalen R, Pesman G, Bartelink AK, Dinarello CA, van der Meer JW. The pattern of interleukin-1beta (IL-1beta) and its modulating agents IL-1 receptor antagonist and IL-1 soluble receptor type II in acute meningococcal infections. Blood 90(3):1101–1108, 1997. [PubMed] [Google Scholar]
- 17.Cannon JG, Tompkins RG, Gelfand JA, Michie HR, Stanford GG, van der Meer JW, Endres S, Lonnemann G, Corsetti J, Chernow B, et al. Circulating interleukin-1 and tumor necrosis factor in septic shock and experimental endotoxin fever. J Infect Dis 161(1):79–84, 1990. [DOI] [PubMed] [Google Scholar]
- 18.van Vugt MJ, Kleijmeer MJ, Keler T, Zeelenberg I, van Dijk MA, Leusen JH, Geuze HJ, van de Winkel JG. The FcgammaRIa (CD64) ligand binding chain triggers major histocompatibility complex class II antigen presentation independently of its associated FcR gamma-chain. Blood 94(2): 808–817, 1999. [PubMed] [Google Scholar]
- 19.Ernst LK, Duchemin AM, Miller KL, Anderson CL. Molecular characterization of six variant Fcgamma receptor class I (CD64) transcripts. Mol Immunol 35(14–15):943–954, 1998. [DOI] [PubMed] [Google Scholar]
- 20.Lill M, Koks S, Soomets U, Schalkwyk LC,Fernandes C, Lutsar I, Taba P. Peripheral blood RNA gene expression profiling in patients with bacterial meningitis. Front Neurosci 7:33, 2013. [DOI] [PMC free article] [PubMed] [Google Scholar]
- 21.Choe H, Farzan M, Sun Y, Sullivan N, Rollins B, Ponath PD, Wu L, Mackay CR, LaRosa G, Newman W, et al. The beta-chemokine receptors CCR3 and CCR5 facilitate infection by primary HIV-1 isolates. Cell 85(7):1135–1148, 1996. [DOI] [PubMed] [Google Scholar]
- 22.Venet F, Lepape A, Debard AL, Bienvenu J, Bohé J, Monneret G. The Th2 response as monitored by CRTH2 or CCR3 expression is severely decreased during septic shock. Clin Immunol 113(3):278–284, 2004. [DOI] [PubMed] [Google Scholar]
- 23.Aare S, Radell P, Eriksson LI, Chen YW, Hoffman EP, Larsson L. Role of sepsis in the development of limb muscle weakness in a porcine intensive care unit model. Physiol Genomics 44(18):865–877, 2012. [DOI] [PubMed] [Google Scholar]
- 24.Penner G, Gang G, Sun X, Wray C, Haselgren PO. C/EBP DNA-binding activity is upregulated by a glucocorticoid-dependent mechanism in septic muscle. Am J Physiol Regul Integr Comp Physiol 282(2):R439–444, 2002. [DOI] [PubMed] [Google Scholar]
- 25.Calvano SE, Xiao W, Richards DR, Felciano RM, Baker HV, Cho RJ, Chen RO, Brownstein BH, Cobb JP, Tschoeke SK, et al. A network-based analysis of systemic inflammation in humans. Nature 437(7061):1032–1037, 2005. [DOI] [PubMed] [Google Scholar]
- 26.Tang BM, McLean AS, Dawes IW, Huang SJ, Lin RC. Gene-expression profiling of peripheral blood mononuclear cells in sepsis. Crit Care Med 37(3):882–888, 2009. [DOI] [PubMed] [Google Scholar]
- 27.Wong HR, Cvijanovich N, Allen GL, Lin R, Anas N, Meyer K, Freishtat RJ, Monaco M, Odoms K, Sakthivel B, et al. Genomic expression profiling across the pediatric systemic inflammatory response syndrome, sepsis, and septic shock spectrum. Crit Care Med 37(5):1558–1566, 2009. [DOI] [PMC free article] [PubMed] [Google Scholar]
- 28.Lissauer ME, Johnson SB, Bochicchio GV, Feild CJ, Cross AS, Hasday JD, Whiteford CC, Nussbaumer WA, Towns M, Scalea TM. Differential expression of toll-like receptor genes: sepsis compared with sterile inflammation 1 day before sepsis diagnosis. Shock 31(3):238–244, 2009. [DOI] [PubMed] [Google Scholar]
- 29.Cobb JP, Moore EE, Hayden DL, Minei JP, Cuschieri J, Yang J, Li Q, Lin N, Brownstein BH, Hennessy L,et al. Validation of the riboleukogram to detect ventilator-associated pneumonia after severe injury. Ann Surg 250(4):531–539, 2009. [DOI] [PMC free article] [PubMed] [Google Scholar]
- 30.Pachot A, Cazalis MA, Venet F, Turrel F, Faudot C, Voirin N, Diasparra J, Bourgoin N, Poitevin F, Mougin B, et al. Decreased expression of the fractalkine receptor CX3CR1 on circulating monocytes as new feature of sepsis-induced immunosuppression. J Immunol 180(9):6421–6429, 2008. [DOI] [PubMed] [Google Scholar]
- 31.Nowak JE, Wheeler DS, Harmon KK, Wong HR. Admission chemokine (C-C motif) ligand 4 levels predict survival in pediatric septic shock. Pediatr Crit Care Med 11(2):213–216, 2010. [DOI] [PMC free article] [PubMed] [Google Scholar]
- 32.Wong HR, Lindsell CJ, Pettila V, Meyer NJ, Thair SA, Karlsson S, Russell JA, Fjell CD, Boyd JH, Ruokonen E, et al. A Multibiomarker-Based Outcome Risk Stratification Model for Adult Septic Shock. Crit Care Med Apr;42(4):781–9, 2014. [DOI] [PMC free article] [PubMed] [Google Scholar]
- 33.Pathan N, Hemingway CA, Alizadeh AA, Stephens AC, Boldrick JC, Oragui EE, McCabe C, Welch SB, Whitney A, O’Gara P, et al. Role of interleukin 6 in myocardial dysfunction of meningococcal septic shock. Lancet 363(9404):203–209, 2004. [DOI] [PubMed] [Google Scholar]
- 34.Wong HR, Cvijanovich N, Lin R, Allen GL, Thomas NJ, Willson DF, Freishtat RJ, Anas N, Meyer K, Checchia PA, et al. Identification of pediatric septic shock subclasses based on genome-wide expression profiling. BMC Med 7:34, 2009. [DOI] [PMC free article] [PubMed] [Google Scholar]
- 35.Solan PD, Dunsmore KE, Denenberg AG, Odoms K, Zingarelli B, Wong HR A novel role for matrix metalloproteinase-8 in sepsis. Crit Care Med 40(2):379–387, 2012. [DOI] [PMC free article] [PubMed] [Google Scholar]
Associated Data
This section collects any data citations, data availability statements, or supplementary materials included in this article.
Supplementary Materials
Schematic flow chart of the study recruitment and design.
Principle Component Analysis. Principle component analysis (PCA) of gene expression profiling data of paired 0 day (sepsis) and control (90 days later) patients RNA sequencing data. The 0 and 90 days samples are shown with red and blue colors respectively. The control (90 days) samples form separate cluster from active sepsis (0 days) samples from same patients.
Pathway enrichment analysis. Pathway enrichment analysis of genes that are differentially expressed during sepsis identified by comparing 0 vs 90 Days samples. This analysis depicts the significant effect on key inflammation-related pathways that include IL-10 signaling, IL-6 signaling, NF-kB signaling, toll like receptor signaling and p38 MAPK signaling.
Interactive network-of top regulatory molecules. Interactive network-of top regulatory molecules whose interactive molecules are significantly activated during sepsis. This analysis depicts a very cohesive interaction (p<.01) between all regulatory which themselves as well as their interactive molecules are significantly activated during sepsis. In this network, each node represents a gene and each edge represents interaction between genes. The gene classes are represented by different symbols as depicted in the legend. The intensity of the node color indicates the degree of up-regulation (green) and down-regulation (red).
Network representation of the biological processes underlying the septic response of blood leukocytes. We have expanded the network by focusing on the genes (blue) with the most connections and the most significant downstream effects: Group A, MAPK14. Group B, TLR4. Group C, IRF7. Group D, IL-1α. Group E, IL-1β. We used the Ingenuity Pathway Analysis tool (http://www.ingenuity.com) to generate the networks. The gene classes are represented by different symbols as we depict in the legend.
IL-1β Regulatory Effects. Upstream regulator analysis. IL-1β was positioned centrally in our network analysis suggesting a key role in sepsis. IL-1β regulates many upstream transcriptional regulators. The intensity of the node color indicates the degree of up-regulation (green) and down-regulation (red). The gene classes are represented by different symbols as we depict in the legend. Blue lines: activators. Yellow: deactivators.