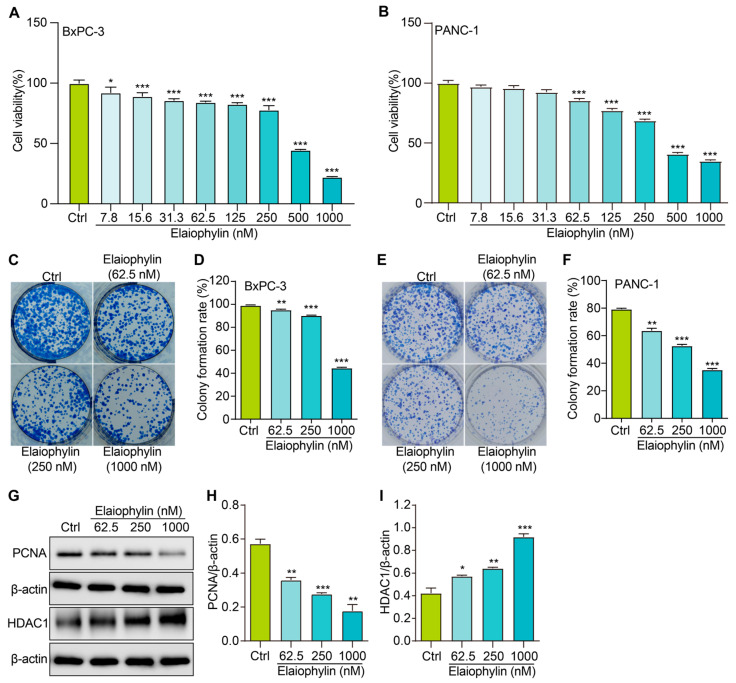
Figure 2.
Elaiophylin inhibits the proliferation of BxPC-3 and PANC-1 cells. (A) The bar chart indicates the cell viability of BxPC-3 cells treated with elaiophylin at indicated concentrations. (B) The bar chart indicates the cell viability of PANC-1 cells treated with elaiophylin at indicated concentrations. (C,E) Representative images of colony formation of BxPC-3 and PANC-1 cells treated with elaiophylin at indicated concentrations. (D,F) The bar chart indicates the colony-formation rate. (G) Representative western blotting images of PCNA, HDAC1, and β-actin in BxPC-3 cells treated with elaiophylin at indicated concentrations. The original western blotting images are shown in Figures S2 and S3. (H,I) Bar charts indicate the ratio of PCNA/β-actin and HDAC1/β-actin. Error bars, S.D.: * p < 0.05; ** p < 0.01; *** p < 0.001. Data are presented as mean ± SD from three independent experiments (n = 3).

