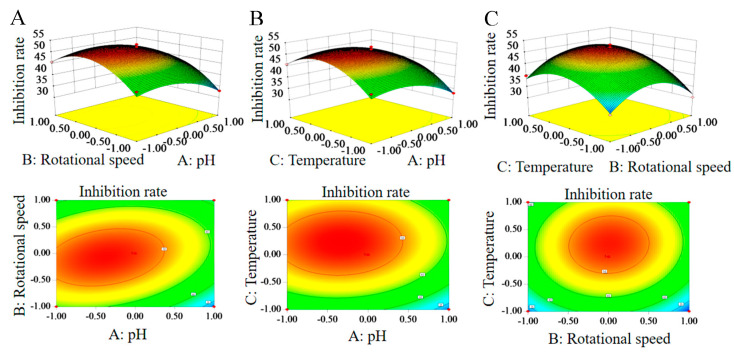
Figure 4.
The response surface methodology and contour plots of the effects of the interaction between rotational speed and pH (A), temperature and pH (B), and temperature and rotational speed (C) on the inhibition rate of the HYC-7 strain fermentation broth. Note: The incline degree of the surface diagram is directly proportional to the influence degree of factors on the response value. The larger the focal length of the contour, the stronger the interaction between parameters.

