Abstract
The Gram stain method was applied to the photometric characterization of aquatic bacterial populations with a charge-coupled device camera and an image analyzer. Escherichia coli and Bacillus subtilis were used as standards of typical gram-negative and gram-positive bacteria, respectively. A mounting agent to obtain clear images of Gram-stained bacteria on Nuclepore membrane filters was developed. The bacterial stainability by the Gram stain was indicated by the Gram stain index (GSI), which was applicable not only to the dichotomous classification of bacteria but also to the characterization of cell wall structure. The GSI spectra of natural bacterial populations in water with various levels of eutrophication showed a distinct profile, suggesting possible staining specificity that indicates the presence of a particular bacterial population in the aquatic environment.
Gram’s method is the most important and fundamental orthodox method for bacterial identification. It classifies bacteria into two groups, gram-negative and gram-positive. The mechanism of Gram staining is based on the fundamental structural and chemical attributes of bacterial cell walls. The cell walls of gram-positive bacteria have a high percentage of peptidoglycan, while those of gram-negative bacteria have only a thin peptidoglycan layer (1–3, 6). In Gram’s method, an insoluble dye-iodine complex is formed inside bacterial cells and is extracted by alcohol from gram-negative but not gram-positive bacteria (6, 12, 16). There are taxonomically gram-variable species, but some cells of gram-negative or gram-positive species may show gram-variable characteristics due to environmental stress, such as unsuitable nutrients, temperature, pH, or electrolytes (3).
Functional differences between gram-positive and gram-negative cell walls have been studied with special emphasis on nutrient uptake from the ambient environment. Gram-negative bacteria have a periplasmic space between the lipopolysaccharide layer and the plasma membrane. In this space, binding proteins initially attach to nutrients and take them to a membrane carrier. Gram-positive bacteria lack the periplasmic space and are believed to have no binding proteins (9). Therefore, nutrient uptake from the environment is easier for gram-negative bacteria than for gram-positive bacteria. Because of this difference, the population density of gram-negative bacteria in more oligotrophic environments could be higher than that of gram-positive bacteria (20).
Gram staining is commonly used only to reflect cell wall structure. If Gram staining characterizes not only simple taxonomical dichotomy but also multiple biological functions, it may also be used to correlate bacterial cell wall structure with related physiological responses to the environment. In particular, Gram staining could supply ecological information on natural bacterial populations that are difficult to culture by the present technology.
Membrane filter methods are widely used for microscopy in aquatic microbiology because of the low population densities of bacteria in many aquatic environments (4, 11, 16). However, these methods sometimes have problems associated with microscopic observations, causing unclear images of bacterial cells on Nuclepore filters when used with the conventional mounting medium (immersion oil; refractive index [nd] = 1.514). Hence, a suitable mounting agent must be applied to obtain precise image analyses of Gram-stained bacteria on Nuclepore filters.
In this study, we have established a distinct method to characterize photometric Gram stain images; it involves the Gram stain index (GSI) for specifying natural bacterial populations in various aquatic environments. For this purpose, we have standardized the GSI of typical gram-negative and gram-positive bacteria by using Escherichia coli and Bacillus subtilis, respectively, and compared these GSI values to those of natural bacterial populations of several freshwater environments. The natural waters we investigated were Hyoutaro-ike pond, Matsumi-ike bog, and Lake Kasumigaura, which are oligotrophic, mesotrophic, and eutrophic water bodies, respectively, as previously determined (8, 10, 13, 18, 22, 23).
MATERIALS AND METHODS
Samples.
As standards for gram-negative and gram-positive bacteria, E. coli JCM 1649 and B. subtilis JCM 1465 (14) were used, respectively. The standard strains were supplied by the Japan Collection of Microorganisms, Institute of Physical and Chemical Research (RIKEN, Saitama, Japan). Both strains were cultured for 20 h at 37°C in nutrient broth with 0.5% NaCl (5.0 g of peptone, 3.0 g of meat extract, 5.0 g of NaCl, 1 liter of distilled water) with the pH adjusted to 7.0 and used at the exponential growth phase to evaluate Gram stainability.
A predominant strain of the bacterial population in a strongly acidic hot spring was used as a representative of the most difficult Gram-staining cases. This sample was grown at 60°C in TB medium, consisting of (per liter of tap water) 10 g of Na2S2O3 · 5H2O, 0.25 g of K2HPO4, 0.5 g of NH4Cl, and 0.25 g of MgSO4 · 7H2O, adjusted to pH 5.0 (21).
We selected natural bacterial populations from an oligotrophic pond, Hyoutaro-ike, a mesotrophic bog, Matsumi-ike, and a eutrophic lake, Kasumigaura, and adjacent water bodies of the lake as representative of various trophic states for analytical case studies for this investigation. The bacterial cells in the water samples were fixed by adding 37% buffered formalin (sample/formalin ratio = 10:1) to the water samples immediately after collection.
Gram staining.
Bacterial cells on polycarbonate Nuclepore filters (no. 110606; pore size, 0.2 μm; diameter, 25 mm) were stained by the basic Gram method (contemporary modification) (16). The bacterial cells, which were vacuumed on the filters by a filtration apparatus (Millipore Co.), were stained for 1 min with a few drops of carbolic gentian violet (Wako solution A; Wako Pure Chemical Industries Ltd., Osaka, Japan) and then rinsed with prefiltered (Nuclepore filter; pore size, 0.2 μm) distilled water for 30 s under vacuum. The filters were then immersed for 1 min in several drops of Lugol solution (Wako solution B) and again rinsed with distilled water under vacuum. After removal of all the liquid, 95% ethanol was poured on the cells for 30 s to decolorize them. The bacteria were then counterstained for 1 min with Ziehl-diluted fuchsin (Wako solution C) and rinsed with distilled water. After being dried under vacuum, the filters were removed from the filtration apparatus. The bacteria on the filters were mounted on a glass slide with immersion oil, covered with a glass coverslip (thickness, ca. 0.15 mm), and sealed with nail enamel to avoid drying.
Evaluation of Gram staining.
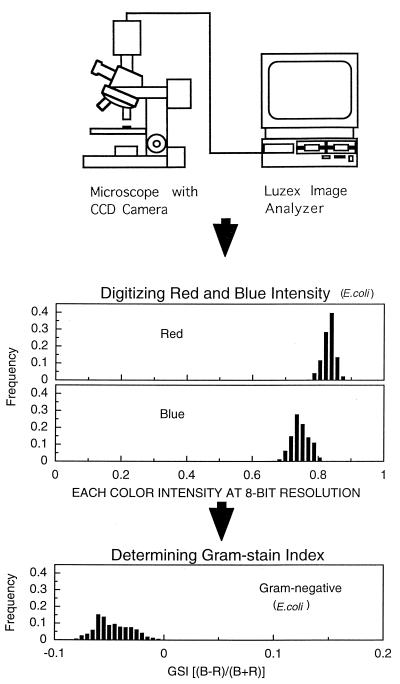
The mounted specimens were observed microscopically and analyzed photometrically under an optical microscope with a Fluor 100/1.30 oil Ph4DL 160/0.17 objective lens (Optiphot-2; Nikon, Tokyo, Japan), and the images were recorded (total magnification, ×2,500) with a 3-CCD charge-coupled device video camera (Sony, Tokyo, Japan). Each output from the video camera, red, green, and blue, was separately transferred to an image analyzer (Luzex III U; Nireco Co. Ltd., Tokyo, Japan) to digitize the intensity of each of the three primary colors on each pixel at 8-bit resolution (256 levels). Although every color of each bacterial cell can be described by digitized intensities of red, green, and blue the colors of Gram-stained cells distributed in the spectrum area of only red and blue (Fig. 1). Hence, the intensities of only red and blue were used to determine the characteristics of bacterial Gram staining (GSI) by the following equation: GSI = [(B − R)/(B + R)], where R and B are the intensities of red and blue, respectively. The GSI is zero when the intensities of red and blue are equal and positive if the blue intensity is higher than the red intensity. Theoretically, GSI values should range from −1 without blue light to +1 without red light. By dividing the difference of light intensities by the sum of light intensities, the fluctuations in the light source at each observation are canceled.
FIG. 1.
Schematic diagram of the equipment used for GSI determination.
Preparation of an original mounting medium.
The bacterial cells from a hot spring in the Tateyama Jigokudani Valley (17) were hardly visible when Gram stained on a Nuclepore filter and embedded in a standard immersion oil (nd = 1.514; Olympus, Tokyo, Japan), although they could be seen clearly when stained on a glass slide directly by the traditional method.
To solve this problem, improvements to the mounting agent were studied. We mixed the immersion oil and 1-bromonaphthalene (nd = 1.657; Wako Pure Chemical Industries Ltd.) in various ratios to achieve various refractive indices to try to minimize the light scattering by membrane filters in the mounting agent. To determine these ratios within the possible range for actual applications, the refractive indices of the mixtures were determined with a refractive index meter (1-T; Atago, Tokyo, Japan) and membrane transmittances were determined with a spectrophotometer (UV-550; Jasco, Tokyo, Japan). The effects of these mounting agents in actual microscopic observations were determined with double-stained standard bacterial samples (see below).
Double staining with the Gram stain and acridine orange.
Cultured bacterial cells (E. coli, B. subtilis, and a bacterial strain isolated from the Tateyama Jigokudani hot spring) at the exponential growth phase in liquid media (nutrient broth for E. coli and B. subtilis and TB medium for the Jigokudani strain) were fixed by adding 37% buffered formalin (sample/formalin ratio = 10:1). These were stained on the Nuclepore filters with both the Gram-staining reagents and an acridine orange solution (acridine orange at 1:10,000 in 6.6 mM phosphate buffer [pH 6.6]). The Gram stain was made by the basic Gram method of staining (contemporary modification) (16). After regular Gram staining with carbolic gentian violet and Lugol solution and decolorization, acridine orange solution was used for the epifluorescence microscopy (20) to ensure that all bacterial cells present were made visible by the Gram stain. Then, the bacterial sample on the filter was counterstained with Ziehl-diluted fuchsin to complete the Gram staining. After staining, each filter was cut into eight pieces. Each piece was mounted with a different mounting agent, which had various refractive indices. The number of bacterial cells in each field was counted under an epifluorescence microscope (EFD2; Nikon) with a B-2A filter and Hg 100-W bulb, using fluorescence for the acridine orange and transmitted light for the Gram stain. The fraction of bacterial cells observable by the Gram staining compared to that observable by fluorescence staining was determined.
Confirmation of water sample type.
We performed chemical analysis to characterize the extent of eutrophication of the various water bodies sampled. Water samples were filtered, immediately upon collection, through precombusted (450°C for more than 2 h) Whatman GF/C fiberglass filters (15) and stored at −20°C until used for analysis. The filtrates of these water samples were analyzed for inorganic nutrients (ammonium, nitrite, nitrate, and phosphate) with an autoanalyzer (TARAKO, 8000; Technico, Tokyo, Japan) that operates based on the standard method (7) and for dissolved organic carbon with a total organic carbon (TOC) analyzer (TOC-5000; Shimadzu, Kyoto, Japan).
RESULTS AND DISCUSSION
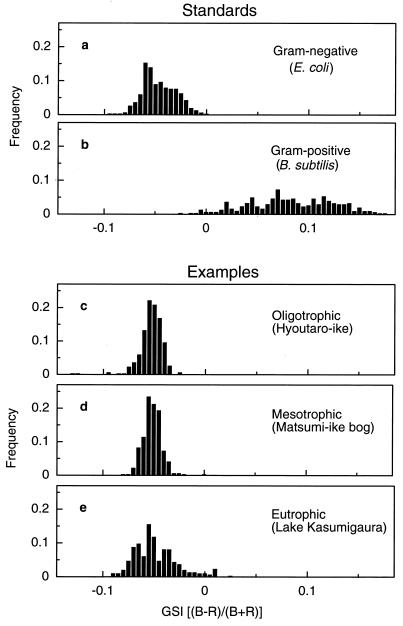
The GSI spectra of E. coli and B. subtilis were distinctly different (Fig. 2a and b). The GSI of E. coli cells, a typical gram-negative bacterium, ranged from −0.095 to 0 (average and 95% confidence limit, −0.047 ± 0.017 for 300 bacterial cells) with a sharp maximal peak at −0.06 and a broad shoulder at higher GSI values. On the other hand, the GSI of B. subtilis cells, a typical gram-positive bacterium, was in the broader range of −0.070 to 0.175 (average and 95% confidence limit, 0.082 ± 0.043 for 300 bacterial cells) with a low maximal peak at 0.070. Clearly, gram-negative and gram-positive bacteria showed distinctly different GSI profiles. Hence, the GSI of these two typical bacteria can be used as the standards for typical gram-negative and gram-positive bacteria for comparison with those of other bacteria, as indicated by the average and range of the GSI peaks.
FIG. 2.
GSI of bacterial strains and populations. (a and b) GSI standards of the gram-negative bacterial strains (a) and the gram-positive bacterial strains (b). (c through e) Typical GSI standards of the natural bacterial populations from the oligotrophic water (c), mesotrophic water (d), and eutrophic water (e).
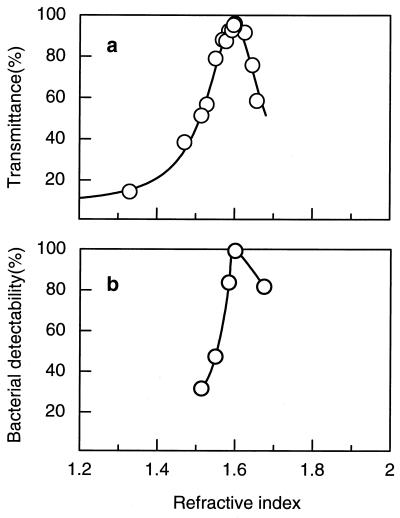
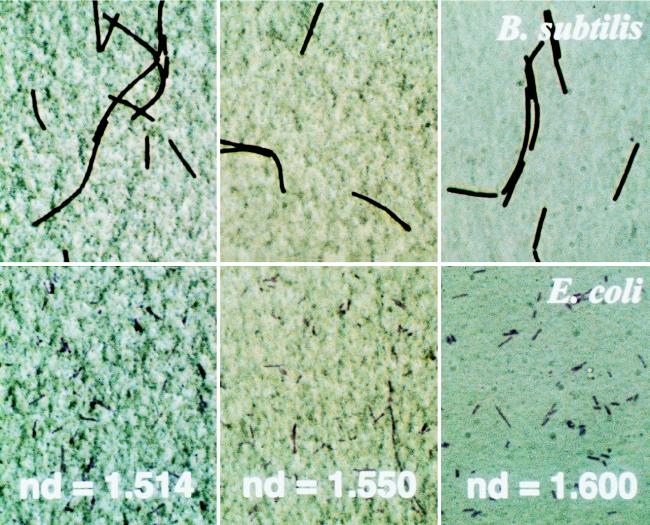
To obtain reasonably clear images of Gram-stained bacteria on Nuclepore filters, the appropriate mounting medium was selected. The optical transmittance of Nuclepore filters at a wavelength of 600 nm depended on the refractive index of the immersion medium. The highest transmittance (96%) was obtained at a refractive index of 1.600 by mixing the immersion oil (nd = 1.514) and 1-bromonaphthalene in a ratio of 1:3.6. By contrast, the transmittance of Nuclepore filters mounted in the commercial immersion oil (nd = 1.514) was 56% (Fig. 3a). In the medium with a refractive index of 1.600, the Gram-stained bacteria were clearly observed on the Nuclepore filter. We mounted E. coli and B. subtilis on Nuclepore filters embedded in mounting agents having different refractive indices (1.500, 1.514, and 1.600) (Fig. 4). The background of the bacteria embedded in the mounting agent with a refractive index of 1.600 was flat, and the brightness was uniform, so that the bacterial cells could be clearly seen. In contrast, when we used a mounting agent with a refractive index of 1.514, the filter pores were observed and the brightness was not uniform; the image appeared as if the whole membrane undulated, making the bacterial cells extremely difficult to observe. Observation of gram-negative cells was more difficult. The number of bacterial cells observable in the field when the filter was mounted with the agent with an nd of 1.514 was only about half that when mounted with the agent with an nd of 1.600.
FIG. 3.
(a) Optical transmittance of Nuclepore filters (pore size, 0.2 μm) mounted in immersion media with different refractive indices. (b) Detectability of bacterial cells from the Tateyama Jigokudani hot spring with mounting agents with different refractive indices (b).
FIG. 4.
Gram-stained images of E. coli (lower panels) and B. subtilis (upper panels) with mounting agents with refractive indices of 1.514, 1.550, and 1.600.
Comparison of bacterial number in the same microscopic field under epifluorescence and light microscopy, even using a bacterial strain isolated from the Tateyama Jigokudani hot spring, showed a much clearer image with the mounting agent whose nd is 1.600. In samples embedded in the mounting agent with an nd of 1.600, all the bacterial cells counted under the epifluorescence microscope were recognized under the light microscope. In contrast, only one-third of the bacterial cells counted with the mounting agent with an nd of 1.514 under epifluorescence were observable under the light microscope (Fig. 3b). Thus, observation of Gram-stained bacteria with an appropriate mounting agent is very important for the differentiation of gram-negative from gram-positive cells by the GSI method.
The presence of organic solvents in the mounting agent can affect the Gram-stain spectra. 1-Bromonaphthalene was used to adjust the commercial immersion oil to the most appropriate refractive index. The GSI values of E. coli and B. subtilis cells mounted in the best medium (nd = 1.600) and stored at room temperature were examined every 10 days for 1 month. No decolorization of E. coli was observed during this observation period. Although there was no significant change in the GSI profile of B. subtilis until day 20 after mounting, a small peak at 0.080 had decreased on day 30 to the same height as that of gram-negative cells. Therefore, we recommend that bacterial specimens be examined by microscopy within 3 weeks of fixation.
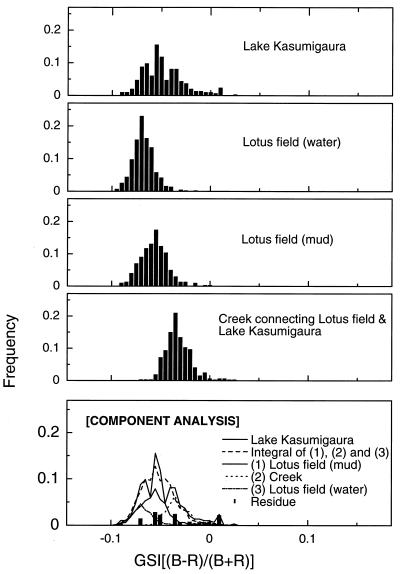
The GSI spectra of natural bacterial populations in Hyoutaro-ike pond, Matsumi-ike bog, and Lake Kasumigaura showed different profiles over the ranges of −0.095 to −0.025, −0.080 to 0.000, and −0.090 to 0.025, respectively. However, the highest peak in each of these profiles appeared at the same GSI value of −0.055, (Fig. 2c to e). The averages and 95% confidence limits of GSI in those populations were −0.056 ± 0.011 at Hyoutaro-ike pond, −0.054 ± 0.009 at Matsumi-ike bog, and −0.051 ± 0.021 at Lake Kasumigaura. Therefore, by comparing these GSI spectra with those of E. coli and B. subtilis, it was clear that all these freshwater environments were similar in having almost exclusively gram-negative bacterial species. The fraction of bacterial cells having more gram-positive GSI characteristics tended to increase in the more eutrophic waters. Statistical differences of the frequency distribution of GSI values in differently eutrophicated waters were significant based on the F test: F = 1.48 (F0.01[302,315] = 1.34) between Hyoutaro-ike pond (oligotrophic) and Matsumi-ike bog (mesotrophic), F = 3.51 (F0.01[297,302] = 1.35) between Hyoutaro-ike pond and Lake Kasumigaura (eutrophic), and F = 5.17 (F0.01[297,315] = 1.35) between Matsumi-ike bog and Lake Kasumigaura, respectively.
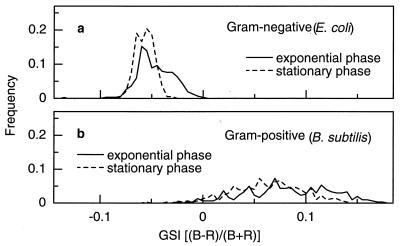
Laboratory experiments with E. coli and B. subtilis in their different growth phases show slightly variable GSI profiles; i.e., the GSI spectrum of each species shifts to more negative sides (0.14 and 0.11 in average in E. coli and B. subtilis, respectively) when the growth phase advances from the exponential phase to the stationary phase (Fig. 5). They could be good examples for application to the natural bacterial community, as follows.
FIG. 5.
GSI spectra at different growth phases of E. coli (a) and B. subtilis (b).
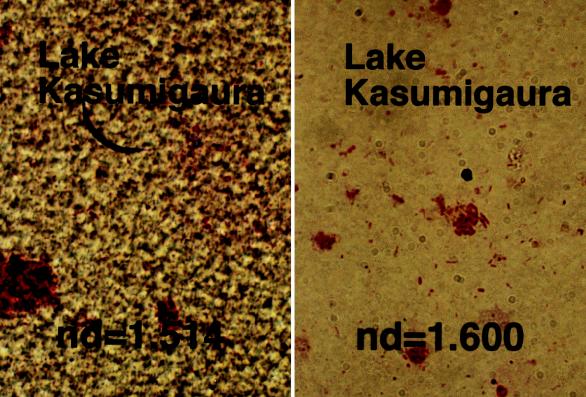
Figure 6 shows an analytical example of a GSI spectrum of the natural bacterial community from Lake Kasumigaura. The water in the lake is influenced greatly by waters from a lotus field and an irrigation creek. Three GSI spectra of the bacterial populations, from the water and the mud of the lotus field and from the water of the creek that connects the lotus field and Lake Kasumigaura, were weighted with factors of 0.20, 0.45, and 0.30, respectively. In this case, the GSI spectrum of the bacterial populations from the lotus field water and the creek were shifted −0.01 in GSI (to negative) and +0.01 in GSI (to positive) to improve the reproduction of three peaks of the GSI spectrum observed at the different physiological conditions of E. coli. The difference between the actual GSI spectrum of the lake community and the synthesized spectrum of three bacterial populations from inflowing waters to the lake is shown in Fig. 7. The peaks of the residue GSI spectrum resemble those of B. subtilis, which is a dominant bacterial population in the sediment of Lake Kasumigaura.
FIG. 6.
Gram-stained images of a natural bacterial population from Lake Kasumigaura with mounting agents with refractive indices of 1.514 and 1.600.
FIG. 7.
GSI of natural bacterial populations in water samples from Lake Kasumigaura and its adjacent environments (top four panels), with an analytical example of the components of the GSI spectrum of the lake bacterial population (bottom panel).
From these case studies of representative freshwater environments, we conclude that GSI histograms and their analysis of bacterial cells in natural populations may indicate the possible correlation between bacterial populations and their living milieu.
REFERENCES
- 1.Beveridge T J. Ultrastructure, chemistry and function of the bacterial wall. Int Rev Cytol. 1981;72:229–317. doi: 10.1016/s0074-7696(08)61198-5. [DOI] [PubMed] [Google Scholar]
- 2.Beveridge T J. Mechanism of Gram variability in select bacteria. J Bacteriol. 1990;172:1609–1620. doi: 10.1128/jb.172.3.1609-1620.1990. [DOI] [PMC free article] [PubMed] [Google Scholar]
- 3.Beveridge T J, Davies J A. Cellular responses of Bacillus subtilis and Escherichia coli to the Gram stain. J Bacteriol. 1983;156:846–858. doi: 10.1128/jb.156.2.846-858.1983. [DOI] [PMC free article] [PubMed] [Google Scholar]
- 4.Bowden W B. Comparison of two direct-count techniques for enumerating aquatic bacteria. Appl Environ Microbiol. 1977;33:1229–1232. doi: 10.1128/aem.33.5.1229-1232.1977. [DOI] [PMC free article] [PubMed] [Google Scholar]
- 5.Brock T D, Madigan M T, Martinko J M, Parker J. Biology of microorganisms. 7th ed. Englewood Cliffs, N.J: Prentice-Hall International, Inc.; 1994. [Google Scholar]
- 6.Davies J A, Anderson G K, Beveridge T J, Clark H C. Chemical mechanism of the Gram stain and synthesis of a new electron-opaque marker for electron microscopy which replaces the iodine mordant of the stain. J Bacteriol. 1983;156:837–845. doi: 10.1128/jb.156.2.837-845.1983. [DOI] [PMC free article] [PubMed] [Google Scholar]
- 7.Greenberg A E, Clesceri L S, Eaton A D. Standard methods for the examination of water and wastewater. 18th ed. Washington, D.C: American Public Health Association; 1992. [Google Scholar]
- 8.Hara Y, Tsuchida A, Seki H. Spring bloom in a hypereutrophic lake, Lake Kasumigaura, Japan. II. Succession of phytoplankton species. Water Res. 1983;17:447–451. [Google Scholar]
- 9.Harold F M. Conservation and transformation of energy by bacterial membranes. Bacteriol Rev. 1972;36:172–230. doi: 10.1128/br.36.2.172-230.1972. [DOI] [PMC free article] [PubMed] [Google Scholar]
- 10.Higashi Y, Ytow N, Seki H. Abstracts of the Spring 1997 General Meeting Oceanographic Society of Japan. (In Japanese.) 1997. In situ gradostat for the study of natural phytoplankton community with experimental nutrient gradostat. [Google Scholar]
- 11.Hobbie J E, Daley R J, Jasper S. Use of Nuclepore filters for counting bacteria by fluorescence microscopy. Appl Environ Microbiol. 1977;33:1225–1228. doi: 10.1128/aem.33.5.1225-1228.1977. [DOI] [PMC free article] [PubMed] [Google Scholar]
- 12.Murray R G E, Doetsch R N, Robinow C F. Determinative and cytological light microscopy. In: Gerhardt P, Murray R G E, Wood W A, Krieg N R, editors. Methods for general and molecular bacteriology. Washington, D.C: American Society for Microbiology; 1994. pp. 22–41. [Google Scholar]
- 13.Naganuma T, Seki H. Population growth rate of the bacterioplankton population in a bog, Matsumi-ike, Japan. Arch Hydrobiol. 1985;104:543–556. [Google Scholar]
- 14.Nakamura K, Hashizume E, Shibata T, Nakamura Y, Mala S, Yamane K. Small cytoplasmic RNA (scRNA) gene from Clostridium perfringens can replace the gene for the Bacillus subtilis scRNA in both growth and sporulation. Microbiology. 1995;141:2965–2975. doi: 10.1099/13500872-141-11-2965. [DOI] [PubMed] [Google Scholar]
- 15.Parsons T R, Maita Y, Lalli C. A manual of chemical and biological methods for seawater analysis. Oxford, United Kingdom: Pergamon Press; 1984. [Google Scholar]
- 16.Rodina A G. Methods in aquatic microbiology. Baltimore, Md: University Park Press; 1972. [Google Scholar]
- 17.Sasa M, Ishizaka S, Asamizu T, Aoki M, Nojiri Y, Higashi Y, Utsumi M, Zeng H, Ytow N, Seki H. Ecosystem structure of a boiling spring with high bacterial production on Mt. Tateyama, Japan. Arch Hydrobiol. 1996;136:563–574. [Google Scholar]
- 18.Seki H, Takahashi E. Spring bloom in a hypereutrophic lake, Lake Kasumigaura, Japan. I. Succession of phytoplankters with different accessory pigments. Water Res. 1983;17:441–445. [Google Scholar]
- 19.Seki H, Masaki A. Spring bloom in a hypereutrophic lake, Lake Kasumigaura, Japan. III. Phytoplankton abundance in standing stock of organic matter in lake water. Water Res. 1983;17:453–457. [Google Scholar]
- 20.Seki H, Otsuki A, Daigobo S, Levings C D, Mcallister C D. Microbial contribution to the mesotrophic ecosystem of the Campbell River Estuary during summer. Arch Hydrobiol. 1984;102:215–228. [Google Scholar]
- 21.Seki H, Naganuma T. Growth characteristics of Thiobacterium sp. from the plume of hydrothermal vents of the North Fiji Basin. Mar Ecol Prog Ser. 1989;54:199–202. [Google Scholar]
- 22.Shiraishi K, Uno Y, Hara Y, Seki H. Factors controlling phytoplankton population in a bog, Matsumi-ike, Japan. Arch Hydrobiol. 1985;104:387–406. [Google Scholar]
- 23.Tsuchida A, Hara Y, Seki H. Spring bloom in a hypereutrophic lake, Lake Kasumigaura, Japan. V. Factors controlling natural population of phytoplankters. Water Res. 1984;18:877–883. [Google Scholar]


