

Abstract
Microphysiological systems are an emerging area of in vitro drug development, and their independent evaluation is important for wide adoption and use. The primary goal of this study was to test reproducibility and robustness of a renal proximal tubule microphysiological system, OrganoPlate 3-lane 40, as an in vitro model for drug transport and toxicity studies. This microfluidic model was compared with static multiwell cultures and tested using several human renal proximal tubule epithelial cell (RPTEC) types. The model was characterized in terms of the functional transport for various tubule-specific proteins, epithelial permeability of small molecules (cisplatin, tenofovir, and perfluorooctanoic acid) versus large molecules (fluorescent dextrans, 60–150 kDa), and gene expression response to a nephrotoxic xenobiotic. The advantages offered by OrganoPlate 3-lane 40 as compared with multiwell cultures are the presence of media flow, albeit intermittent, and increased throughput compared with other microfluidic models. However, OrganoPlate 3-lane 40 model appeared to offer only limited (eg, MRP-mediated transport) advantages in terms of either gene expression or functional transport when compared with the multiwell plate culture conditions. Although OrganoPlate 3-lane 40 can be used to study cellular uptake and direct toxic effects of small molecules, it may have limited utility for drug transport studies. Overall, this study offers refined experimental protocols and comprehensive comparative data on the function of RPETCs in traditional multiwell culture and microfluidic OrganoPlate 3-lane 40, information that will be invaluable for the prospective end-users of in vitro models of the human proximal tubule.
Keywords: kidney, in vitro models, validation
The kidney is a critical organ for homeostasis as it regulates electrolyte and fluid balance, whole body pH and blood pressure, as well as excretion, secretion, and reabsorption of water-soluble molecules (Imenez Silva and Mohebbi, 2022; Masereeuw and Russel, 2001). It is a complex organ where 3 anatomical regions, the cortex, medulla, and papilla, are traversed by the functional units—nephrons and collecting ducts (Fritsche et al., 2021). More than 2 dozen cell types are present in the kidney; the majority are highly differentiated epithelial cells that vary in the expression of transporters (Al-Awqati and Oliver, 2002; Balzer et al., 2022). Although glomerular filtration is deemed to be largely a passive process, the proximal and distal tubular segments of nephrons are responsible for much of the active transport processes in the kidney (Zhuo and Li, 2013). Of the tubular parts of the nephron, the proximal segment plays a more prominent role because it is responsible for reabsorbing approximately 65% of the glomerular filtrate, including approximately 80% of filtered bicarbonate which is critical for maintaining whole body pH, and most filtered amino acids, glucose, solutes, and low molecular weight proteins (Zhuo and Li, 2013).
Kidneys play a key role in transport of drugs and other xenobiotics; adverse effects are common phenomena and kidney toxicity accounts for a considerable proportion of adverse drug reactions (Perazella, 2009), especially in older adults (Naughton, 2008). Because of the differences in transporter expression in various parts of the tubule, compounds may have site-specific effects along the nephron (Yin and Wang, 2016). Tubular injury elicits immunological response associated with cell infiltration and release of inflammatory cytokines that can facilitate repair or promote fibrogenesis (Bernhardt et al., 2017). Even though different cells in the kidney have some potential to recover from injury by tubular cell proliferation and hypertrophy (Lazzeri et al., 2018), the regenerative capacity of the kidney is far less than the liver (Iismaa et al., 2018).
Nephrotoxicity is an important safety consideration in both development of new drugs (Naughton, 2008) and elucidation of the mechanisms of kidney-specific toxicants (Cichocki et al., 2016). Kidney toxicity is difficult to monitor in vivo in both human and preclinical studies (Bonventre et al., 2010; Clark and Steger-Hartmann, 2018). Most in vitro models for nephrotoxicity that use immortalized cell lines are deemed to be poorly predictive because they fail to replicate multicellular nature, morphology and function (eg, drug transport) of kidney tubules and therefore fail to detect injury responses to drugs that would be nephrotoxic in vivo (Soo et al., 2018). Another challenge is the difficulty of replicating different functional sections of the nephron, with its complex architecture, capillaries, differences in oxygen tensions and shear stress (Fritsche et al., 2021). Thus, a reduction of the nephron to its most toxicologically relevant components has generally resulted in the focus on the proximal convoluted tubule. Indeed, recent advances in engineering more physiological cell culture conditions for renal proximal tubule cells include a range of kidney organ-on-a-chip technologies that include fluid flow and shear stress, as well as facilitating delivery of oxygen and nutrients (Gijzen et al., 2021; Musah et al., 2017; Novak et al., 2020; Vormann et al., 2018). These models have also been demonstrated to hold promise for drug testing (Cong et al., 2020; Czerniecki et al., 2018; Wilmer et al., 2016).
Although novel kidney-focused microphysiological systems will likely revolutionize studies of kidney disease and toxicity, they need to be qualified for specific use cases and standardized for widespread adoption in safety testing of drugs/chemicals and drug transport studies (Phillips et al., 2020). Independent evaluation of microphysiological systems is one path to establish confidence of the end-users (Rusyn et al., 2022). Here, we evaluated reproducibility and robustness of the OrganoPlate 3-lane 40 device that has been used in a number of kidney-related studies (Gijzen et al., 2021; Naik et al., 2021; Suter-Dick et al., 2018; Vormann et al., 2018, 2021, 2022). We evaluated several renal proximal tubule epithelial cell (RPTEC) sources, physiological and toxicity readouts, and compared findings with traditional static multi-well cultures.
Materials and methods
Cell culture and viability determination
Human RPTECs (Table 1) were obtained from a variety of sources to determine advantages and limitations of each cell type. These included both primary and immortalized cells, including cells that overexpressed certain transporter proteins. One source of primary human RPTECs was from the University of Washington; these cells were isolated and propagated (≤3 passages) from healthy kidney tissue as described previously (Ichimura et al., 2008) and cryopreserved prior to shipment to Texas A&M University. These cells were cultured in “PTEC media” (DMEM/F12 media [Gibco, Waltham, Massachusetts], supplemented with ITS-A [Sigma-Aldrich, St Louis, Missouri], 50 nM hydrocortisone [Sigma-Aldrich], and antibiotic-antimycotic supplement [ThermoFisher, Waltham, Massachusetts]). Other primary RPTECs were purchased from Lonza (Basel, Switzerland) and were from 2 donors (CC-2553, termed here “Lonza no. 1”: Lot. no. 18TL114340, and “Lonza no. 2”: Lot. no. 18TL117405). These RPTECs were cultured in REGM Renal Epithelial Cell Growth Medium (CC-3190, Lonza) supplemented with the “BulletKit” (CC-4127, Lonza) containing fetal bovine serum (FBS) (0.5%), human transferrin (10 mg/ml), hydrocortisone (0.5 mg/ml), insulin (5 mg/ml), triiodothyronine (5 × 10⁻¹² M), epinephrine (0.5 mg/ml), epidermal growth factor (10 mg/ml), and antibiotics (100 U/ml penicillin and 100 mg/ml streptomycin). Primary RPTECs were shipped from the vendor at passage 2 and were briefly expanded prior to testing (an additional 1–2 passages).
Table 1.
Cell sources used in this study
| Cell Name | Vendor/Supplier | Catalog No. | Donor/Cell Details |
|---|---|---|---|
| “Fresh” RPTEC | University of Washington | N/A | PT5F/unknown |
| Lonza no. 1 | LONZA | CC-2553 | 18TL114340/female, 59 years |
| Lonza no. 2 | LONZA | CC-2553 | 18TL117405/male, 57 years |
| TERT parent | ATCC | CRL-4031 | 70019364/male, unknown |
| TERT-OAT1 | ATCC | CRL-4031-OAT1 | 0305/male, unknown |
| TERT-OCT2 | ATCC | CRL-4031-OCT2 | 0307/male, unknown |
| TERT-OAT3 | ATCC | CRL-4031-OAT3 | 70016210/male, unknown |
Four additional lines of RPTECs were TERT1-immortalized cells (parent line, and OAT1-, OCT2-, OAT3-overexpressing lines); these cells were obtained from ATCC (Manassas, Virginia; Table 1). These cells were cultured in DMEM: F12 (ATCC 30-2006) supplemented with the hTERT Immortalized RPTEC Growth Kit (ATCC ACS-4007), and a final concentration of 0.1 mg/ml G418 (Geneticin G418 Sulfate, Gibco). Lastly, human umbilical vein endothelial cells (HUVECs) were purchased from Lonza (C2519A, Lot. no. 629054) and were cultured in the “EGM Bulletkit” (CC-3124, Lonza) containing proprietary concentrations of human epidermal growth factor, hydrocortisone, GA-1000, bovine brain extract, ascorbic acid, and 2% FBS. All cells were cultured in their respective cell culture media and maintained at 37°C and 5% CO2 in Tissue Culture-treated 75 cm2 flasks (CLS430641U, Corning).
For all tissue chip experiments, RPTECs and HUVECs were seeded into OrganoPlate 3-lane 40 devices (4004-400-B; Mimetas BV, Oegstgeest, The Netherlands). Briefly, 2 µl of extracellular matrix gel composed of 4 mg/ml collagen (Cultrex, R&D Systems, Minneapolis, Minnesota), 100 mM HEPES (no. 15630-122; Thermo Fisher), and 3.7 mg/ml NaHCO3 was injected into the middle lane of all 40 chips on the plate, and allowed to polymerize for 15 min at 37°C. After polymerization, 25 µl of Hanks’ balanced salt solution (HBSS; H6648, Sigma-Aldrich) was added to the gel inlet wells to maintain hydration of the gel. HUVECs were detached from flasks and seeded into the “bottom” perfusion lane inlets at a density of 30 000 cells/chip in 2 µl (15 000 cells/µl). After cell loading into the channels was visually confirmed under phase contrast microscopy, 50 µl of EGM media was added to the same inlet wells, and the plates were placed in the incubator for 1 h at a 70° angle to allow for seeding onto the gel surface. After HUVEC attachment was visually confirmed, RPTECs were loaded following the same protocol in the “top” perfusion lane with a density of 30 000 cells/chip in the respective RPTEC growth media. After RPTEC loading, the plate was incubated at a 70° angle for 4 h, then an additional 50 µl of EGM or RPTEC media was added to the respective cell channel outlets, bringing the total volume to 100 µl/channel. Plates were incubated overnight, and flow was initiated the following morning by placing the plates onto the OrganoFlow (Mimetas B.V.) interval rocking platform at ±7° at an 8-min interval.
For comparison, RPTECs were seeded into either 96- or 384- (3603, 3764; Corning Life Sciences) well tissue culture-treated plates at a density of 100 000 cells/cm2 and maintained over the same period as their tissue chip counterparts. Due to differences in RPTEC cell growth rate and invasion into the extracellular matrix, phenotyping experiments were carried out on cells of different type on different days post-seeding (Figure 1A). Parent- and TERT-OAT1 RPTECs were tested on day 3; TERT-OCT2 and TERT-OAT3 cells, as well as “Lonza no. 1” were tested on day 4; “Lonza no. 2” on day 6; and the freshly isolated primary RPTECs on day 7.
Figure 1.

Experimental timeline and tube formation. Cells were seeded on day 0, and experimental timelines varied depending on rates of cell growth and invasion (A). Phase contrast images show RPTEC (fresh RPTEC [B]; Lonza no. 1 [N-340] [E]; Lonza no. 2 [N-405] [F]; TERT-parent line [G]; TERT-OAT1 [H]; TERT-OCT2 [I]; and TERT-OAT3 [J]) and HUVEC (B only) proliferation in the channel on the experimental days indicated in (A). Cell invasion into the gel is indicated with red arrows. All RPTEC sources and HUVECs formed perfusable channels as shown in (C, D) with primary RPTECs. All images were collected at 10× magnification, scale bars = 100 µm. (K) Basal KIM-1 (n = 4) and (L) LDH in media collected from RPTEC channels reported over culture period (n = 3–4).
Throughout the experiments, cell viability was monitored by phase-contrast microscopy (formation of tubule and invasion into the extracellular matrix, Figure 1B), as well as by measuring kidney injury molecule-1 (KIM-1) and lactate dehydrogenase (LDH) in the media collected from effluent channels using enzyme-linked immunosorbent assay (ELISA; KIM-1, DSKM100; R&D Systems) or biochemical (LDH, ab102526; Abcam) assays following manufacturer’s protocols. LDH was tested in media from both the RPTEC and HUVEC channels, and KIM-1 from the RPTEC channel only.
Live and fixed cell imaging
Live cell staining was performed to visualize the RPTEC and HUVEC tubules and confirm that they were growing as a perfusable tube. All media was removed from top and bottom channel inlets/outlets (chip) or wells (static plate) and replaced with media treated with a cocktail of CalceinAM (1:1000, C3100MP; Invitrogen, Carlsbad, California), propidium iodide (1:1000, P4864-10ML; Sigma-Aldrich), and Hoechst (1:2000, H3570; Invitrogen) in cell culture media. Cells were incubated for 30 min at 37°C, then z-stack imaging was performed. Stacks were reconstructed using ImageJ (Schneider et al., 2012) and the ClearVolume plug-in (https://clearvolume.github.io/) to confirm that tubules were perfusable, and that cells had seeded on all internal surfaces of the channels.
For fixed cell immunocytochemistry, media was replaced with 4% paraformaldehyde (10% formalin, J61899; Alfa Aesar, Haverhill, Massachusetts) and the OrganoPlate 3-lane 40 devices were placed at an 45° angle to allow for fluid exchange in the microfluidic channels. Plates were incubated at room temperature for 10 min before washing with phosphate-buffered saline (PBS; Gibco). Cells were permeabilized with 0.25% Triton X-100 (BP151-100; Fisher Scientific, Waltham, Massachusetts) in PBS for 10 min, then blocked with 2% bovine serum albumin (BSA) in PBS for 1 h at room temperature. Primary antibodies against ZO-1 (33-9100; Invitrogen), and transporters OAT-1 (orb11177; Biorbyt, Cambridge, UK), OCT-2 (ab179808, Abcam), or OAT-3 (orb136646; Biorbyt) were added to the RPTEC channel, and anti-VE-Cadherin (ab33168; Abcam, Cambridge, UK), was added to the HUVEC channel. All primary antibody solutions were added at 1:200 dilution in a 2% BSA solution, and incubated for 2 h at 37°C. After incubation, cells were washed 3 times with PBS, and incubated for 2 h at 37°C in the dark with a cocktail of secondary antibodies Goat anti-Mouse IgG (Alexa Fluor 488, A-11001; Life Technologies) and Donkey Anti-Rabbit IgG (Alexa Fluor 647; ab150075; Abcam). Cells were rinsed 3× with PBS, and on the final rinse Hoechst 33342 (ab228551; Abcam) was added at 1:2000 and incubated 20 min at 37°C prior to imaging with an LSM 780 NLO Multiphoton Microscope (ZEISS, Oberkochen, Germany).
OAT-1 and OCT-2 transporter function assay
Cells were washed twice by replacing media with prewarmed HBSS. On the second wash, HBSS with vehicle (0.1% DMSO; D8418, Sigma-Aldrich) or inhibitor (OAT-1: 100 µM probenecid [P8761, Sigma-Aldrich] for 10 min; OCT-2: 100 µM cimetidine [C4522, Sigma-Aldrich] for 20 min) was incubated at 37°C. After preincubation with the inhibitor, all liquid was removed from wells and cells were incubated with 3 μM OAT-1 substrate 6-carboxyfluorescein (6-CF, 21233; Cayman Chemical Company, Ann Arbor, Michigan) or 5 μM OCT-2 substrate N,N,N-trimethyl-2[(7-nitro-1,2,3- benzoxadiazol-4-yl)amino] ethanaminium iodide (EAM-1, D-100; Macrocyclics, Plano, Texas) in HBSS for 20 min at 37°C. Uptake was halted by washing cells with cold HBSS, then plates were quickly imaged with an ImageXpress Micro Confocal High-Content Imaging System (Molecular Devices, San Jose, California) on the fluorescein isothiocyanate channel (FITC) (495/519 nm) for subsequent image analysis. Additionally, cells were lysed with M-Per mammalian protein extraction reagent (50 μl/well, 78503; Thermo Fisher) for 5 min at room temperature and immediately read on a fluorescent plate reader (iD3, Molecular Devices) at 490ex/530em to measure intracellular concentration of 6-CF or EAM-1.
Calcein-AM (P-glucoprotein) efflux inhibition
Media in all perfusion channels or static wells was replaced with 1 μM calcein-AM (C3100MP; Invitrogen) in Krebs-Henseleit (KHH) buffer (K3753-10L; Sigma-Aldrich supplemented with 10 mM HEPES, 15630-122; Thermo Fisher) in the presence of 10 μM cyclosporin A (30024-25MG; Sigma-Aldrich), or 0.1% DMSO. All chips and wells were incubated in the dark for 60 min at 37°C whereby OrganoPlate 3-lane 40 devices were placed on the plate rockers under the same conditions. After incubation, cells were briefly washed in cold KHH, and immediately imaged on the ImageXpress Micro Confocal with the FITC for subsequent image analysis. Additionally, cells were lysed with M-Per mammalian protein extraction reagent (50 μl/well) for 5 min at room temperature and immediately read on a fluorescent plate reader at 490ex/530em to measure intracellular concentration of Calcein-AM.
CMFDA (5-chloromethylfluorescein diacetate, MRP2, and MRP4 substrate) efflux inhibition
Media in all perfusion channels or static wells was replaced with 1.25 μM CMFDA (C7025, Invitrogen) in KHH buffer and treated with 30 μM 5-(3-(2-(7-chloroquinolin-2-yl)ethenyl)phenyl)-8-dimethylcarbamyl-4,6-dithiaoctanoic acid sodium salt hydrate (MK571; M7571-5MG; Sigma-Aldrich), or 0.1% DMSO. All chips and wells were incubated in the dark for 30 min at 37°C (OrganoPlate 3-lane 40 devices were placed on the plate rockers under the same conditions). After incubation, cells were briefly washed in cold KHH, and immediately imaged on the ImageXpress Micro Confocal with the FITC for subsequent image analysis. Additionally, cells were lysed with M-Per mammalian protein extraction reagent (50 μl/well) for 5 min at room temperature and immediately read on a fluorescent plate reader at 490ex/530em to measure intracellular concentration of CMFDA.
6-NBDG (6-deoxy-6-[(7-nitro-2,1,3-benzoxadiazol-4-yl)amino]-d-glucose, SGLT2 substrate) influx inhibition
Media in the RPTEC channel of OrganoPlate 3-lane 40 devices and in all wells of multiwell plates was replaced with OptiHBSS (1/3 Opti-MEM, 11058021; Gibco, and 2/3 HBSS) containing 500 μM 6-NBDG (N23106; Invitrogen) and 500 µM of SGLT2 inhibitor phloridzin (P3449-1G; Sigma-Aldrich) or vehicle (0.1% DMSO). Medium in the HUVEC channel was replaced with OptiHBSS ± inhibitor only. All chips and wells were incubated in the dark for 30 min at 37°C (OrganoPlate 3-lane 40 devices were placed on the plate rockers). After incubation, cells were washed twice with cold OptiHBSS, and immediately imaged on the ImageXpress Micro Confocal with the FITC for subsequent image analysis. Additionally, cells were lysed with M-Per mammalian protein extraction reagent (50 μl/well) for 5 min at room temperature and immediately read on a fluorescent plate reader at 490ex/530em to measure intracellular concentration of 6-NBDG.
Evaluation of the gel lane permeability in OrganoPlate 3-lane 40 devices
To evaluate the barrier of the collagen gel extracellular matrix to passive diffusion between the 2 fluidic channels, “blank chips,” which contained extracellular matrix but no cells, were treated with FITC-dextran (70 or 150 kDa; FD70S or FD150S, Sigma-Aldrich) through the top channel (0.05 mg/ml in PBS). Untreated PBS was added to the bottom channel, plates were placed back on the rocker, and effluent was collected (25 μl) from reservoirs after 110 min and 15 h. Effluent was tested using a plate reader at 490ex/530em to determine the percentage of FITC-dextran that had crossed the extracellular matrix into the recipient channel (equation 1).
| (1) |
To determine the additional barrier that RPTECs and HUVECs provide once seeded into the fluidic channels, FITC-BSA (66 kDA, 0.5 mg/ml in EGM media) was added to the bottom “donor” channels of blank “cell-free” chips, or to chips that had been seeded with TERT-RPTECs (parent, OAT1, OCT2, OAT3) in the top channel and HUVECs in the bottom channel as described earlier. RPTEC media was added to the top “recipient” channel, then plates were placed back on the rocker and incubated at 37°C for 1 h. Effluent was tested using a plate reader at 490ex/530em to determine the percentage of FITC-dextran that had crossed from the HUVEC (donor) to RPTEC (recipient) channel in blank or cell-seeded chips (equation 1).
Chemical treatments
To evaluate transepithelial transport and biological effects of cisplatin (10 μM, 1134357; CASRN 15663-27-1; Sigma-Aldrich), tenofovir (100 μM, SML1795; CASRN 147127-20-6; Sigma-Aldrich), and perfluorooctanoic acid (PFOA, 1 μM; A5717, CASRN 335-67-1; TCI America), media in donor channels were replaced with chemical exposure media (in EGM when treated through the HUVEC channel, or cell-specific RPTEC media when treated through the RPTEC channel) in an ending DMSO vehicle of 0.1%. Untreated media was added to the opposite, recipient channel. Compounds were either added through the HUVEC channel or RPTEC channel to determine whether there would be any directionality in transport through the tubules (ie, uptake vs secretion in the RPTEC channel). Media (with or without test compounds) from both donor and recipient channels was collected and replaced on days 1, 2, 3, 5, and 7 postinitiation of treatment on day 0 (day 4 or 6 of cell culture post seeding for “Lonza no. 1” and “Lonza no. 2”, respectively).
Analytical chemistry methods
C13-Caffeine standard was purchased from Supelco (C-082-1ML; Bellefonte, Pennsylvania), and used as an internal standard for tenofovir. C13-PFOA was purchased from Wellington Lab (MPFOA, Guelph, Ontario, Canada), and used as an internal standard for PFOA. Bismuth was purchased from Sigma-Aldrich (GF61155682) and used as an internal standard for cisplatin.
For chemical analysis of tenofovir and PFOA, samples were extracted using liquid/liquid extraction with protein precipitation. Briefly, 50 μl of media sample was added to 100 μl of chilled acetonitrile (A998-4, Fisher Scientific) containing internal standard (0.1 µM), then vortexed before centrifuging and transferring supernatant to new 1.5 ml microcentrifuge tube. The supernatant was then evaporated to dryness using a Savant SpeedVac (SPD1010, Thermo Fisher) and reconstituted with 50 μl of mobile phase A (see below). Samples were then transferred to autosampler vials containing 200 μl fused inserts (A998-4, Ibis Scientific, Las Vegas, Nevada) and stored at −20° C until analysis.
Analyses were performed on a triple quadrupole mass spectrometer (Agilent 6470, Santa Clara, California). For tenofovir, the instrument was operating in positive ion mode using an electrospray ionization source. For PFOA, analyses were performed using negative ion mode using an electrospray ionization source. Capillary voltage, sheath gas temperature, and sheath gas pressure were set to 4500 V, 300°C and 50 psi, respectively. Samples (8 μl for tenofovir and 20 μl for PFOA) were auto-injected onto a ZORBAX SSHD Eclipse Plus C18 column (3.0 × 50 mm, 1.8 μm, 959757-302, Agilent) with a guard column (2.1 × 5 mm, 1.8 μm, 821725-901, Agilent) using a 1290 Infinity II LC (Agilent). The column temperature was set to 40°C and flow rate to 0.4 ml/min. For tenofovir, initial conditions for sample injection were 90% mobile phase A (water with 0.1% [v/v] formic acid) and 10% mobile phase B (acetonitrile with 0.1% [v/v] formic acid) for 3 min before increasing to 80% mobile phase B until minute 4. Conditions then returned to 90% mobile phase A and 10% mobile phase B for the remainder of the run. For analysis of PFOA, initial chromatographic conditions were 90% mobile phase A (HPLC-grade water containing 5 mM ammonium acetate) and 10% mobile phase B (95% MeOH with 5 mM ammonium acetate). At 2 min, mobile phase B increases to 30% until minute 14 when this increases to 95%. At 14.5 min, this was changed to 100% mobile phase B before returning to 10% at 15.5 min. This condition remained for the rest of the method which ended at 17 min.
Cisplatin (Pt) analyses were performed on 100 μl effluent samples of media from the RPTEC and HUVEC channels of OrganoPlate 3-lane 40 devices. The samples were digested by adding 2.4 ml of 1% nitric acid (Omnitrace Ultra Nitric acid) spiked with 10 ng/ml bismuth internal standard. The samples were shaken with loose covering to allow any gases to escape. Then the samples were allowed to stand overnight to ensure complete digestion. Cisplatin calibration standards were freshly prepared daily from certified standards in cell culture media to adjust for any matrix effects. Calibration concentrations ranged from 0 to 100 μM, and blanks containing media only (100 μl) and acid (2.4 ml) were analyzed with each sample batch. To avoid carryover, 2% nitric acid was used as a wash between sample analyses. Continuing calibration standard checks were performed after every 15 samples followed by a blank analysis. Samples and calibration standards were analyzed on an inductively coupled plasma-mass spectrophotometer NexIon 300 (Perkin Elmer, Waltham, Massachusetts). Concentrations were determined as Pt195, the most abundant isotope, to provide the best sensitivity and were based on a linear calibration curve (r2 > 0.99). Sample concentrations were then determined based on the calibration curve considering the sample dilution factor (1:25). The method’s detection limit in these experiments was 0.013 μM.
Recovery from OrganoPlate 3-lane 40 devices is reported as “% Recovered” (equation 2) which combined the media collected from the donor and recipient channels and compared with the original working solution of each compound. However, this did not include compound that remained in the gel, due to difficulty in removing the polymerized matrix from the plates.
| (2) |
Transport or diffusion of compound between donor and recipient channels was reported as “% Equilibrated,” normalized to 24 h collection periods. Equilibration was calculated using equation 3.
| (3) |
Due to difficulty in removing the polymerized gel matrix from OrganoPlate 3-lane 40 devices, the % Equilibration does not consider any compound that may have been retained in the gel (middle lane of the device).
Gene expression library preparation and sequencing
Cell lysates were prepared from OrganoPlate 3-lane 40 devices through injection of 30 μl lysis buffer into the RPTEC channel. Following 10 min of incubation at room temperature, the cell lysate was flushed out by addition of 15 μl of Enhanced 2× Lysis Buffer (201250, BioSpyder Technologies, Carlsbad, California). For 384-well plates, media was aspirated and 10 μl of lysis buffer was added directly onto cells. After 10 min at room temperature the lysates were collected from each and stored at −80°C until further processing. The Templated Oligonucleotide Sequencing Assay (TempO-Seq, BioSpyder Technologies) was used as the RNA sequencing technology. Detailed protocols for TempO-seq are provided by the manufacturer and were previously reported detailed elsewhere (Grimm et al., 2016; House et al., 2022). TempO-seq libraries were prepared using the S1500+ targeted transcriptome panel (Mav et al., 2018) consisting of 2982 transcripts according to the manufacturer’s instructions. Briefly, hybridization of the mRNA content of cell lysates was achieved by incubation of 2 μl of the lysate with 2 μl hybridization mix as follows: 10 min at 70°C, cooling ramp from 70°C to 45°C for 49 min, and 1 min at 45°C. Excess oligonucleotides were then digested in a nuclease catalyzed reaction for 90 min at 37°C. Next, hybridization products were incubated with DNA ligase for 60 min at 37°C. Nuclease and ligase were then denatured using a heat denaturation step (80°C for 30 min). A total of 10 μl of each ligation product were then mixed with an equal volume of PCR amplification mix and amplified in a LightCycler 96 (Roche, Basel, Switzerland) using the manufacturer recommended settings. Amplicon samples (5 μl) were then pooled and purified using a commercial PCR clean-up kit (Clontech, Mountain View, California). Pooled libraries were sequenced in 75 single-end read mode dual index run with custom primers using NextSeq 550 sequencing (Illumina, San Diego, California).
Transcriptomics data analysis
The gene count matrices were generated from single-end reads with 4 lanes per sample with approximately 75 base pairs (bp). After the sequencing was complete, the raw data are converted to fastq files using the BCL Convert software (Illumina). The reads from the four lanes for each sample were combined to generate a single fastq file. The TERT1-immortalized RPTEC fastq files were preprocessed using fastp (version 0.20.0) (Chen et al., 2018). With the exception of adapter trimming, the fastp default parameters were used along with trimming the reads to 50 bp. The files were used as input to the TempO-seq analysis pipeline (House et al., 2017) with the human S1500+ probe manifest file to generate a gene count matrix. TempO-seq PCR primers contained unique, oligonucleotide sequence-encoded sample barcodes, allowing unambiguous computational sample identification after pooled sequencing. Data were filtered based on the following quality control criteria. For transcripts with more than one probe in the TempO-seq assay, their counts were summed to the gene level. Transcripts with fewer than 25 mean counts across the entire sample space (n = 44 for OrganoPlate 3-lane 40, and n = 22 for 384-well plates) were removed as nonexpressed except for the genes listed in Supplementary Table 1 that were retained for further analyses. For further analyses, a total of 1497 transcripts were evaluated. Principal component analysis (PCA) was conducted using R package prcomp on all samples using raw counts to identify any outliers. Because no outliers were identified (Supplementary Figure 1), no sample was excluded from further analyses.
The Bioconductor’s DESeq2 package (Love et al., 2014) was utilized to perform differential expression analysis and generate the complete normalized count matrix for all experimental conditions. The result function of DESeq2 specifying the contrast group was used to derive the lists of significant differentially expressed genes (DEGs) for each comparison (either untreated cells of different type or cell culture modality, or chemical treatment versus vehicle-treated). To identify DEGs, false discovery q-values <0.01 and absolute log 2-fold-change values >2.5 were considered as cut-offs. The normalized counts from DESeq2 were used for clustering and visualization using R package ggplot2 to draw the correlation dot plots and pheatmap to draw the heat maps. To assess the differential-expression test on chemical treatment effects, the treated samples were compared with the corresponding untreated control samples in each cell line, and log 2 fold changes were corrected using DESeq2’s lfcShrink function (type = “apeglm”).
For pathway analyses, we used R xgr package (Fang et al., 2016) version 1.1.8 using all pathways and GO biological process as gene sets (ontology = “MsigdbC5BP” and ontology = “MsigdbC2CPall”). The gene set background included all interrogated genes retained after low-count removal (1497 transcripts, see above for selection).
To compare transcriptional profiles obtained in this study to those reported by the GTEx Consortium across many human tissues (GTEx Consortium, 2015; 2017a), rank-based correlation analysis was performed by comparing the mean expression levels for individual genes from each experimental condition in this study with the mean expression levels of each tissue/cell type obtained from the GTEx Portal (GTEx Consortium, 2017b).
Statistical analysis
Data analysis was performed using GraphPad Prism (version 9.2.0, San Diego, California). All error bars shown represent the standard deviation and sample numbers are indicated in the figure legends. Data were analyzed using t-tests or 2-way ANOVA with post hoc testing as indicated in the figure legends. Power analyses for sample size needed to reach statistical significance with 80% statistical power were estimated using (1) the 2-sided paired t-tests, and (2) 2-sided 2 sample t-tests with different variances, for paired and independent samples, respectively. MATLAB, SAS, and PASS software packages were used to estimate the effect size and calculate the required sample size (Machin et al., 2011; Zar, 1984).
Results
The primary goal of this study was to test reproducibility and robustness of OrganoPlate 3-lane 40 devices as an in vitro model for drug transport and toxicity studies in kidney. Because previous studies of reproducibility of kidney (Maass et al., 2019; Sakolish et al., 2018) and other organ-specific microphysiological systems (Kato et al., 2022; Liu et al., 2020; Sakolish et al., 2021a,b) showed that cell origin introduces the greatest challenge to replicating previously published studies, we aimed to test a diverse range of RPTEC cell types. Figure 1A shows a general timeline for the experimental design. We followed published protocols (Gijzen et al., 2021) for the initial (day 0) assembly of OrganoPlate 3-lane 40 devices with plate rocking to circulate the media initiated on day 1. Because different RPTEC types had widely varying cell proliferation rates, the devices were ready for use on days 3–7, depending on the cell type. General criteria for deeming each plate assay-ready was the establishment of a tubule barrier against the gel lane without significant invasion of cells into the gel due to overgrowth as determined by phase-contrast microscopy.
Figure 1B shows a representative example of the phase-contrast view on day 7 into one of the chips on the OrganoPlate 3-lane 40 that was seeded with primary (“fresh”) RPTEC (top channel) and HUVEC (bottom channel). RPTEC exhibited a mixture of elongated and cuboidal morphology with the entire channel filled with cells that did not invade into the gel (middle channel) and formed complete tubules (Figure 1C). HUVEC exhibited expected cuboidal morphology with the channel filled with a continuous monolayer and formed a complete tubule (Figure 1D). The overall success rate in loading cells into both channels and them forming complete tubules was >95%. Representative examples of other RPTEC sources seeded into OrganoPlate 3-lane 40 are shown in Figures 1E and 1F. Although all RPTEC sources formed tubules, their morphology and behavior in the device varied greatly. Commercially obtained primary RPTECs from 2 human donors (Lonza no. 1 [N-340] and Lonza no. 2 [N-405]) had faster proliferation rates and formed a confluent tubule by days 4 and 6, respectively (Figs. 1E and 1F). Even though they exhibited elongated shapes in the direction of media movement, these cells began invading the gel matrix (middle lane, red arrows). TERT-immortalized RPTEC lines (Figs. 1G–J), both parental and transporter-overexpressing (OAT1, OCT2, and OAT3) lines, did not show elongated morphology regions in the channel or invade the gel; however, they proliferated the fastest necessitating the use of the devices on days 3 (parent and OAT1-overexpressing lines) or 4 (OCT2- and OAT3-overexpressing lines).
Many kidney-specific biomarkers have been proposed for studies in vivo and in vitro (Bonventre et al., 2010; Vaidya et al., 2008). However, over the course of the experiment in OrganoPlate 3-lane 40, only phase-contrast imaging and cell culture media (replaced every other day in small volumes of 100 µl) can be used to assess each device’s condition. In media, we evaluated 2 biomarkers—LDH and KIM-1 (Figs. 1K and 1L). Notably, we observed almost 2 orders of magnitude difference in KIM-1 amounts in cell culture media between primary (Lonza no. 1 and no. 2) RPTECs and TERT-immortalized cells under basal culture conditions (Figure 1K), an important consideration for the use of this biomarker in studies in vitro. At the same time, LDH levels were low throughout the experiment in primary RPTECs from Lonza (Figure 1L), and freshly isolated RPTECs (data not shown). TERT-OCT2 cells exhibited a gradual increase in both KIM-1 and LDH past 4 days in culture, whereas TERT-OAT1 cells showed a robust time-dependent increase only in LDH levels.
Next, we examined RPTEC and HUVEC cell morphology and expression of transporters in TERT-immortalized RPTEC lines. Figure 2A shows a representative image of immunofluorescent staining for cell junction markers, ZO-1 for RPTEC (TERT-immortalized parent cell line is shown) and VE-cadherin for HUVEC. HUVEC formed cuboidal-shape monolayers with well-developed tight junctions in all experiments. TERT-immortalized RPTECs generally did not adopt elongated shapes in the direction of flow, even though they had well-developed cell junctions (Figure 2B). Expression of OAT1, OCT2, and OAT3 was detectable in the nuclei in the TERT-overexpressing parent cell line, yet these proteins were expressed more diffusely throughout the cells (presumably on the nuclear membrane) when each transporter overexpressed (Figure 2C).
Figure 2.

Immunocytochemistry on TERT-RPTEC lines in OrganoPlate 3-lane 40 devices. RPTECs and HUVECs form tight junctions (VE-cadherin in HUVEC, and ZO-1 in both channels) between cell-cell contacts as indicated in (A) and (B). Additionally, the TERT-RPTEC transporter-specific lines express OAT-1, -3, or OCT-2 in increased levels compared with the parental line (C). Images were collected at 10× (A) or 40× (B, C). Thick scale bar = 100 µm, and thin scale bar = 50 µm. (D) FITC-Dextran (70 or 150 kDa, n = 4) permeability in blank (cell-free) chips (n = 4), and (E) FITC-BSA permeability in blank as well as chips seeded with TERT1-RPTECs and HUVECs (n = 4–6). FITC-BSA was added to the RPTEC channel (donor) and measured in the HUVEC channel (recipient). Equilibration across the gel layer from donor to recipient channels is reported. Asterisks (*) denote statistical differences (p < .05) between time points (in D, t-test) or “no cells” conditions and devices with cells (in E, 1-way ANOVA). See Supplementary Table 6 for the power analysis of the data in panel (E).
In addition, we evaluated barrier integrity of the RPTEC channel. This endpoint is frequently reported in studies with OrganoPlate 3-lane 40 by using fluorescent substrates of various molecular weight (Naik et al., 2021; Vormann et al., 2018, 2021). Typical experiments involve very short-term (up to 15 min) studies that use imaging-based readouts and report apparent permeability from RPTEC channel into the gel channel. In this study, we used 3 different fluorescent molecules (66, 70, and 150 kDa) and evaluated the amount of the probe that crossed the gel barrier and was detectable in the opposite lane (Figs. 2D and 2E). We also evaluated extended periods, 60 or 110 min and 15 h, to determine the integrity of the barrier in studies where drug transport, not cytotoxicity, may be the outcome of interest. In cell-free devices, where only the middle lane was filled with gel, less than 1% of the fluorescent molecules (regardless of their size) crossed the gel barrier in 60 or 110 min; more dye diffused over 15 h but the total amount was still only about 2%. When RPTEC and HUVEC cells were present in the experiment (Figure 2E), they provided additional barrier to fluorescent dye transfer between cell channels (across the gel); however, the difference between no-cell control and devices with cells of either type was only approximately 30%.
Previous transcriptomic studies in OrganoPlate 3-lane 40 probed expression of either selected mRNAs in cells (Naik et al., 2021; Vormann et al., 2021), or micro-RNAs in cell culture media (Suter-Dick et al., 2018) after treatment with nephrotoxic compounds or genetic manipulation. In this study, we focused on comparing gene expression profiles in untreated RPTEC of different origin and cultured in either OrganoPlate 3-lane 40 or in 384-well plates (Figs. 3 and 4). We used a targeted human gene set (S1500+, approximately 3000 transcripts) (Mav et al., 2018) and TempO-Seq method for high-throughput in vitro transcriptomic studies (Bushel et al., 2018; Harrill et al., 2021; House et al., 2022; Limonciel et al., 2018). First, we compared gene expression profiles of the RPTEC sources used in this study to human tissue-specific gene expression profiles (GTEx Consortium, 2013, 2017a). Figure 3A shows that in OrganoPlate 3-lane 40, gene expression profiles of primary RPTECs (Lonza no. 1 [N-340] and Lonza no. 2 [N-405]) were most correlated with those of human kidney cortex and medulla; conversely, TERT-immortalized RPTEC lines were most correlated with cultured cell lines (e.g., fibroblasts). Very similar patterns were observed in 384-well plate-cultured cells; in fact, correlations between platforms for each cell type probed in both conditions were highly significant with Pearson R2 values ranging from 0.84 to 0.94 (Supplementary Figure 2).
Figure 3.

Transcriptomic data-based similarity analysis. A, Rank-based (Spearman) correlation between transcriptional profiles of different RPTECs cultured in OrganoPlate 3-lane 40 (triangles) or 384-well plates (circles) and different human tissues or cells (from GTEx Consortium, see Materials and methods). Colors (see inset) identify different RPTECs. B, Principal component analysis (PCA) on normalized gene expression data (see Materials and methods for description) from untreated cells cultured in different conditions as detailed in (A). All binary comparisons of the top 3 PCs are shown in the scatter plots with fraction of variance explained by each PC indicated in the axis label. Colors and symbols (see inset) identify different RPTECs and culture conditions.
Figure 4.

Gene expression profiles of RPTECs cultured in different conditions. Heatmaps visualize relative expression for each transcript/sample using log 10(count + 1) as input data matrix. Data shown are from OrganoPlate 3-lane 40 (A and C) and 384-well plate (B and D) experiments are shown. In panels (A) and (B), samples (columns) and transcripts (rows) were clustered (Euclidean distance and complete linkage). In panels (C) and (D), samples (columns) were arranged by RPTEC type, and genes (rows) are listed alphabetically. Cells are identified with different colors as shown in the inset. Expression values for the genes shown are included in Supplementary Tables 3 (A) and 4 (B).
In PCA (Figure 3B) where all gene expression profiles were analyzed simultaneously (across all cell types and culture conditions), the greatest separation was evident between primary RPTEC and TERT-immortalized cells (PC1). The second most impactful separation was afforded by the distinction between OrganoPlate 3-lane 40 and 384-well plate-cultured TERT-immortalized cells (PC2). In PC3, the separation was most pronounced between TERT-OAT1 cells and other TERT-immortalized cells, regardless of the culture condition. When PC2 and PC3 were compared, clear separation for TERT-immortalized cells was evident between OrganoPlate 3-lane 40 and 384-well plate cultures, and with OAT1-overexpressing cells.
When gene-specific expression patterns were compared within each culture condition (Figs. 4A and 4B and Supplementary Table 3), independent samples clustered within their group—first by the biological replicates of the same condition, then by cell type, including separation of the TERT-immortalized cells from primary cells. Interestingly, expression of HAVCR1/KIM1 in cells (Supplementary Figure 3) was highly concordant with protein levels detected in cell culture media (Figure 1K). Specifically, HAVCR1/KIM1 expression levels were over an order of magnitude greater in primary RPTEC (Lonza no. 1 and no. 2) than in TERT-immortalized lines. Among the latter, expression was highest in TERT-OCT2 line and lowest in TERT-OAT1 line, and no difference was observed between culture conditions (OrganoPlate 3-lane 40 or 384-well plate). When xenobiotic metabolism and transporter genes were selected (Figs. 4C and 4D and Supplementary Table 4) and samples were arranged by cell source, an overall concordance in expression was observed both among cell sources and between culture conditions. The notable exceptions were cell source-specific overexpression of OAT1 (SLC22A6), OCT2 (SLC22A2), and OAT3 (SLC22A8) in corresponding TERT-immortalized cells. Except for transfected lines, expression of these genes was generally low in primary cells and virtually absent in TERT-immortalized parent line.
On the pathway level (Table 2), all RPTECs showed robust expression of glucuronosyl transferases, transporters regulating water movement, and epithelial cell proliferation markers. However, notable differences were observed among cell types. Primary RPTECs (Lonza no. 1 and no. 2) demonstrated higher, as compared with all TERT-immortalized cells, expression of pathways important for RPTEC physiological function—organonitrogen compound catabolism and regulation of ion transport, as well as epithelium development genes. TERT-OAT1 and -OAT3 cells exhibited increased, as compared with TERT parent cells, expression of drug metabolism, ion transport, and cell morphogenesis-related transcripts.
Table 2.
Significantly affected pathways derived from transcriptomic profiles shown in Figure 4
| Pathways (Total No. of Genes in a Pathway) | Significantly Affected Genes in a Pathway | p adj |
|---|---|---|
| High expression in all cell types | ||
| KEGG: Drug metabolism cytochrome P450 (14) | MAOA, UGT1A10, UGT1A6, UGT1A8, UGT2B7 | <.001 |
| GO: Regulation of body fluid levels (77) | C3, F3, ITPR1, MAPK3, NME1, PRKAR1A, SAA1, SERPINE1, SLC22A2, VEGFA | <.001 |
| Reactome: Signaling by GPCR (50) | C3, CXCL1, CXCL8, MAPK3, PRKAR1A, SAA1 | <.01 |
| GO: Positive regulation of epithelial cell proliferation (30) | F3, GLUL, ID1, NME1, VEGFA | <.01 |
| Higher expression in primary RPTEC (Lonza no. 1 and no. 2) as Compared with all TERT Lines | ||
| GO: Organonitrogen compound catabolic process (45) | BCAT1, CDA, CYP3A5, LUM, MAOB | <.05 |
| GO: Regulation of ion transport (62) | CA2, F2, KCNQ3, MAOB, STC1 | <.05 |
| GO: Epithelium development (115) | CA2, GSTM3, SATB1, SNAI2, STC1, ZEB2 | <.05 |
| TERT-OAT1 versus TERT parent line | ||
| KEGG: Drug metabolism of other enzymes (14) | CDA, CYP3A5, UGT1A10, UGT1A6, UGT1A8 | <.001 |
| GO: Ion transport (122) | CA2, CA9, FKBP1A, KCNK1, LCN2, LTF, SLC10A2, SLC22A6, SLC2A3, SLCO2B1 | <.05 |
| GO: Regulation of carbohydrate metabolic process (31) | IGFBP3, IGFBP4, UGT1A10, UGT1A6, UGT1A8 | <.05 |
| TERT-OAT3 versus TERT parent line | ||
| GO: Extracellular structure organization (48) | COL12A1, DCN, LUM, MFAP5, MMP1, SERPINE1 | <.01 |
| GO: Epithelium development1 (115) | CDH2, GATA6, MET, SATB1, SNAI2, ZEB2 | <.05 |
| GO: Regulation of response to stress (258) | C3, DCN, F3, IL1R1, LTF, MAPK3, MET, SERPINE1, SNAI2, ZEB2 | <.05 |
KEGG, Kyoto Encyclopedia of Genes and Genomes; GO, gene ontology.
To investigate transporter activity in the TERT1-OAT1 and -OCT2 overexpressing cells, 6-CF and EAM-1 were used as marker substrates for OAT1 (Hagos and Wolff, 2010) and OCT2 (Franke et al., 2010), respectively (Figure 5). These 2 transporters are expressed on the basal surface of proximal tubular cells and are responsible for basolateral uptake of organic anions and cations (Ullrich, 1999). Cells were exposed to 6-CF in the presence or absence of OAT inhibitor probenecid (Wu et al., 2017). Similarly, EAM-1 was tested in the presence or absence of OCT2 inhibitor cimetidine (Zhang et al., 1998). Significant increases in 6-CF accumulation (OAT1-mediated) were observed in the TERT-OAT1 cells compared with the parental line cultured in both OrganoPlate 3-lane 40 (6.4-fold) and 96-well plates (18-fold). Probenecid (100 µM) decreased intracellular accumulation of 6-CF by 50% in TERT1-OAT1 cells in OrganoPlate 3-lane 40 but did not affect transport in the TERT parental line, or in cells grown in 96-well plates (Figs. 5A and 5C). In experiments with EAM-1, we observed an increase in the uptake in TERT-OCT2 overexpressing cells compared with the parental line (1.84-fold in OrganoPlate 3-lane 40 and 4.9-fold in 96-well plates); however, addition of competitive inhibitor cimetidine (100 µM) had no effect in either condition (Figs. 5B and 5D). It is worth noting that the smaller transporter overexpression-mediated effect for both substrates observed in OrganoPlate 3-lane 40 was likely due to higher background fluorescence, because both substrates were accumulating in the gel lane potentially interfering with accurate quantitation. Although we attempted to limit the background by quantifying only the cell seeded region of the images, excluding the gel barrier in the center of the chip, and using the same fluorescent solution in the experiments with the TERT1 line and the transporter-overexpressing lines, it was difficult to ensure accurate image analysis in OrganoPlate 3-lane 40.
Figure 5.
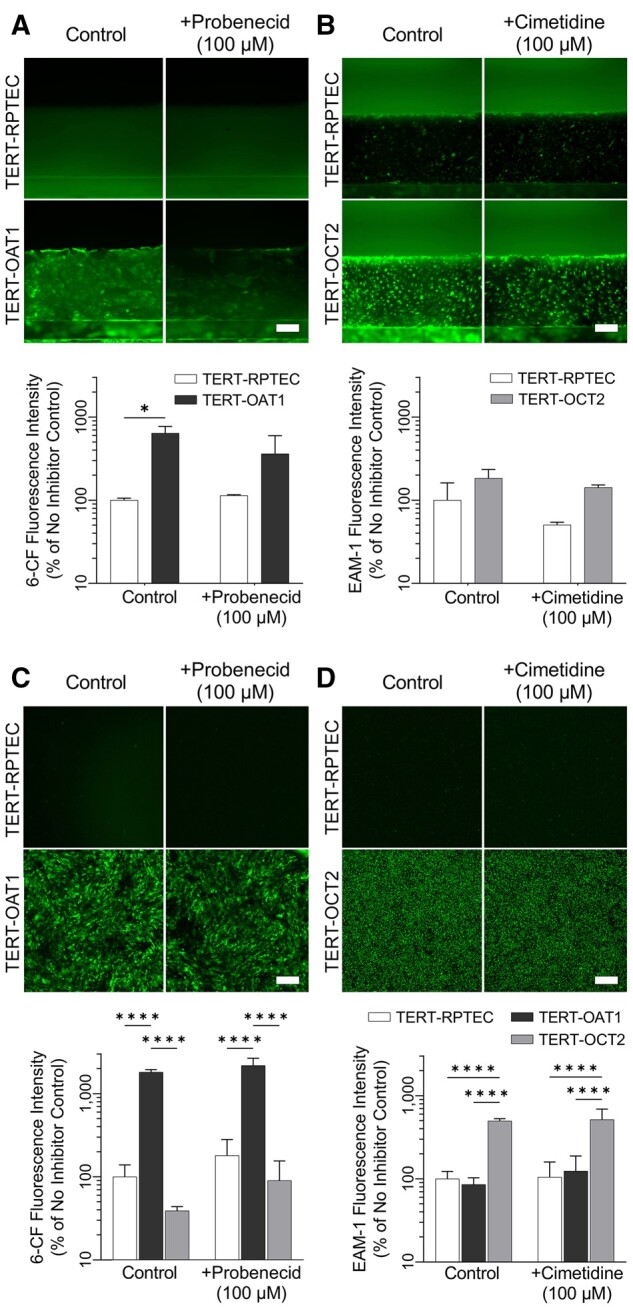
Evaluation of OAT-1 and OCT-2 transporter activity in 2D and 3D TERT-RPTEC cultures. TERT-parent, -OAT1, and OCT-2 RPTECs were cultured in a 96-well plate (C, D), or in the 3-lane chip (A, B) then exposed to 6-CF (OAT-1 substrate) or EAM-1 (OCT-2 substrate) in the absence or presence of inhibitors (probenecid and cimetidine, respectively). 6-CF accumulation in -OAT1 cells was significantly higher in both 2D and 3D than other cell lines, however, probenecid did not significantly inhibit this uptake. Similar trends were observed in EAM-1 uptake, with OCT-2 overexpressing cells showing the highest level of uptake, however cimetidine did not significantly decrease EAM-1 uptake (n = 2–3 in A and B; n = 8 in C; n = 4 in D). Asterisks (* and ****) denote statistical differences (p < .05 and p < .0001, respectively) between cell types within each group using 2-way ANOVA followed by Šídák’s multiple comparisons test. See Supplementary Table 6 for the power analysis.
To overcome challenges with high background fluorescence and subsequent variability in image-bases analysis, we performed additional experiments with P-gp, MRP, and SGLT2 substrates using cell lysates. Previous studies have demonstrated significant improvements in both expression and function of solute carrier (SLC) and ATP-binding cassette (ABC) transporters when RPTEC were cultured under fluidic conditions ranging from 0.2 (Jang et al., 2013) to 0.5 dyne/cm2 (Ross et al., 2021). The media flow in the OrganoPlate 3-lane 40 is induced by rocking the plates on the platform; it was estimated (Vormann et al., 2018) that the average shear stress in this model is approximately 0.13 dyne/cm2. However, shear is highly intermittent, reaching as high as approximately 1.7 dyne/cm2 for a few seconds, then quickly decaying over the next 1–2 min to nearly static condition for the remainder of the 8-min interval; this cycle continues by inverting the plate in the opposite direction. To determine whether the intermittent shear stress in the OrganoPlate 3-lane 40 influences transporter function, RPTEC (primary RPTEC and various TERT1-RPTEC lines: parent, OAT1, OCT2, and OAT3) were treated with CalceinAM (P-gp substrate), CMFDA (MRP), or 6-NBDG (SGLT2) in the absence or presence of transporter-specific inhibitors (10 µM cyclosporine A, 30 µM MK571, or 500 µM phlorizin, respectively). Substrates for efflux transporters, CalceinAM and CMFDA, enter cells passively and are converted to the fluorescent dyes (Forster et al., 2008). If active efflux transporters are present, a decrease in intracellular fluorescence that is inhibitable would indicate functional transporters.
Inhibitable P-gp efflux was observed in TERT1-OAT1 RPTECs in both the OrganoPlate 3-lane 40 and the 384-well plates at similar levels (2.6- and 2.1-fold, respectively, Figure 6A). P-gp inhibition was also observed in TERT1-OCT2 cells; however, only when cells were grown in the OrganoPlate 3-lane 40 (1.4-fold increase in intracellular Calcein). Inhibitable MRP efflux activity was observed in all RPTEC tested in OrganoPlate 3-lane 40 (Lonza: 1.7-, TERT-parent: 2.9-, -OAT1: 1.7-, -OCT2: 2.8-, and -OAT3: 2.2-fold, Figure 6B). In 384-well plates, MRP efflux activity was observed only in TERT-parent (1.6-fold), -OCT2 (1.3-fold), and -OAT3 (3.1-fold). SGLT-2 influx transporter function was tested with 6-NBDG, a fluorescent glucose analog (Jung et al., 2011). It has been shown previously (Vormann et al., 2018) that SA7K clone RPTEC grown in the OrganoPlate 3-lane 40 were sensitive to SGLT-2 inhibition after treatment with phlorizin, resulting in a 40% reduction in intracellular fluorescence; however, in all cell types used in these studies, no effect on the uptake of 6-NBDG was observed after treatment with inhibitor in either growth condition (OrganoPlate 3-lane 40 or 384-well plates, Figure 6C).
Figure 6.
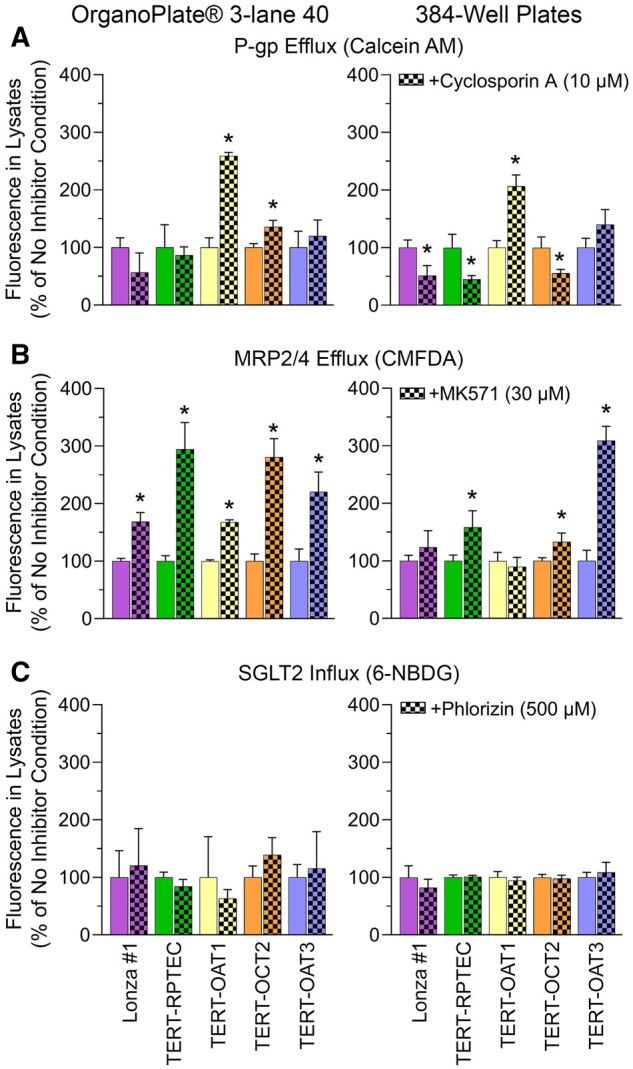
Evaluation of P-gp, MRP, and SGLT2 transporter activity in 2D (384-well plate) and 3D (OrganoPlate 3-lane 40 plate). Fluorescence in cell lysates is normalized to vehicle controls for each cell line. A, P-gp efflux is measured though treatment with CalceinAM, and can be inhibited by treatment with Cyclosporin A, resulting in higher fluorescent CalceinAM present in lysates. B, MRP efflux is measured through treatment with CMFDA and inhibited by MK571 resulting in higher fluorescent CMFDA in lysates. C, SGLT2 influx is measured through treatment with 6-NBDG and can be inhibited through treatment with phloridzin. Influx inhibition results in a decrease in intracellular fluorescence, however, significant changes were not observed in either growth condition (2D or 3D) with any of the cell lines indicating that this transporter was likely not active in these cells (n = 3 for all conditions in OrganoPlate 3-lane 40 devices, and n = 3–10 in 384-well plates). Asterisks (*) denote statistical differences (p < .05, unpaired t-test, 2-tailed) between ± inhibitor conditions within each cell type and platform within each group. See Supplementary Table 6 for the power analysis.
The last set of experiments aimed to test renal transport and nephrotoxicity of several model compounds with different modes of action and renal clearance properties. Of the compendium of cell models tested herein, for these experiments we used Lonza no. 1 and no. 2 cells that were most functional and human kidney-like in their gene expression (see result above). We selected cisplatin (10 µM), tenofovir (100 µM), and PFOA (1 µM) for these experiments and they were delivered through either the tubular (RPTEC) or the vascular (HUVEC) channel of OrganoPlate 3-lane 40. These compounds were selected because they have different fates in the proximal tubule. Renal clearance for cisplatin and tenofovir exceed glomerular filtration rate, as they are actively secreted in the proximal tubule by OATs (tenofovir; Bam et al., 2014), OCTs (cisplatin; Franke et al., 2010); and MRPs (Harrach and Ciarimboli, 2015). PFOA, however, is actively reuptaken in the proximal tubule, accumulating in the cells as well as being secreted into blood resulting in a very long half-life in humans (U.S. EPA, 2016).
Before transport kinetics were studied, we determined whether test compounds were binding to the devices, trapped in the gel lane (“cell-free” condition) or accumulating in the cells (in each channel). Compound dosing was performed every 24–48 h for 7 days. Recovery (compared with stock solutions) from the devices on days 1, 2, 3, 5, and 7 was measured in the media from donor and recipient channels only; it was not possible to remove the gel from the devices to estimate the fraction that may be trapped. Generally, recovery from both channels combined (Figure 7A) was not significantly different regardless of the presence (filled circles) of absence (open circles) of cells, or the location of compound addition (HUVEC- vs RPTEC-seeded channel). Only tenofovir, the lowest n-octanol/water partition coefficient (Log Kow) compound of those tested, showed some retention in the device without cells; on average approximately 25% of the starting amount was not recovered, most likely being trapped in the gel barrier. When cells were present, and provided a barrier to the diffusion into gel, little loss was observed for all 3 compounds tested, indicating that they did not reach the gel or that intracellular accumulation was unlikely.
Figure 7.

Transepithelial transport small molecule compounds through the 3-lane plate. To investigate the permeability of small molecule compounds, chips seeded with RPTECs (Lonza no. 2) and HUVECs were treated with cisplatin, tenofovir, or PFOA through either channel (as indicated in figure). (A) The recovery (total compound recovered from both channels compared with stock solutions) and (B) the percent appearance in the recipient channel compared with donor channel indicate that these compounds are not accumulating in the gel layer (recovery near 100% from chips), and that the cells are providing some additional, but minimal barrier to permeability (n = 4 for all conditions).
In addition, compound appearance in the opposite (recipient) channel was quantified and “% Equilibrated over 24 h” plotted (Figure 7B). A value of 50% equilibration would indicate equal concentrations in donor and recipient channels. In “no cell” devices (open circles) we detected only 10%–30% equilibration between channels. When cells were present, cisplatin and tenofovir were expected to demonstrate higher “secretion” (higher transport rates when added into HUVEC and measured in RPTEC channel); however, equilibration was nearly identical in both cell-seeded directions indicating that cells were not actively transporting in either direction. In contrast, PFOA should be reuptaken (higher transport rates when added into RPTEC and measured in HUVEC channel). We did observe an increase, albeit only approximately 5% overall, in transport commensurate with reuptake from the apical side of the RPTECs. It is important to note however, that true “equilibration” was never reached in this chip due to the gel channel providing significant barrier to transport (see also Figs. 2D and 2E).
Even though the compound concentrations selected here were meant to be subcytotoxic for RPTECs (Vormann et al., 2018, 2021), we determined potential toxic effects on different types of RPTEC by testing media for KIM-1 and LDH and cells for gene expression changes (Figure 8). KIM-1 was only tested in the effluent from the RPTEC channel because it is an injury marker that is specific to proximal tubule cells (Han et al., 2002). LDH is a ubiquitous enzyme in all mammalian cells and is released upon loss of integrity of the plasma membrane (Kumar et al., 2018); it was tested in both the RPTEC and HUVEC channels. Tenofovir (squares) and PFOA (triangles) in tested concentrations had no effect on either KIM-1 or LDH (Figure 8A). However, cisplatin (filled circles) did result in a significant time-dependent loss of KIM-1 when added directly to the RPTEC channel in both RPTEC donors. Although increases in KIM-1 are typically a biomarker of kidney injury in vivo (Han et al., 2002), decreases in KIM-1 release are observed in vitro because cytotoxicity results in lower cell numbers and thus an overall decrease in KIM-1 in cell culture media (Sakolish et al., 2018). No effect on KIM-1 release was observed when cisplatin was added to the HUVEC channel, commensurate with the observation that only a fraction of the drug could traverse the gel barrier (Figure 7). Similarly, LDH activity was only significantly increased when cisplatin was added directly to the RPTEC channel. LDH activity in the HUVEC channel was much more variable; no significant effect was observed.
Figure 8.

Injury marker release and gene expression changes after treatment with small molecule compounds in OrganoPlate 3-lane 40. A, Cisplatin, tenofovir, or PFOA was added to either the RPTEC or HUVEC channel for transport studies and KIM-1 (RPTEC channel only) and LDH (both fluidic channels) were measured in effluent samples to study nephrotoxicity. Results are reported as percentage of control (vehicle, 0.1% DMSO), Asterisks (*) indicate significance p ≤ .05 as determined by 2-way ANOVA comparing each group against the control (n = 4 for all conditions). See Supplementary Table 6 for the power analysis of the LDH data in panel (A). B, Gene expression profiles of RPTECs exposed to cisplatin. Heatmaps were plotted using shrunken log-2-fold-change comparing cisplatin treatment and the vehicle control samples in each cell line using DESeq2 as input data matrix. Samples (columns) were ordered by cell type and transcripts (rows) were clustered (Euclidean distance and complete linkage). Expression values for the genes shown and a complete list of shown genes are included in Supplementary Table 5.
In addition, gene expression was compared between vehicle- or cisplatin-treated RPTECs from both donors at the end of the experiments (day 7 of treatment, Figure 8B, Supplementary Table 5). Gene expression effects of cisplatin were highly concordant among biological replicates within each donor and between RPTEC donors. Most affected genes were down-regulated and the primary significant pathways that were lower in cisplatin-treated cells were cytoskeletal organization, organic anion transport, and cell proliferation (Table 3). Concomitantly, cell response to stress pathways, specifically DNA damage response, involving genes in DNA strand break repair and p53-activation, were upregulated as would be expected for cisplatin in vivo (Oliver et al., 2010).
Table 3.
Significantly affected pathways derived from transcriptomic profiles shown in Figure 8B
| Pathways (Total No. of Genes in a Pathway) | Significantly Affected Genes in a Pathway | p adj |
|---|---|---|
| Cisplatin treatment-associated decreased expression | ||
| GO: Cytoskeleton organization (107) | ANLN, APOE, AQP1, BIRC5, CDK1, EVL, FGF7, GAPDH, KIF14, KIF20A, KIF2C, MYBL2, NEK2, PRC1, SPAG4, SPAG5, TPM1 | <.05 |
| GO: Organic anion transport (48) | APOE, AQP1, CA9, FABP1, LDLR, SLC22A6, SLC22A7, SLC27A2, SLC2A3, SLC7A5 | <.05 |
| GO: Microtubule cytoskeleton organization (53) | BIRC5, CDK1, GAPDH, KIF14, KIF20A, KIF2C, MYBL2, NEK2, PRC1, SPAG5 | <.05 |
| GO: Regulation of cell proliferation (201) | ADM, APOE, AQP1, BIRC5, CDC20, CDK1, ERBB3, F2, F3, FABP1, FGF7, FN1, HMOX1, IGFBP3, KIF14, LTF, NDRG1, PRC1, PTGS1, SEMA5A, SHCBP1, TPM1, VCAM1 | <.05 |
| Cisplatin treatment-associated increased expression | ||
| GO: Cellular response to DNA damage stimulus (117) | MDM2, PCNA, RRM2B, TIGAR, TRIAP1, XPC | <.05 |
| GO: Cellular response to stress (273) | CCL2, FAS, MDM2, PCNA, PPM1D, RRM2B, TIGAR, TRIAP1, XPC | <.05 |
GO, gene ontology.
Discussion
One common barrier to adoption of new test methods by the end-users is the need to standardize the protocols and demonstrate a method’s utility in specific investigative or regulatory contexts (Ewart and Roth, 2021; Hargrove-Grimes et al., 2021; Rusyn et al., 2022). It is also not uncommon that developers of new test methods, especially in thise as complex as microphysiological systems, provide incomplete information to determine the potential utility of their models for drug and chemical safety evaluation. These shortcomings and paths to address them have been recently described for several toxicologically relevant organs (Fabre et al., 2020). For example, a microphysiological system that can faithfully recapitulate the kidney proximal tubule microenvironment in which cells exhibit proper polarity and form perfusable structures would also be of great utility in drug safety evaluation. Accordingly, a collaboration of prospective end-users of kidney microphysiological models proposed several contexts where a new in vitro kidney model can demonstrate utility to both drug developers and regulators (Phillips et al., 2020). These include the overall technical feasibility and reproducibility, as well as kidney-specific features that determine the suitability of an in vitro model for application in drug safety evaluations—kidney phenotype, kidney function, and response to xenobiotics (Phillips et al., 2020). The OrganoPlate 3-lane 40 has been proposed as a medium-throughput platform for studies of barrier tissues, including kidney proximal tubule (Gijzen et al., 2021; Naik et al., 2021; Suter-Dick et al., 2018; Vormann et al., 2018, 2021, 2022). Accordingly, this study included experiments that details both advantages and challenges of OrganoPlate 3-lane 40 in the context of studies of the kidney proximal tubule.
First, we focused on the technical aspects of the OrganoPlate 3-lane 40 and its performance with a range of commercially available RPTEC types. Previous publications that used this model for studies of human kidney were coauthored by the manufacturer of these devices. Because it is likely that most future users would apply these in their own laboratories and follow standard protocols, we conducted an independent evaluation of the model’s robustness and reproducibility. Not only did we aim to emulate the published methods, but we also compared several RPTEC cell lines to determine the applicability of the standard protocol to different cells. We also provide full access to the data and refined protocols (see Supplementary Table 2).
We observed the formation of perfusable tubules with all RPTEC lines tested, as well as with HUVECs in the channel opposite the gel lane with a reasonably high success rate (approximately 95% of chips showed successful gel and cell loading). However, significant cell invasion into the gel lane was observed past 3–7 days of culture depending on the cell source, demonstrating the need to optimize in-house protocols (eg, study duration) based on the types of cells to be used. This observation, although it may appear to some as somewhat trivial, is nonetheless important for future users because it provides information on the constrains of the range of potential contexts of use, access to the images and other data from our studies, as well as other evidence that typically is not available from vendors.
The major benefits of the OrganoPlate 3-lane 40 model are the standardized layout (similar to that of a standard multiwell plate), as well as the optically transparent plate bottom allowing for automated imaging and 3D tubule reconstruction. The rocking plate perfusion platform also allows for the simultaneous running of multiple OrganoPlates 3-lane 40 with a reasonably low footprint; the model does not require pumps to drive media flow. We confirmed formation of tight junctions in both the RPTEC and HUVEC channels, indicating that cells were proliferating and filling out the tubules after cell loading. Still, RPTECs remained largely cuboidal in their shape; few cells adopted a spindle-like morphology that is more typical to how cells are positioned in a continuously perfused tubule in vivo, or in the microphysiological models of the proximal tubule under constant flow (Sakolish et al., 2018). Indeed, questions remain as to how “physiologic” the media flow/shear stress resulting from the plate rocking method in this model is; media flow is intermittent with large swings in sheer stress from 0 to 1.7 dyne/cm2 over 8-min plate inversion cycles as reported for this 3-lane model (Vormann et al., 2018).
Second, we focused on the determination of whether there are differences in kidney phenotype/functionality that are afforded by OrganoPlate 3-lane 40 as compared with a multiwell 2D cell culture. No previous publication offered a comparison between OrganoPlate 3-lane 40 and standard multiwell culture conditions with RPTEC. This information, frequently lacking in tissue chip development publications or reports from the vendors, is critical for determining the utility and context of use for these models because they typically offer lower throughput and higher cost. Here, we tested the same cells side by side in OrganoPlate 3-lane 40 and multi-well plates and analyzed several relevant phenotypes. We observed that differences between cell types used in these experiments are often greater than the differences between culture conditions. This pertains to both biomarkers (eg, secretion of KIM-1 or leakage of LDH) and other molecular features. For example, when transporter function and gene expression were compared between RPTECs grown in the OrganoPlate 3-lane 40 or in 2D cultures (96 or 384 well plates), we found largely similar transporter performance of RPTEC in both configurations. In fact, for OAT-1, OCT-2, P-gp, and SGLT2, the data were more interpretable from 2D studies. This was likely due to higher fluorescent background in 3D cultures due to technical challenges in removing the fluorescent substrate from gel and thoroughly washing perfusion channels. One exception, however, was for MRP activity that was observed in all 5 RPTEC cell types when tested in microfluidic OrganoPlate 3-lane 40. MRP activity was only detectable in the TERT1-parent and OAT3-overexpressing lines cultured in static 2D conditions. Indeed, others have previously reported that shear stress can modulate SLC and ABC transporters in vitro (Jang et al., 2013; Ross et al., 2021) which would be an advantage of the OrganoPlate 3-lane 40 over 2D cultures. However, transport across RPTECs (ie, between blood and tubule lumen) is difficult to ascertain from studies in OrganoPlate 3-lane 40 due to several technical challenges as discussed next.
Gene expression comparisons between static and microfluidic conditions are also lacking for OrganoPlate 3-lane 40 devices; they are available for an OrganoPlate 2-lane 96 version that was tested with ciPTEC-OAT1 cells (Vriend et al., 2018). In that study, transporter expression was compared between cells cultured in 2D and in the microfluidic device; similar or significantly lower transporter expression levels were found under microfluidic culture conditions. The authors reasoned that because many cells seeded into the device are not in a microfluidic section of the device but would be lysed for gene expression studies, such comparisons should be regarded as qualitative in nature. In the results reported herein, transcriptomics data for a larger compendium of genes was queried and we benchmarked gene expression in both in vitro configurations to human kidney data from dozens of donors, as well as between RPTECs. Although we did observe that the transcriptional profile of the primary RPTECs tested herein was most concordant with that of the human kidney data, we found little evidence of the microfluidic condition making these cells more physiologically relevant. In fact, the main difference between RPTECs tested herein was that TERT-immortalized lines were most similar to other in vitro-cultured human cells (like fibroblasts) rather than to the human kidney; again, minimal benefit to the transcriptome was afforded by the culture in OrganoPlate 3-lane 40. Both gene- and pathway-level analyses confirmed that RPTECs of different origin (or transporter overexpression state) have important differences in the metabolism functionality, but that the culture condition afforded by either model had little distinguishing power.
Third, in relation to kidney function of clearing/reabsorbing small molecules and for investigations of drug transport, we also note an important difference of our study from previous publications. OrganoPlate 3-lane 40 is dependent on establishing a gel barrier between the tubule and vasculature compartments. This configuration allows for creation of distinct perfusable channels that can be accessed independently. However, the thickness of the barrier between 2 perfusable compartments (approximately 350 µm) is far greater than that in the nephron. This would also likely impede transport of the molecules between channels. Previous studies in OrganoPlate 3-lane 40 (Naik et al., 2021; Schutgens et al., 2019; Vormann et al., 2018, 2021) demonstrated transport (or lack thereof because of the tight cell barrier) of fairly large molecules (4.4–155 kDa) from the RPTEC compartment into the gel lane. However, little information is available on the transport of small molecules, or the ability of any molecule added to one channel to transverse across the gel lane. Only short term (<20 min) image-based measurements under static conditions were performed, focusing on the small volumes of the perfusion channels. We found that the gel lane, not the cells, is the greatest barrier to drug transport. Cells do provide additional benefit, but it is relatively small compared with the overall lack of transport. Attempts to change the composition of the gel lane were found to be futile (data not shown) because they introduced additional technical/biological challenges and did not result in measurable improvements to drug transport. Specifically, by stiffening the gel, one may decrease the success in loading it properly and further impede drug permeability. If the opposite approach is taken, cells may invade into the gel more aggressively thus creating microchannels to facilitate media/drug penetration, a phenomenon that is not replicating normal biology and a factor that will increase variability among devices on the same plate.
Studies of barrier tissue formation are largely impractical in standard multi-well plates; Transwells are needed to test barrier function. In this respect, OrganoPlate 3-lane 40 is a suitable alternative to Transwell-based model for testing barrier permeability (typically by using fluorescent substrates) and for studies of intake/efflux into the cells through the apical membrane. However, studies of the basolateral transport in this model are difficult. This conclusion is based on our observations that both with and without cells, transport/equilibration of both larger and small molecules was impeded by the diffusion into the gel lane. Although tissue chip developers often are concerned about nonspecific drug binding to the devices themselves (van Meer et al., 2017), we found this to be a relatively minor issue for OrganoPlate 3-lane 40 as compared with the compound “sink” afforded by the gel substrate. This was demonstrated using both analytical measurements and by studies of drug toxicity (eg, cisplatin administration through the HUVEC channel exhibiting some effect in the RPTEC channel). The amount of media in each channel (100 µl) is far greater than the amount of the gel (2 µl) so that almost full amount of each compound injected was recovered from the channel in which it was delivered. It is also noteworthy that little difference in transport was observed for cisplatin and tenofovir when they were delivered to either side, indicating that cells did not provide selective transport through either apical or basal membrane; however, this result may be cell type-dependent. Only with PFOA we observed selective transport, commensurate with in vivo human kidney reabsorption (U.S. EPA, 2016); still, quantifying the rate of transport and conducting comparative studies of other perfluorinated compounds in this model may be difficult due to relatively small percentage of the compound that could traverse the gel layer. Because the gel is largely impossible to extract from the OrganoPlate 3-lane 40, an important component of the overall mass balance is missing. In addition, the ability of RPTECs to facilitate uptake of the compounds from the gel via basolateral transporters may be also limited; thus, it may only be possible to model active reuptake directly from media.
In conclusion, this study provides several important practical considerations for using OrganoPlate 3-lane 40 to model the renal proximal tubule in vitro. The devices are readily available and can be seeded with various RPTEC lines. There are many publications as well as established protocols for how these devices are to be assembled and maintained. This model offers microfluidic flow yet does not require additional pumps and therefore is reasonably high throughput. We offer additional experimental protocols and data on a wide range of RPTEC lines that can be used as a reference when establishing this model in a new laboratory. At the same time, this model appears to offer only limited (MRP transporters) advantages in terms of either gene expression or transporter function compared with the multiwell plate culture conditions. It can be used to study cellular uptake and direct (ie, when added to the channel with RPTECs) toxic effects of small molecules; however, it is not a model that can be used for studies of pharmaco-/toxico-kinetics because drug transport between blood and tubule compartments is affected by the gel barrier.
Supplementary Material
Contributor Information
Courtney Sakolish, Department of Veterinary Physiology and Pharmacology, Texas A&M University, College Station, Texas 77843, USA.
Haley L Moyer, Department of Veterinary Physiology and Pharmacology, Texas A&M University, College Station, Texas 77843, USA.
Han-Hsuan D Tsai, Department of Veterinary Physiology and Pharmacology, Texas A&M University, College Station, Texas 77843, USA.
Lucie C Ford, Department of Veterinary Physiology and Pharmacology, Texas A&M University, College Station, Texas 77843, USA.
Allison N Dickey, Bioinformatics Research Center, North Carolina State University, Raleigh, North Carolina 27695, USA.
Fred A Wright, Bioinformatics Research Center, North Carolina State University, Raleigh, North Carolina 27695, USA; Department of Statistics, North Carolina State University, Raleigh, North Carolina 27695, USA; Department of Biological Sciences, North Carolina State University, Raleigh, North Carolina 27695, USA.
Gang Han, Department of Epidemiology and Biostatistics, Texas A&M University, College Station, Texas 77843, USA.
Piyush Bajaj, Global Investigative Toxicology, Preclinical Safety, Sanofi, Cambridge, Massachusetts 02141, USA.
Maria T Baltazar, Safety & Environmental Assurance Centre (SEAC), Unilever, Bedfordshire MK44 1LQ, UK.
Paul L Carmichael, Safety & Environmental Assurance Centre (SEAC), Unilever, Bedfordshire MK44 1LQ, UK.
Jason P Stanko, Division of Translational Toxicology, National Institute of Environmental Health Sciences, Research Triangle Park, North Carolina 27709, USA.
Stephen S Ferguson, Division of Translational Toxicology, National Institute of Environmental Health Sciences, Research Triangle Park, North Carolina 27709, USA.
Ivan Rusyn, Department of Veterinary Physiology and Pharmacology, Texas A&M University, College Station, Texas 77843, USA.
Supplementary data
Supplementary data are available at Toxicological Sciences online.
Funding
National Center for Advancing Translational Sciences (U24 TR001950, U24 TR002633); National Institute of Environmental Health Sciences (T32 ES026568, P42 ES027704); U.S. EPA (STAR RD 84003201); and equitable monetary contributions from TEX-VAL Consortium member organizations.
Declaration of conflicting interests
The authors who are affiliated with Texas A&M University and the National Institute of Environmental Health Sciences declare no relevant conflicts of interest. Other authors are employed by various commercial entities or nonprofit organizations who may use various microphysiological systems or have commercial relationships with vendors of the models mentioned in this manuscript. The views expressed in this manuscript do not necessarily represent those of the author’s affiliated organizations or the funding agencies. The use of specific commercial products in this work does not constitute endorsement by the author’s affiliated organizations or the funding agencies.
Data availability
All data reported herein are available from the University of Pittsburgh Drug Discovery Institute Microphysiology Systems Database (https://mps.csb.pitt.edu/), see Supplementary Table 2 for the list of hyperlinks to each study and the data herein. MIAME-compliant expression data and experimental metadata have been uploaded to the Gene Expression Omnibus (GSE233406).
References
- Al-Awqati Q., Oliver J. A. (2002). Stem cells in the kidney. Kidney Int. 61, 387–395. [DOI] [PubMed] [Google Scholar]
- Balzer M. S., Rohacs T., Susztak K. (2022). How many cell types are in the kidney and what do they do? Annu. Rev. Physiol. 84, 507–531. [DOI] [PMC free article] [PubMed] [Google Scholar]
- Bam R. A., Yant S. R., Cihlar T. (2014). Tenofovir alafenamide is not a substrate for renal organic anion transporters (OATs) and does not exhibit OAT-dependent cytotoxicity. Antivir. Ther. 19, 687–692. [DOI] [PubMed] [Google Scholar]
- Bernhardt A., Fehr A., Brandt S., Jerchel S., Ballhause T. M., Philipsen L., Stolze S., Geffers R., Weng H., Fischer K. D., et al. (2017). Inflammatory cell infiltration and resolution of kidney inflammation is orchestrated by the cold-shock protein Y-box binding protein-1. Kidney Int. 92, 1157–1177. [DOI] [PubMed] [Google Scholar]
- Bonventre J. V., Vaidya V. S., Schmouder R., Feig P., Dieterle F. (2010). Next-generation biomarkers for detecting kidney toxicity. Nat. Biotechnol. 28, 436–440. [DOI] [PMC free article] [PubMed] [Google Scholar]
- Bushel P. R., Paules R. S., Auerbach S. S. (2018). A comparison of the TempO-Seq S1500+ platform to RNA-Seq and microarray using rat liver mode of action samples. Front. Genet. 9, 485. [DOI] [PMC free article] [PubMed] [Google Scholar]
- Chen S., Zhou Y., Chen Y., Gu J. (2018). Fastp: An ultra-fast all-in-one FASTQ preprocessor. Bioinformatics 34, i884–i890. [DOI] [PMC free article] [PubMed] [Google Scholar]
- Cichocki J. A., Guyton K. Z., Guha N., Chiu W. A., Rusyn I., Lash L. H. (2016). Target organ metabolism, toxicity, and mechanisms of trichloroethylene and perchloroethylene: Key similarities, differences, and data gaps. J. Pharmacol. Exp. Ther. 359, 110–123. [DOI] [PMC free article] [PubMed] [Google Scholar]
- Clark M., Steger-Hartmann T. (2018). A big data approach to the concordance of the toxicity of pharmaceuticals in animals and humans. Regul. Toxicol. Pharmacol. 96, 94–105. [DOI] [PubMed] [Google Scholar]
- Cong Y., Han X., Wang Y., Chen Z., Lu Y., Liu T., Wu Z., Jin Y., Luo Y., Zhang X. (2020). Drug toxicity evaluation based on organ-on-a-chip technology: A review. Micromachines (Basel) 11, 381. [DOI] [PMC free article] [PubMed] [Google Scholar]
- Czerniecki S. M., Cruz N. M., Harder J. L., Menon R., Annis J., Otto E. A., Gulieva R. E., Islas L. V., Kim Y. K., Tran L. M., et al. (2018). High-Throughput screening enhances kidney organoid differentiation from human pluripotent stem cells and enables automated multidimensional phenotyping. Cell Stem Cell 22, 929–940.e4. [DOI] [PMC free article] [PubMed] [Google Scholar]
- Ewart L., Roth A. (2021). Opportunities and challenges with microphysiological systems: A pharma end-user perspective. Nat. Rev. Drug Discov. 20, 327–328. [DOI] [PubMed] [Google Scholar]
- Fabre K., Berridge B., Proctor W. R., Ralston S., Will Y., Baran S. W., Yoder G., Van Vleet T. R. (2020). Introduction to a manuscript series on the characterization and use of microphysiological systems (MPS) in pharmaceutical safety and ADME applications. Lab Chip. 20, 1049–1057. [DOI] [PubMed] [Google Scholar]
- Fang H., Knezevic B., Burnham K. L., Knight J. C. (2016). XGR software for enhanced interpretation of genomic summary data, illustrated by application to immunological traits. Genome Med. 8, 129. [DOI] [PMC free article] [PubMed] [Google Scholar]
- Forster F., Volz A., Fricker G. (2008). Compound profiling for ABCC2 (MRP2) using a fluorescent microplate assay system. Eur. J. Pharm. Biopharm. 69, 396–403. [DOI] [PubMed] [Google Scholar]
- Franke R. M., Kosloske A. M., Lancaster C. S., Filipski K. K., Hu C., Zolk O., Mathijssen R. H., Sparreboom A. (2010). Influence of Oct1/Oct2-deficiency on cisplatin-induced changes in urinary N-acetyl-beta-d-glucosaminidase. Clin. Cancer Res. 16, 4198–4206. [DOI] [PMC free article] [PubMed] [Google Scholar]
- Fritsche E., Haarmann-Stemmann T., Kapr J., Galanjuk S., Hartmann J., Mertens P. R., Kampfer A. A. M., Schins R. P. F., Tigges J., Koch K. (2021). Stem cells for next level toxicity testing in the 21st century. Small 17, e2006252. [DOI] [PubMed] [Google Scholar]
- Gijzen L., Yousef Yengej F. A., Schutgens F., Vormann M. K., Ammerlaan C. M. E., Nicolas A., Kurek D., Vulto P., Rookmaaker M. B., Lanz H. L., et al. (2021). Culture and analysis of kidney tubuloids and perfused tubuloid cells-on-a-chip. Nat. Protoc. 16, 2023–2050. [DOI] [PubMed] [Google Scholar]
- Grimm F. A., Iwata Y., Sirenko O., Chappell G. A., Wright F. A., Reif D. M., Braisted J., Gerhold D. L., Yeakley J. M., Shepard P., et al. (2016). A chemical-biological similarity-based grouping of complex substances as a prototype approach for evaluating chemical alternatives. Green Chem. 18, 4407–4419. [DOI] [PMC free article] [PubMed] [Google Scholar]
- GTEx Consortium. (2013). The Genotype-Tissue expression (GTEx) project. Nat Genet 45, 580–585. [DOI] [PMC free article] [PubMed] [Google Scholar]
- GTEx Consortium. (2015). Human genomics. The Genotype-Tissue expression (GTEx) pilot analysis: Multitissue gene regulation in humans. Science 348, 648–660. [DOI] [PMC free article] [PubMed] [Google Scholar]
- GTEx Consortium. (2017a). Genetic effects on gene expression across human tissues. Nature 550, 204–213. [DOI] [PMC free article] [PubMed] [Google Scholar]
- GTEx Consortium. (2017b). GTEx Analysis V8 (dbGaP Accession phs000424.v8.p2): Gene Read Counts. Available at: https://storage.googleapis.com/gtex_analysis_v8/rna_seq_data/GTEx_Analysis_2017-06-05_v8_RNASeQCv1.1.9_gene_reads.gct.gz.
- Hagos Y., Wolff N. A. (2010). Assessment of the role of renal organic anion transporters in drug-induced nephrotoxicity. Toxins (Basel) 2, 2055–2082. [DOI] [PMC free article] [PubMed] [Google Scholar]
- Han W. K., Bailly V., Abichandani R., Thadhani R., Bonventre J. V. (2002). Kidney injury molecule-1 (KIM-1): A novel biomarker for human renal proximal tubule injury. Kidney Int. 62, 237–244. [DOI] [PubMed] [Google Scholar]
- Hargrove-Grimes P., Low L. A., Tagle D. A. (2021). Microphysiological systems: What it takes for community adoption. Exp Biol Med (Maywood) 246, 1435–1446. [DOI] [PMC free article] [PubMed] [Google Scholar]
- Harrach S., Ciarimboli G. (2015). Role of transporters in the distribution of platinum-based drugs. Front. Pharmacol. 6, 85. [DOI] [PMC free article] [PubMed] [Google Scholar]
- Harrill J. A., Everett L. J., Haggard D. E., Sheffield T., Bundy J. L., Willis C. M., Thomas R. S., Shah I., Judson R. S. (2021). High-Throughput transcriptomics platform for screening environmental chemicals. Toxicol. Sci. 181, 68–89. [DOI] [PMC free article] [PubMed] [Google Scholar]
- House J. S., Grimm F. A., Jima D. D., Zhou Y. H., Rusyn I., Wright F. A. (2017). A pipeline for High-Throughput concentration response modeling of gene expression for toxicogenomics. Front. Genet. 8, 168. [DOI] [PMC free article] [PubMed] [Google Scholar]
- House J. S., Grimm F. A., Klaren W. D., Dalzell A., Kuchi S., Zhang S. D., Lenz K., Boogaard P. J., Ketelslegers H. B., Gant T. W., et al. (2022). Grouping of UVCB substances with dose-response transcriptomics data from human cell-based assays. Altex 39, 388–404–404. [DOI] [PMC free article] [PubMed] [Google Scholar]
- Ichimura T., Asseldonk E. J., Humphreys B. D., Gunaratnam L., Duffield J. S., Bonventre J. V. (2008). Kidney injury molecule-1 is a phosphatidylserine receptor that confers a phagocytic phenotype on epithelial cells. J. Clin. Invest. 118, 1657–1668. [DOI] [PMC free article] [PubMed] [Google Scholar]
- Iismaa S. E., Kaidonis X., Nicks A. M., Bogush N., Kikuchi K., Naqvi N., Harvey R. P., Husain A., Graham R. M. (2018). Comparative regenerative mechanisms across different mammalian tissues. NPJ Regen. Med. 3, 6. [DOI] [PMC free article] [PubMed] [Google Scholar]
- Imenez Silva P. H., Mohebbi N. (2022). Kidney metabolism and acid-base control: Back to the basics. Pflugers Arch. 474, 919–934. [DOI] [PMC free article] [PubMed] [Google Scholar]
- Jang K. J., Mehr A. P., Hamilton G. A., McPartlin L. A., Chung S., Suh K. Y., Ingber D. E. (2013). Human kidney proximal tubule-on-a-chip for drug transport and nephrotoxicity assessment. Integr Biol (Camb) 5, 1119–1129. [DOI] [PubMed] [Google Scholar]
- Jung D. W., Ha H. H., Zheng X., Chang Y. T., Williams D. R. (2011). Novel use of fluorescent glucose analogues to identify a new class of triazine-based insulin mimetics possessing useful secondary effects. Mol. Biosyst. 7, 346–358. [DOI] [PubMed] [Google Scholar]
- Kato Y., Lim A. Y., Sakolish C., Valdiviezo A., Moyer H. L., Hewitt P., Bajaj P., Han G., Rusyn I. (2022). Analysis of reproducibility and robustness of OrganoPlate(R) 2-lane 96, a liver microphysiological system for studies of pharmacokinetics and toxicological assessment of drugs. Toxicol. In Vitro 85, 105464. [DOI] [PMC free article] [PubMed] [Google Scholar]
- Kumar P., Nagarajan A., Uchil P. D. (2018). Analysis of cell viability by the lactate dehydrogenase assay. Cold Spring Harb Protoc 2018, 465–468. [DOI] [PubMed] [Google Scholar]
- Lazzeri E., Angelotti M. L., Peired A., Conte C., Marschner J. A., Maggi L., Mazzinghi B., Lombardi D., Melica M. E., Nardi S., et al. (2018). Endocycle-related tubular cell hypertrophy and progenitor proliferation recover renal function after acute kidney injury. Nat. Commun. 9, 1344. [DOI] [PMC free article] [PubMed] [Google Scholar]
- Limonciel A., Ates G., Carta G., Wilmes A., Watzele M., Shepard P. J., VanSteenhouse H. C., Seligmann B., Yeakley J. M., van de Water B., et al. (2018). Comparison of base-line and chemical-induced transcriptomic responses in HepaRG and RPTEC/TERT1 cells using TempO-Seq. Arch. Toxicol. 92, 2517–2531. [DOI] [PMC free article] [PubMed] [Google Scholar]
- Liu Y., Sakolish C., Chen Z., Phan D. T. T., Bender R. H. F., Hughes C. C. W., Rusyn I. (2020). Human in vitro vascularized micro-organ and micro-tumor models are reproducible organ-on-a-chip platforms for studies of anticancer drugs. Toxicology 445, 152601. [DOI] [PMC free article] [PubMed] [Google Scholar]
- Love M. I., Huber W., Anders S. (2014). Moderated estimation of fold change and dispersion for RNA-seq data with DESeq2. Genome Biol. 15, 550. [DOI] [PMC free article] [PubMed] [Google Scholar]
- Maass C., Sorensen N. B., Himmelfarb J., Kelly E. J., Stokes C. L., Cirit M. (2019). Translational assessment of Drug-Induced proximal tubule injury using a kidney microphysiological system. CPT Pharmacometrics Syst. Pharmacol. 8, 316–325. [DOI] [PMC free article] [PubMed] [Google Scholar]
- Machin D., Campbell M., Tan S., Tan S.-H. (2011). Sample Size Tables for Clinical Studies, 3rd ed. Wiley-Blackwell. Hoboken, NJ 07030-5774, USA. [Google Scholar]
- Masereeuw R., Russel F. G. (2001). Mechanisms and clinical implications of renal drug excretion. Drug Metab. Rev. 33, 299–351. [DOI] [PubMed] [Google Scholar]
- Mav D., Shah R. R., Howard B. E., Auerbach S. S., Bushel P. R., Collins J. B., Gerhold D. L., Judson R. S., Karmaus A. L., Maull E. A., et al. (2018). A hybrid gene selection approach to create the S1500+ targeted gene sets for use in high-throughput transcriptomics. PLoS One. 13, e0191105. [DOI] [PMC free article] [PubMed] [Google Scholar]
- Musah S., Mammoto A., Ferrante T. C., Jeanty S. S. F., Hirano-Kobayashi M., Mammoto T., Roberts K., Chung S., Novak R., Ingram M., et al. (2017). Mature induced-pluripotent-stem-cell-derived human podocytes reconstitute kidney glomerular-capillary-wall function on a chip. Nat Biomed Eng 1, 0069. [DOI] [PMC free article] [PubMed] [Google Scholar]
- Naik S., Wood A. R., Ongenaert M., Saidiyan P., Elstak E. D., Lanz H. L., Stallen J., Janssen R., Smythe E., Erdmann K. S. (2021). A 3D renal proximal tubule on chip model phenocopies Lowe syndrome and dent II disease tubulopathy. Int. J. Mol. Sci. 22, 5361. [DOI] [PMC free article] [PubMed] [Google Scholar]
- Naughton C. A. (2008). Drug-induced nephrotoxicity. Am. Fam. Physician 78, 743–750. [PubMed] [Google Scholar]
- Novak R., Ingram M., Marquez S., Das D., Delahanty A., Herland A., Maoz B. M., Jeanty S. S. F., Somayaji M. R., Burt M., et al. (2020). Robotic fluidic coupling and interrogation of multiple vascularized organ chips. Nat. Biomed. Eng. 4, 407–420. [DOI] [PMC free article] [PubMed] [Google Scholar]
- Oliver T. G., Mercer K. L., Sayles L. C., Burke J. R., Mendus D., Lovejoy K. S., Cheng M. H., Subramanian A., Mu D., Powers S., et al. (2010). Chronic cisplatin treatment promotes enhanced damage repair and tumor progression in a mouse model of lung cancer. Genes Dev. 24, 837–852. [DOI] [PMC free article] [PubMed] [Google Scholar]
- Perazella M. A. (2009). Renal vulnerability to drug toxicity. Clin. J. Am. Soc. Nephrol. 4, 1275–1283. [DOI] [PubMed] [Google Scholar]
- Phillips J. A., Grandhi T. S. P., Davis M., Gautier J. C., Hariparsad N., Keller D., Sura R., Van Vleet T. R. (2020). A pharmaceutical industry perspective on microphysiological kidney systems for evaluation of safety for new therapies. Lab Chip. 20, 468–476. [DOI] [PubMed] [Google Scholar]
- Ross E. J., Gordon E. R., Sothers H., Darji R., Baron O., Haithcock D., Prabhakarpandian B., Pant K., Myers R. M., Cooper S. J., et al. (2021). Three dimensional modeling of biologically relevant fluid shear stress in human renal tubule cells mimics in vivo transcriptional profiles. Sci. Rep. 11, 14053. [DOI] [PMC free article] [PubMed] [Google Scholar]
- Rusyn I., Sakolish C., Kato Y., Stephan C., Vergara L., Hewitt P., Bhaskaran V., Davis M., Hardwick R. N., Ferguson S. S., et al. (2022). Microphysiological systems evaluation: Experience of TEX-VAL tissue chip testing consortium. Toxicol. Sci. 188, 143–152. [DOI] [PMC free article] [PubMed] [Google Scholar]
- Sakolish C., Luo Y. S., Valdiviezo A., Vernetti L. A., Rusyn I., Chiu W. A. (2021a). Prediction of hepatic drug clearance with a human microfluidic four-cell liver acinus microphysiology system. Toxicology 463, 152954. [DOI] [PMC free article] [PubMed] [Google Scholar]
- Sakolish C., Reese C. E., Luo Y. S., Valdiviezo A., Schurdak M. E., Gough A., Taylor D. L., Chiu W. A., Vernetti L. A., Rusyn I. (2021b). Analysis of reproducibility and robustness of a human microfluidic four-cell liver acinus microphysiology system (LAMPS). Toxicology 448, 152651. [DOI] [PMC free article] [PubMed] [Google Scholar]
- Sakolish C., Weber E. J., Kelly E. J., Himmelfarb J., Mouneimne R., Grimm F. A., House J. S., Wade T., Han A., Chiu W. A., et al. (2018). Technology transfer of the microphysiological systems: A case study of the human proximal tubule tissue chip. Sci. Rep. 8, 14882. [DOI] [PMC free article] [PubMed] [Google Scholar]
- Schneider C. A., Rasband W. S., Eliceiri K. W. (2012). NIH image to ImageJ: 25 years of image analysis. Nat. Methods 9, 671–675. [DOI] [PMC free article] [PubMed] [Google Scholar]
- Schutgens F., Rookmaaker M. B., Margaritis T., Rios A., Ammerlaan C., Jansen J., Gijzen L., Vormann M., Vonk A., Viveen M., et al. (2019). Tubuloids derived from human adult kidney and urine for personalized disease modeling. Nat. Biotechnol. 37, 303–313. [DOI] [PubMed] [Google Scholar]
- Soo J. Y., Jansen J., Masereeuw R., Little M. H. (2018). Advances in predictive in vitro models of drug-induced nephrotoxicity. Nat. Rev. Nephrol. 14, 378–393. [DOI] [PMC free article] [PubMed] [Google Scholar]
- Suter-Dick L., Mauch L., Ramp D., Caj M., Vormann M. K., Hutter S., Lanz H. L., Vriend J., Masereeuw R., Wilmer M. J. (2018). Combining extracellular miRNA determination with microfluidic 3D cell cultures for the assessment of nephrotoxicity: A proof of concept study. AAPS J. 20, 86. [DOI] [PubMed] [Google Scholar]
- U.S. EPA. (2016). Health Effects Support Document for Perfluorooctanoic Acid (PFOA). Office of Water, U.S. Environmental Protection Agency, Washington, DC.
- Ullrich K. J. (1999). Affinity of drugs to the different renal transporters for organic anions and organic cations. Pharm Biotechnol 12, 159–179. [DOI] [PubMed] [Google Scholar]
- Vaidya V. S., Ferguson M. A., Bonventre J. V. (2008). Biomarkers of acute kidney injury. Annu. Rev. Pharmacol. Toxicol. 48, 463–493. [DOI] [PMC free article] [PubMed] [Google Scholar]
- van Meer B. J., de Vries H., Firth K. S. A., van Weerd J., Tertoolen L. G. J., Karperien H. B. J., Jonkheijm P., Denning C., IJzerman A. P., Mummery C. L. (2017). Small molecule absorption by PDMS in the context of drug response bioassays. Biochem. Biophys. Res. Commun. 482, 323–328. [DOI] [PMC free article] [PubMed] [Google Scholar]
- Vormann M. K., Gijzen L., Hutter S., Boot L., Nicolas A., van den Heuvel A., Vriend J., Ng C. P., Nieskens T. T. G., van Duinen V., et al. (2018). Nephrotoxicity and kidney transport assessment on 3D perfused proximal tubules. AAPS J. 20, 90. [DOI] [PubMed] [Google Scholar]
- Vormann M. K., Tool L. M., Ohbuchi M., Gijzen L., van Vught R., Hankemeier T., Kiyonaga F., Kawabe T., Goto T., Fujimori A., et al. (2022). Modelling and prevention of acute kidney injury through ischemia and reperfusion in a combined human renal proximal tubule/blood vessel-on-a-Chip. Kidney360 3, 217–231. [DOI] [PMC free article] [PubMed] [Google Scholar]
- Vormann M. K., Vriend J., Lanz H. L., Gijzen L., van den Heuvel A., Hutter S., Joore J., Trietsch S. J., Stuut C., Nieskens T. T. G., et al. (2021). Implementation of a human renal proximal tubule on a chip for nephrotoxicity and drug interaction studies. J. Pharm. Sci. 110, 1601–1614. [DOI] [PubMed] [Google Scholar]
- Vriend J., Nieskens T. T. G., Vormann M. K., van den Berge B. T., van den Heuvel A., Russel F. G. M., Suter-Dick L., Lanz H. L., Vulto P., Masereeuw R., et al. (2018). Screening of drug-transporter interactions in a 3D microfluidic renal proximal tubule on a chip. AAPS J. 20, 87. [DOI] [PubMed] [Google Scholar]
- Wilmer M. J., Ng C. P., Lanz H. L., Vulto P., Suter-Dick L., Masereeuw R. (2016). Kidney-on-a-chip technology for drug-induced nephrotoxicity screening. Trends Biotechnol. 34, 156–170. [DOI] [PubMed] [Google Scholar]
- Wu W., Bush K. T., Nigam S. K. (2017). Key role for the organic anion transporters, OAT1 and OAT3, in the in vivo handling of uremic toxins and solutes. Sci. Rep. 7, 4939. [DOI] [PMC free article] [PubMed] [Google Scholar]
- Yin J., Wang J. (2016). Renal drug transporters and their significance in drug-drug interactions. Acta Pharm. Sin. B 6, 363–373. [DOI] [PMC free article] [PubMed] [Google Scholar]
- Zar J. H. (1984). Biostatistical Analysis, 2nd ed.Prentice-Hall, Englewood Cliffs, NJ. [Google Scholar]
- Zhang L., Brett C. M., Giacomini K. M. (1998). Role of organic cation transporters in drug absorption and elimination. Annu. Rev. Pharmacol. Toxicol. 38, 431–460. [DOI] [PubMed] [Google Scholar]
- Zhuo J. L., Li X. C. (2013). Proximal nephron. Compr. Physiol. 3, 1079–1123. [DOI] [PMC free article] [PubMed] [Google Scholar]
Associated Data
This section collects any data citations, data availability statements, or supplementary materials included in this article.
Supplementary Materials
Data Availability Statement
All data reported herein are available from the University of Pittsburgh Drug Discovery Institute Microphysiology Systems Database (https://mps.csb.pitt.edu/), see Supplementary Table 2 for the list of hyperlinks to each study and the data herein. MIAME-compliant expression data and experimental metadata have been uploaded to the Gene Expression Omnibus (GSE233406).