Abstract
The small-subunit ribosomal DNA (rDNA) diversity was found to be very high in a Hawaiian soil community that might be expected to have lower diversity than the communities in continental soils because the Hawaiian soil is geographically isolated and only 200 years old, is subjected to a constant climate, and harbors low plant diversity. Since an underlying community structure could not be revealed by analyzing the total eubacterial rDNA, we first fractionated the DNA on the basis of guanine-plus-cytosine (G+C) content by using bis-benzimidazole and equilibrium centrifugation and then analyzed the bacterial rDNA amplified from a fraction with a high biomass (63% G+C fraction) and a fraction with a low biomass (35% G+C fraction). The rDNA clone libraries were screened by amplified rDNA restriction analysis to determine phylotype distribution. The dominant biomass reflected by the 63% G+C fraction contained several dominant phylotypes, while the community members that were less successful (35% G+C fraction) did not show dominance but there was a very high diversity of phylotypes. Nucleotide sequence analysis revealed taxa belonging to the groups expected for the G+C contents used. The dominant phylotypes in the 63% G+C fraction were members of the Pseudomonas, Rhizobium-Agrobacterium, and Rhodospirillum assemblages, while all of the clones sequenced from the 35% G+C fraction were affiliated with several Clostridium assemblages. The two-step rDNA analysis used here uncovered more diversity than can be detected by direct rDNA analysis of total community DNA. The G+C separation step is also a way to detect some of the less dominant organisms in a community.
Soil microbial communities remain some of the most difficult communities to characterize due to their extreme phenotypic and genotypic diversity. Estimates of the genotypic diversity in these communities based on DNA renaturation experiments suggest that there are 4 × 10³ to 7 × 10³ different genome equivalents per g of soil (36), which, if extrapolated to species diversity, suggests that there are perhaps 103 or even more species per g of soil. Data from culture-based methods also suggest that there is high microbial diversity in soil, but these methods are extremely biased (25, 32) and recover less than 1% of the viable community (3, 20, 36, 39). Molecular approaches in which rRNA sequences are used to determine the composition of natural communities identify more of the entire community. While these approaches also suffer from some biases and lack resolution at the species level, previous rRNA characterizations have confirmed that there is a high level of bacterial diversity in soil communities (4, 20, 35, 38).
To ask meaningful questions about soil community composition, a more manageable level of diversity (lower diversity) is needed. We sought to study a community with lower diversity by focusing on a geographically isolated, young soil, namely, soil formed from volcanic ash deposited 200 years ago on the island of Hawaii. Due to the geographic isolation of the Hawaiian Islands, the diversity of the native fauna and flora is low (6, 37). Furthermore, we used the site studied because it experiences a constant annual climate, which could also lessen selection for diversity. The low level of diversity in the flora and fauna has made the Hawaiian Islands an attractive site for studies on radiation of species and invasion of alien species. If the soil bacterial community is also less diverse for the same reasons, not only would it be less complex to analyze, but it would allow questions about soil community development to be addressed. An additional advantage of the site selected was the large amount of previously collected data on plant composition, ecosystem processes, and soil characteristics which was available (6, 37).
We analyzed the soil bacterial community diversity of this 200-year-old site by performing an amplified ribosomal DNA (rDNA) restriction analysis of a PCR-amplified rDNA clone library. The initial analysis revealed a diversity too great to be captured in a reasonable number of clones analyzed (80 to 90 clones per soil sample). To lower the soil bacterial diversity to a manageable level, we fractionated the soil DNA on the basis of G+C content as described by Holben and Harris (12) and analyzed rDNA clones in two discrete fractions, a fraction with a large amount of DNA (the 63% G+C fraction) and a fraction with a small amount of DNA (the 35% G+C fraction).
MATERIALS AND METHODS
Soil origin and soil sampling.
Soil was collected from an undisturbed montane rainforest on the island of Hawaii near Thurston Lava Tube on Kilauea Volcano, within Volcano National Park (19°25′N, 155°15′W). The site is dominated by the native tree species Metrosideros polymorpha (which accounts for 91% of the cover) and harbors a total of 34 vascular plant species (6). Several tree ferns form the dominant native understory, which also includes Citobium spp., Coprosoma spp., and Vaccinium claycinum. The site is fenced to keep feral pigs (Sus scrofa) out of the park. The sampling site is located at an elevation of 1,200 m, has a mean annual air temperature of 16°C with very little variation (8), and has a mean annual rainfall of 2,500 mm (10) which is well distributed throughout the year due to the relatively constant northeast trade winds (5). The soil is a Hydric Dystrandept developed on several tephra (volcanic ash) depositions ranging in age from 200 to 400 years and is approximately 38 cm deep (31). We removed the litter and the first 1 cm of soil and sampled 7.5 cm of the upper layer, which was deposited 200 years ago. The samples were collected on the perimeter of the Vitousek group’s main study site (6). Duplicate soil samples (750 g each) were packaged on site in sterile polypropylene bags and immediately put on ice. The next day they were placed in dry ice coolers and shipped by express mail to Michigan, where they were stored at −20°C. The soil moisture content was determined by drying soil overnight at 100°C. Soil mechanical and chemical analyses were done at the Soil Analysis Laboratory, Michigan State University, by using the methods described by Peck et al. (27).
DNA extraction and purification.
Soil microbial DNA was extracted from 10 g of soil by the direct lysis method of Holben (11), except that EDTA was not included to reduce coextraction of humic compounds, a low shaker speed was used to prevent extensive DNA shearing, the shaking time was extended to 45 min, and the phosphate concentration in the lysis buffer was adjusted to 100 mM to overcome the high phosphate absorption capacity of the young minerals. The subsequent DNA purification was also modified to include agarose gel purification (0.4% agarose) and a single Microcon-100 microcolumn (Amicon Corp., Beverly, Mass.) passage of the excised and melted gel piece, followed by repeated washing steps. The extraction efficiency was determined by comparing the amount of DNA extracted with the amount of DNA expected, as calculated from the difference between the direct microscopic counts of bacterial cells before and after lysis. Bacterial cells were counted directly by computer-aided microscopic counting procedures (43). For consistency, all counts were obtained by a single investigator.
DNA was quantified by fluorometry (18) with a model TK 100 fluorometer (Hoefer Scientific Instruments, San Francisco, Calif.) by using the extended assay protocol of the manufacturer. Five replicates were used to estimate DNA yields. Known amounts of lambda phage DNA (Boehringer Mannheim, Indianapolis, Ind.) were used for all calibrations. The fluorescence intensity of DNA was also estimated based on the relative intensities in agarose gels of PCR amplification products and restriction digests of known mass.
G+C fractionation technique.
DNA fragments were separated on the basis of G+C content by the procedure of Holben and Harris (12). Briefly, DNA was mixed with bis-benzimidazole (Hoechst reagent no. 33258), which binds to adenine and thymidine and changes the buoyant density of DNA in proportion to its G+C content (40). A gradient of G+C concentrations was then established by equilibrium density gradient ultracentrifugation, and 0.2-ml fractions were collected with a fraction collector. The DNA in each fraction was quantified by spectrophotometry, and its G+C content was established by using a standard curve relating G+C content to density, which was measured with a Bausch & Lomb refractometer. To make PCR amplification possible, bis-benzimide and CsCl were removed from DNA fractions by five repeated extractions in CsCl-saturated isopropanol, followed by spin column chromatography (Wizard PCR Preps; Promega, Madison, Wis.) with two washing steps. A260 was determined before and after purification to monitor for potential losses of DNA during the purification procedure.
PCR amplification of SSU rRNA genes from soil DNA.
Small-subunit (SSU) rRNA genes were PCR amplified from purified soil DNA by using eubacterium-specific primers fD1 and rP2 of Weisburg et al. (41). PCR were performed with Taq DNA polymerase (Boehringer Mannheim) by using the manufacturer’s protocol, an additional 400 ng of bovine serum albumin (Sigma Chemical Co., St. Louis, Mo.) per μl, and a model 9600 thermal cycler (Perkin-Elmer Cetus, Norwalk, Conn.). The protocol used consisted of an initial denaturation step (94°C for 130 s) followed by 25 cycles consisting of denaturation at 94°C for 60 s, primer annealing at 55°C for 30 s, and elongation at 72°C for 120 s plus an additional 7-min cycle to finalize the chain reaction. Negative controls without added DNA, as well as positive controls with pure culture genomic DNA, were included in all PCR. Aliquots (3 μl) of the amplified products were separated in a 0.9% agarose gel by electrophoresis in 1× TAE buffer (22), the gel was stained with ethidium bromide (500 ng/μl), and the bands were visualized by UV excitation. The PCR products were stored at −20°C.
To ensure that only soil bacterial rRNA genes were amplified, the following four quality control steps were used: primer purity was established by high-performance liquid chromatography; oligonucleotide primers were prepared fresh from lyophilized stocks for each use; preamplification heating was used to maximize PCR sensitivity and specificity (7); and the bovine serum albumin stock solution and the commercial Taq DNA polymerase were tested for potential contamination with bacterial nucleic acids (29).
Analysis of SSU rDNA clone library.
The concentrations of PCR-amplified SSU rRNA genes were determined by comparing the fluorescent-band intensities on agarose gels to the fluorescent-band intensities of known concentrations of standard lambda DNA. Prior to cloning, the amplified SSU rDNA fragments were purified by spin column chromatography (Wizard PCR Miniprep; Promega). An equimolar amount of amplified PCR products was ligated to the vector pCR II (Invitrogen, San Diego, Calif.). Ligation and transformation into Escherichia coli Top-10F′ competent cells were carried out according to the manufacturer’s protocol. A primer pair specifically designed to complement the polylinker of the vector pCR II (44) was used to amplify plasmid inserts directly from the transformant cells for SSU rDNA gene screening. The following two types of negative controls were used in the amplification of clone inserts: controls without target DNA added and controls in which untransformed cells were used as a target. The PCR were performed as described above, except that the primer annealing temperature was higher (68°C). To screen for SSU rDNA diversity, the amplified inserts were first digested overnight at 37°C by adding 0.2 U of HhaI and 0.2 U of HaeIII (Gibco BRL, Gaithersburg, Md.) to 5 μl of the PCR product. The resulting fragments were separated by gel electrophoresis in 3.5% Metaphor agarose (FMC Bioproducts, Rockland, Maine) in the presence of ethidium bromide and fresh 1× TBE buffer (22) at 4°C and 5 V/cm for 6 h. Clones with identical restriction patterns were digested with two additional tetrameric restriction endonucleases (0.2 U of MspI and 0.2 U of RsaI). The similarities between the electrophoretic patterns of restriction fragments were analyzed with GelCompar software (Applied Maths, Kortrijk, Belgium). The cluster analysis method used was comparative numerical analysis with the unweighted pair group method using arithmetic averages (UPGMA). Individual clones were grouped by using a cutoff of 97% similarity and a 5% error rate for the band position. The diversities of the phylotypes in different samples were compared by rarefaction analysis (13, 30).
DGGE.
Denaturing gradient gel electrophoresis (DGGE) was performed as previously described by Muyzer (24) with eubacterial PCR primers F-968 and R-1401 of Nübel et al. (26). The parallel denaturing gradient was cast with denaturing agent concentrations ranging from 0 to 60%. The fragments were made visible by acidic silver staining.
Determination of nucleotide sequences and phylogenetic analysis.
Amplified SSU rDNA clone inserts were purified (Wizard PCR Preps; Promega) and partially sequenced. Nucleotide sequences were determined by the fluorescent DiDeoxy termination method by performing automated fluorescent Taq cycle sequencing with the ABI Catalyst 800-ABI 373A sequencing system (Applied Biosystems, Foster City, Calif.). To ensure accuracy and to aid in chimera detection, both ends of the SSU rDNA molecule were sequenced with reverse primers J529R (5′-CGCGGCTGCTGGCAC-3′) and rP2 (41). All sequences were about 400 bases long and were aligned manually with sequences in the SSU database of the Ribosomal Database Project (RDP) (21) based on primary- and secondary-structure considerations. The results obtained were compared to alignments obtained with Align Sequence, version 2.0, from the ARB sequence analysis software package (33). Phylogenetic relationships were inferred by using the neighbor-joining method (28) and the modified Jukes-Cantor algorithm (16, 42). The robustness of the final topology was tested with the tree-building methods PAUP (34) and fastDNAml (21). All phylogenetic assignments were made and phylogenetic trees were constructed within the ARB software package (33) by using version 5.0 of the RDP database (21). Only unambiguously aligned regions were used for the sequence analysis (Table 1).
TABLE 1.
Phylogenetic affiliations based on SSU rDNA genes of members of a Hawaiian rainforest soil bacterial communitya
| Phylotype | Relative abundance (%)b | Phylogenetic affiliation | Most closely related organism in RDP database
|
% Similarity to most closely related organism | |
|---|---|---|---|---|---|
| Taxon | RDP subdivision | ||||
| 35% G+C fraction | |||||
| HRS-1 | 6.8 | Clostridia and their relatives | [Clostridium tetani]c | Clostridium novyi subgroup | 80.6 |
| HRS-2 | 6.8 | Clostridia and their relatives | [Clostridium tetani] | Clostridium novyi subgroup | 76.1 |
| HRS-3 | 6.8 | Clostridia and their relatives | Clostridium fallax | Clostridium perfringens assemblage | 92.9 |
| HRS-4 | 6.8 | Clostridia and their relatives | Clostridium fallax | Clostridium perfringens assemblage | 94.0 |
| HRS-6 | 5.1 | Clostridia and their relatives | Clostridium puniceum | Clostridium butyricum subgroup | 95.3 |
| HRS-7 | 1.7 | Clostridia and their relatives | Clostridium butyricum | Clostridium butyricum subgroup | 94.7 |
| HRS-8 | 1.7 | Clostridia and their relatives | Clostridium puniceum | Clostridium butyricum subgroup | 98.0 |
| HRS-10 | 1.7 | Clostridia and their relatives | Clostridium beijerinckii | Clostridium butyricum subgroup | 98.5 |
| HRS-21 | 1.7 | Clostridia and their relatives | Clostridium puniceum | Clostridium butyricum subgroup | 98.5 |
| HRS-22 | 1.7 | Clostridia and their relatives | [Clostridium tetanomorphum] | Clostridium butyricum subgroup | 80.0 |
| 63% G+C fraction | |||||
| HRS-12 | 13.2 | Alpha purple bacteria | [Rhodopseudomonas viridis] | Rhizobium-Agrobacterium group | 82.6 |
| HRS-13 | 10.5 | Gamma purple bacteria | Pseudomonas syringae | Pseudomonas subgroup | 97.9 |
| HRS-16 | 7.9 | Alpha purple bacteria | Azospirillum lipoferum | Rhodospirillum rubrum assemblage | 88.0 |
| HRS-17 | 1.3 | Alpha purple bacteria | Zoogloea ramigera | Brucella assemblage | 90.4 |
| HRS-18 | 1.3 | Fibrobacter phylum | Environmental strain MC 103 | Acidobacterium subdivision | 93.2 |
| HRS-19 | 1.3 | Bacillus-Lactobacillus subdivision | [Bacillus flavothermus] | Bacillus megaterium group | 80.3 |
| HRS-20 | 1.3 | Delta purple bacteria | Environmental strain FIE 20 | Myxobacterium group | 92.9 |
Only unambiguously aligned regions were used in the analysis.
Relative abundance of clones belonging to a phylotype, calculated by dividing the number of clones belonging to the phylotype by the total number of clones analyzed.
Brackets indicate that the taxonomic assignment of the closest relative is uncertain (level of similarity, less than 85%).
To detect potential chimeric artifacts in the partial sequences of the 3′ end and the 5′ end, as well as the entire SSU rDNA gene, two strategies were used. The partial sequences that were around 400 bases long were (i) examined with the CHECK_CHIMERA program offered by RDP (21) and, for comparison, (ii) examined with the mglobalCHI program offered by the USC Computational Biology web site (17). To detect potential chimeric artifacts in a complete SSU rDNA gene, the phylogenies determined from the sequences of the 3′ ends and the 5′ ends were compared.
Nucleotide sequence accession numbers.
The sequence data for Hawaiian rainforest soil clones HRS-1 through HRS-23 have been deposited in the GenBank database under accession no. AF016514 to AF016533.
RESULTS
Soil analysis.
The chemical analysis of the soil revealed a composition quite typical for a very young soil compared to similar but older forest soils. The soil organic matter content was 3.1%, and the pH was 5.4. The soil nitrate N and ammonia N contents were determined to be 0.2 and 3.6 μg/g, respectively, while the total nitrogen content was 0.08%. The sand particles had sharp faces, which indicated that there had been little weathering and resulted in rapid water infiltration. The humic material had to be less than 200 years old, and hence its chemical structure was different than that of typical soil humic acid.
In this young tropical rainforest soil the C/N ratio (a measure of biological activity in soils) was 16:1 (compared with a global average of 14:1), suggesting that an active bacterial community was present. This assumption was supported by high leaf litter decomposition rates (37), as well as elevated in situ mineralization and nitrification rates (6). The cation exchange capacity was low (10.8 meq/100 g) due to primary minerals.
DNA extraction and purification.
Direct microscopic cell counts of soil smears before and after DNA extraction revealed a high lysis efficiency, 91% ± 3%. The lysis efficiency as estimated by DNA yield was also high; 6.4 μg of DNA/g (dry weight) of soil was recovered, compared to an expected DNA yield of 5.8 μg/g, which was calculated by multiplying the microscopic bacterial cell counts (1.6 × 10⁹ ± 0.3 × 10⁹ cells/g) by an average of 4 × 10⁻¹⁵ g of DNA cell−1 (9). Coextraction of humic material prevented PCR amplification of SSU rRNA genes if the standard purification protocol of Holben was used, probably because of the unusual nature of the young humic acids. Additional clean-up by preparative agarose gel electrophoresis and an additional series of washing steps in a centrifugal concentrator were needed to obtain DNA clean enough for reliable amplification of the bacterial SSU rRNA genes.
Community G+C profile.
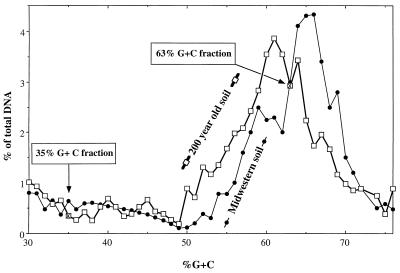
A profile of the community composition was obtained based on the amounts of DNAs having different G+C contents. The G+C contents of the majority of the soil DNA were in the range from 52 to 68% (Fig. 1); this included members of genera known to dominate soil bacterial communities, including the genera Agrobacterium (57 to 63% G+C), Alcaligenes (56 to 63% G+C), Arthrobacter (63 to 69% G+C), and Pseudomonas (58 to 66% G+C) (12). A rather consistent but minor quantity of DNA was found with G+C contents ranging from 30 to 50%, a range which is found in members of soil genera like Streptococcus (35 to 40% G+C), Clostridium (24 to 54% G+C), and Bacillus (32 to 69% G+C). Compared with the community profiles of midwestern agricultural soils, the main peak of the Hawaiian bacterial community profile was shifted toward a lower G+C content (by approximately 4% G+C) (Fig. 1).
FIG. 1.
Microbial community structure of a young rainforest soil determined by the G+C content of its DNA. The bacterial community profile of a mid-Michigan agricultural soil is included for comparison (12).
Phylotype abundance patterns.
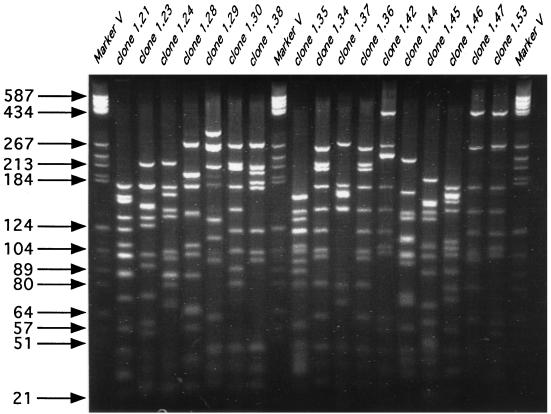
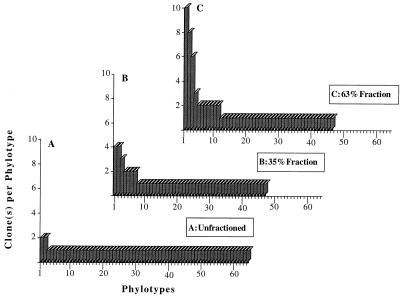
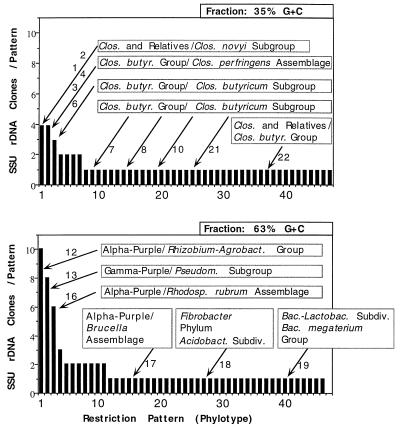
Agarose gel electrophoresis revealed a clean band of SSU rRNA genes selectively amplified from purified soil-extracted DNA. The clones were digested with restriction enzymes (amplified rDNA restriction analysis) (Fig. 2) and sorted by cluster analysis. Of the 81 clones obtained from unfractionated soil DNA that tested positive for alpha-complementation of β-galactosidase, 67 contained the 1.5-kb SSU rDNA insert. Primary restriction with HaeIII and HhaI resulted in 64 different restriction patterns (Fig. 2 and 3A), indicating that there was a high level of diversity. Clones with similar restriction patterns were not differentiated when the preparations were further digested with a combination of MspI and RsaI. The two patterns that were repeated each accounted for only 3% of all of the SSU rDNA clones, while the remaining 60 patterns were each represented by a single clone (Fig. 3A). In order to reduce this diversity to a more manageable level, two G+C content fractions (35 and 63% G+C fractions) of the whole community DNA were used in a similar analysis. We chose the 63% G+C fraction because it was located within the major peak of DNA abundance typically found in temperate region soils. The second fraction, the 35% G+C fraction, was chosen randomly to represent a portion of the minor members of the community (Fig. 1). Table 1 shows the relative abundance of selected clones as a measure of dominance relative to the entire clone library examined. The 63% G+C fraction produced 46 different patterns for the 76 clones examined (Fig. 3C). Eleven of these patterns were represented by two or more clones, which together accounted for 54% of the clones investigated. The three most dominant restriction patterns, patterns 1, 2, and 3, accounted for 13, 11, and 8%, respectively of the SSU rDNA inserts analyzed. The 35% G+C fraction produced 47 different patterns for the 59 clones examined (Fig. 3B). Only seven of these patterns were represented by two or more clones, and they accounted for 32% of the clones examined. The two most dominant patterns each represented 7% of the SSU rDNA insert diversity in this fraction. In both fractions together only two clones with similar restriction patterns were differentiated when the preparations were digested with the second restriction endonuclease pair, MspI plus RsaI.
FIG. 2.
Restriction patterns of amplified SSU rRNA clones in the 63% G+C fraction after restriction digestion with HaeIII and HhaI. Plasmid pBR322 digested with HaeIII (marker V) was used as a DNA size marker.
FIG. 3.
Frequency distribution of SSU rDNA gene phylotypes (restriction patterns) from the total soil DNA (A), the 35% G+C fraction (B), and the 63% G+C fraction (C) of a young Hawaiian soil. The profiles are based on results obtained after digestion with tetrameric restriction endonucleases HaeIII plus HhaI and MspI plus RsaI.
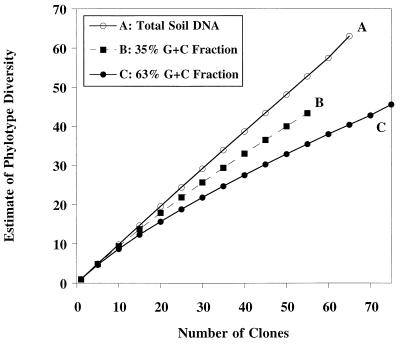
The quantitative effect of using a fraction of the community DNA instead of the total community DNA on the diversity of phylotypes was evaluated by rarefaction analysis. Given the species abundance distribution of a clone library, rarefaction gives estimates of the species richness of subsamples taken from it. This analysis verified that the unfractionated DNA contained too many phylotypes to reveal any structure but that fractionation of the DNA on the basis of G+C content did reduce the diversity to a level at which structures of dominance could be detected; the data also suggested that the phylotype sampling in the two fractions was far from complete (Fig. 4).
FIG. 4.
Rarefaction curves for the phylotypes found in total soil DNA and in the 35 and 63% G+C fractions of a Hawaiian soil. The expected numbers of phylotypes calculated from a random sample of individuals taken from the total population of phylotypes are shown on the y axis.
DGGE analysis.
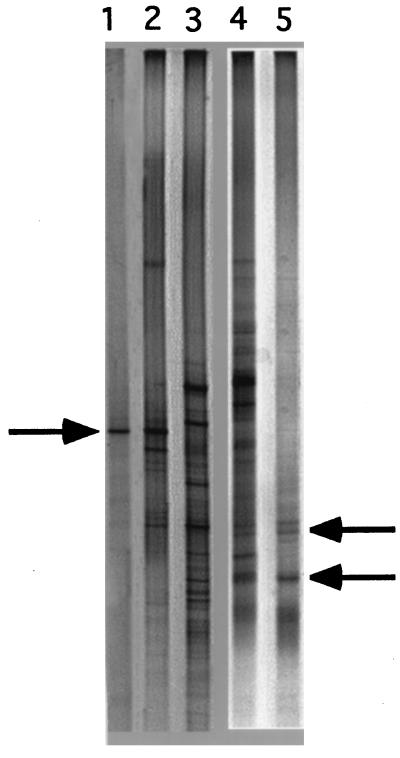
The abundance of particular SSU rDNA clones in our clone library may not represent the actual quantitative abundance of the clones in the soil sample due to a PCR or cloning bias. To assess this, we used DGGE to determine whether the dominant phylotypes in the clone library corresponded to well-represented phylotypes on DGGE gels of community DNA. Parallel analysis by DGGE of the two G+C fractions and dominant clones from the two fractions revealed that the intensely stained bands in the community DNA in each G+C fraction (indicating strong representation) corresponded to the bands obtained from the individual clones (Fig. 5). Even though phylogenetically unrelated strains can have bands with the same Rf value due to identical melting behavior of the SSU rDNA fragment, it is unlikely that a strain other than the one detected was both strongly represented and had the same Rf value.
FIG. 5.
DGGE analysis of SSU rDNA fragments (length, 434 bp) obtained after PCR amplification of the 35 and 63% G+C fractions of soil DNA and individual SSU rDNA clones from the clone libraries that were most frequent as determined by amplified rDNA restriction analysis. Lane 1, clone HRS-2 of the 35% G+C fraction; lane 2, 35% G+C fraction; lane 4, 63% G+C fraction; lane 5, clone HRS-12 of the 63% G+C fraction. Lane 3 contained a mixture of several bacterial genomic DNAs as a marker and positive control. The figure is a negative image of a silver-stained DGGE separation pattern. The arrows indicate dominant bands of well-represented clones, which were also found in the respective soil DNA fractions. PCR products obtained from some strains (lane 5) produced more than one band due to sequence heterogeneities of 16S rRNA operons (24).
Sequence analysis.
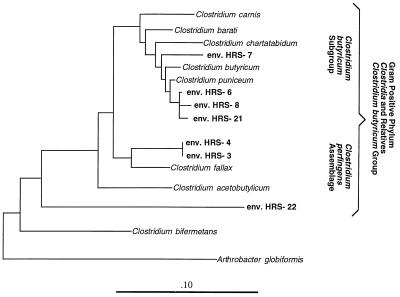
Two representative clones of the five dominant phylotypes from both abundance profiles (Fig. 3) and selected rare individuals were used for a partial sequencing and phylogenetic characterization analysis. This analysis revealed corresponding phylogenetic affiliations for clones belonging to the same phylotype (e.g., clones HRS-1 and HRS-2 and clones HRS-3 and HRS-4) (Table 1), although the clones varied somewhat in sequence similarity (not all matching pairs are shown in Table 1). Of the 23 clones sequenced, 20 were members of the domain Bacteria, while three clones were dismissed as possible chimeras. The phylogenetic affiliations and closest relatives in the RDP database are shown in Table 1. Figure 6 illustrates the phylogenetic relationships among some of the 35% G+C fraction clones. Several of the clostridial clones are closely related to each other. The phylogenetic affiliations of particular clones and their levels of abundance are summarized in Fig. 7. None of the clones exhibited an exact match with any of the SSU rDNA sequences found in the databases. In particular, clone HRS-18, which is related to the Acidobacterium subdivision, confirmed that novel taxa discovered previously in other molecular surveys of soil were present (20).
FIG. 6.
Phylogenetic relationships of the most closely related SSU rDNA clones from the 35% G+C fraction of the young Hawaiian soil used. Evolutionary distances were determined by maximum-likelihood analysis. Bar = 0.10 substitution per base position. env., environmental clone.
FIG. 7.
Phylogenetic affiliation of the dominant and rare phylotypes identified in phylotype abundance distribution profiles for the 35 and 63% G+C fractions of Hawaiian soil. The numbers indicate the designations of the clones that were analyzed (1, HRS-1; 2, HRS-2, etc.). Abbreviations: Clos., Clostridium; Clos. butyr., Clostridium butyricum; Agrobact., Agrobacterium; Pseudom., Pseudomonas; Rhodosp., Rhodospirillum; Acidobact. Subdiv., Acidobacterium subdivision; Bac.-Lactobac. Subdiv., Bacillus-Lactobacillus subdivision; Bac., Bacillus.
DISCUSSION
Geographic isolation, young age (200 years), constant climate, and low diversity of plant species did not reduce the microbial diversity in the soil studied to an extent that revealed more than two instances of resampling of the same eubacterial phylotype in a 70-clone library. Hence, the diversity was too great to reveal underlying community structure by this method. Similarly, Borneman et al. (4) found only 4% duplicates among 124 soil rDNA clones from an older continental soil. One approach to reduce complexity is to limit the study to only certain subsets of the community, an approach typically used by macroecologists. We attempted to do this by analyzing rDNA fractions having certain G+C contents since particular bacterial taxa have characteristic G+C contents. Clone libraries obtained from pooled DNA fractions (e.g., DNAs having G+C contents of 61 to 65%) still contained few repeated phylotypes (data not shown), but samples from one of these fractions (e.g., the 63% G+C fraction) contained more repeated phylotypes, indicating that more complete coverage of the rDNA types in this sample was obtained. Rarefaction analysis also indicated that there was reduced diversity in the individual G+C fractions compared to the total DNA, especially the 63% G+C fraction, but that rDNA diversity was far from exhausted in a 76-clone library of this fraction (Fig. 4). Hence, separation on the basis of G+C content revealed new diversity and provided evidence that soil rDNA diversity is much greater than the diversity that is revealed by eubacterial clone libraries of total community DNA. This estimate of greater soil rDNA diversity supports the high level of bacterial diversity estimated by Torsvik et al. (36) based on rates of soil DNA reannealing. The G+C content separation method also offers a way to enrich for rarer members of the community since DNAs having other G+C contents, especially DNAs of dominant types, can be removed by separating the DNAs into different fractions.
Dominance of phylotypes was observed in the 63% G+C fraction but not in the 35% fraction. This difference is consistent with the ecological prediction that the most dominant biomass (i.e., the 58 to 65% G+C fraction) reflects the most competitive organisms, which consist of fewer species (19). The lack of dominant phylotypes in the less successful fractions (e.g., the 35% G+C fraction) is consistent with the expectation that the diversity in the secondary populations is greater (14).
The nucleotide sequence analysis of the rDNA clones identified taxa that were expected for DNAs having G+C contents of 63 and 35%. Since G+C content is more conserved in the rrn operon than in the genome as a whole (39), the separation method must be driven primarily by the G+C content of the flanking DNA. The DNA fragments obtained by the DNA isolation method used were usually more than 20 kb long.
The aerobic bacteria most often cultured from soil (e.g., members of the genera Arthrobacter, Pseudomonas, and Burkholderia) have the same G+C contents as the most dominant biomass, as determined from the DNA data. Since only a low percentage of soil bacteria can be cultivated, these data suggest that the majority of the unculturable types must have DNA G+C contents of 55 to 68%, and hence these organisms are either close relatives of the typical culturable forms or are new types but have G+C contents in this range.
Finding a large diversity of clostridia in the 35% G+C fraction was initially unexpected since the site used is well drained with high aeration and porosity (Fig. 6). However, the high rainfall throughout the year and the young organic matter could provide anaerobic microsites for growth of the clostridial community (1), and bird feces is one of the most feasible inoculum sources for this group.
The microbial colonization of the young Hawaiian soil examined by very diverse phylotypes is not easily explained, especially considering the very high rDNA diversity in the G+C fractions. The geographic isolation of the Hawaiian Islands certainly limited colonization by plants (seed dispersal), insects, and other organisms, including humans (until 500 AD). Bacterial colonization of soil could have resulted from avian transport, including avian fecal introductions, from seawater spray, or from aerial transport. Aerial transport has been considered very inefficient due to poor microbial survival caused by long exposure to UV light, desiccation, and the likely fallout of any microbe-associated soil particles during transport from Asia (more than 10,000 km). Recently, however, sand grains from sandstorms in the Gobi Desert and loess plateau regions of central People’s Republic of China were tracked to Hawaii, even though the density and the size of the sand grains suggested that they should have been deposited long before they reached Hawaii (2, 15, 23). Regardless of the sources of bacterial colonization of Hawaiian soil, the soil communities appear to be unexpectedly complex, but this does not mean that they display the full complement of microbial types or diversity found in montane rainforest soils of continental environments.
Studies such as this one, performed by using PCR amplification of SSU rDNA genes from community-derived DNA, should never be assumed to be comprehensive because of well-known biases (17, 39). In particular, they are likely to reflect rrn operons that are more readily PCR amplifiable. Nevertheless, this study supports the notion that even young terrestrial environments exhibit enormous diversity and contain novel, uncultivated organisms.
ACKNOWLEDGMENTS
We thank T. Hattori and J. Urbance for comments on the manuscript and P. Lepp for instructions on use of the ARB software. We thank D. Harris for his introduction to the G+C fractionation technique and microscopic image analysis.
This work was supported by National Science Foundation grant DEB 9120006 to the Center for Microbial Ecology.
REFERENCES
- 1.Arah J R M, Smith K A. Anaerobic micro-environments in soil and the occurrence of anaerobic bacteria. In: Jensen V, Kjøller A, Sørensen L H, editors. Microbial communities in soil microbiology. London, England: Elsevier Applied Science Publishers; 1985. pp. 247–261. [Google Scholar]
- 2.Betzer P R, Carder K L, Duce R A, Merill J T, Tindale N W, Uematsu M, Costello D K, Young R W, Feely R A, Breland J A, Bernstein R E, Greco A M. Long-range transport of giant mineral aerosol particles. Nature. 1988;336:568–571. [Google Scholar]
- 3.Boivin-Jahns V, Bianchi A, Ruimy R, Garcin J, Daumas S, Christen R. Comparison of phenotypical and molecular methods for the identification of bacterial strains isolated from a deep subsurface environment. Appl Environ Microbiol. 1995;61:3400–3406. doi: 10.1128/aem.61.9.3400-3406.1995. [DOI] [PMC free article] [PubMed] [Google Scholar]
- 4.Borneman J, Skroch P W, O’Sullivan K M, Paulus J A, Rumjanek N G, Jansen J L, Nienhus J, Triplett E W. Molecular microbial diversity of an agricultural soil in Wisconsin. Appl Environ Microbiol. 1996;62:1935–1943. doi: 10.1128/aem.62.6.1935-1943.1996. [DOI] [PMC free article] [PubMed] [Google Scholar]
- 5.Carlquist S C. Hawaii, a natural history. Honolulu, Hawaii: Pacific Tropical Botanical Garden; 1980. [Google Scholar]
- 6.Crews T E, Kitayama K, Fownes J H, Riley R H, Herbert D A, Mueller-Dombois D, Vitousek P M. Changes in soil phosphorous fractions and ecosystem dynamics across a long chronosequence in Hawaii. Ecology. 1995;76:1407–1424. [Google Scholar]
- 7.D’Aquila R T, Bechtel L J, Videler J A, Eron J J, Gorczca P, Kaplan J C. Maximizing sensitivity and specificity of PCR by preamplification heating. Nucleic Acids Res. 1991;19:3749. doi: 10.1093/nar/19.13.3749. [DOI] [PMC free article] [PubMed] [Google Scholar]
- 8.Department of Geography, University of Hawaii. Atlas of Hawaii. 2nd ed. Honolulu: University of Hawaii Press; 1983. [Google Scholar]
- 9.Ellenbroek F M, Cappenberg T E. DNA synthesis and tritiated thymidine incorporation by heterotrophic freshwater bacteria in continuous culture. Appl Environ Microbiol. 1991;57:1675–1682. doi: 10.1128/aem.57.6.1675-1682.1991. [DOI] [PMC free article] [PubMed] [Google Scholar]
- 10.Giambelluca T W, Nullet M A, Schroeder T A. Rainfall atlas of Hawaii. Honolulu, Hawaii: Department of Land and Natural Resources; 1986. [Google Scholar]
- 11.Holben W E. Isolation and purification of bacterial DNA from soil. In: Weaver R W, et al., editors. Methods of soil analysis, part 2. Microbiological and biochemical properties. Soil Science Society of America Book Series no. 5. Madison, Wis: Soil Science Society of America; 1994. pp. 727–751. [Google Scholar]
- 12.Holben W E, Harris D. DNA-based monitoring of total bacterial community structure in environmental samples. Mol Ecol. 1995;4:627–631. doi: 10.1111/j.1365-294x.1995.tb00263.x. [DOI] [PubMed] [Google Scholar]
- 13.Hurlbert S H. The nonconcept of species diversity: a critique and alternative parameters. Ecology. 1971;52:577–586. doi: 10.2307/1934145. [DOI] [PubMed] [Google Scholar]
- 14.Huston M A. Biological diversity. Cambridge, United Kingdom: Cambridge University Press; 1994. [Google Scholar]
- 15.Jackson M L, Levelt T W M, Syers J K, Rex R W, Clayton R N, Sherman G D, Uehara G. Geomorphological relationships of tropospherically derived quartz in the soils of the Hawaiian Islands. Soil Sci Soc Am Proc. 1971;35:515–525. [Google Scholar]
- 16.Jukes T H, Cantor C R. Evolution of protein molecules. In: Munro H N, editor. Mammalian protein metabolism. New York, N.Y: Academic Press; 1969. pp. 21–132. [Google Scholar]
- 17.Komatsoulis G A, Waterman M S. A new computational method for detection of chimeric 16S rRNA artifacts generated by PCR amplification from mixed bacterial populations. Appl Environ Microbiol. 1997;63:2338–2346. doi: 10.1128/aem.63.6.2338-2346.1997. [DOI] [PMC free article] [PubMed] [Google Scholar]
- 18.Labarca C, Paigen K. A simple, rapid and sensitive DNA assay procedure. Anal Biochem. 1980;102:344–352. doi: 10.1016/0003-2697(80)90165-7. [DOI] [PubMed] [Google Scholar]
- 19.Levine S H. Competitive interactions in ecosystems. Am Nat. 1976;110:903–910. [Google Scholar]
- 20.Liesack W, Stackebrandt E. Occurrence of novel groups of the domain Bacteria as revealed by analysis of genetic material isolated from an Australian terrestrial environment. J Bacteriol. 1992;174:5072–5078. doi: 10.1128/jb.174.15.5072-5078.1992. [DOI] [PMC free article] [PubMed] [Google Scholar]
- 21.Maidak B L, Olsen G J, Larsen N, Overbeek R, McCaughey M J, Woese C R. The Ribosomal Database Project. Nucleic Acids Res. 1996;24:82–85. doi: 10.1093/nar/24.1.82. [DOI] [PMC free article] [PubMed] [Google Scholar]
- 22.Maniatis T, Fritsch E F, Sambrook J. Molecular cloning: a laboratory manual. Cold Spring Harbor, N.Y: Cold Spring Harbor Laboratory; 1982. [Google Scholar]
- 23.Merrill J T. Atmospheric long-range transport to the Pacific Ocean. In: Riley J P, Chester R, editors. Chemical oceanography. Vol. 10. New York, N.Y: Academic Press; 1989. pp. 15–50. [Google Scholar]
- 24.Muyzer G. Protocols for the DGGE. In: Smalla K, Muyzer G, editors. EU-Workshop on the Application of DGGE and TGGE in Microbial Ecology, Braunschweig, Germany. Braunschweig, Germany: Biologische Bundesanstalt für Land- und Forstwirtschaft; 1995. pp. 8–14. [Google Scholar]
- 25.Nannipieri P, Greco S, Ceccanti B. Ecological significance of the biological activity in soil. In: Bollag J-M, Stotzky G, editors. Soil biochemistry. Vol. 6. New York, N.Y: Marcel Dekker, Inc.; 1990. pp. 293–356. [Google Scholar]
- 26.Nübel U, Engelen B, Felske A, Snaidr J, Wieshuber A, Amann R I, Ludwig W, Backhaus H. Sequence heterogeneities of genes encoding 16S rRNAs in Paenibacillus polymyxa detected by temperature gradient gel electrophoresis. J Bacteriol. 1996;178:5636–5643. doi: 10.1128/jb.178.19.5636-5643.1996. [DOI] [PMC free article] [PubMed] [Google Scholar]
- 27.Peck T R, Megel D, Eik K, Whitney D A, Warncke D, Munter R C, Brown J R, Knudsen D, Dahnke W C, Eckert D J, Beegle D, Fixen P E, Schulte E E. Recommended chemical soil test procedure for the north central region. Fargo: North Dakota Agricultural Experiment Station, North Dakota State University; 1988. [Google Scholar]
- 28.Saitou N, Nei M. The neighbor-joining method: a new method for reconstructing phylogenetic trees. Mol Biol Evol. 1987;4:406–425. doi: 10.1093/oxfordjournals.molbev.a040454. [DOI] [PubMed] [Google Scholar]
- 29.Schmidt T M, Pace B, Pace N R. Detection of DNA contamination in Taq polymerase. BioTechniques. 1991;11:176–177. [PubMed] [Google Scholar]
- 30.Simberloff D. Use of rarefaction and related methods in ecology. In: Dickson K L, Cairns J Jr, Livingston R J, editors. Biological data in water pollution assessment: quantitative and statistical analyses. West Conshohocken, Pa: American Society for Testing and Materials; 1978. pp. 150–165. [Google Scholar]
- 31.Soil Survey Staff. Soil survey of the islands of Kauai, Oahu, Maui, Molokai, and Lanai, state of Hawaii. Washington, D.C: U.S. Government Printing Office; 1972. [Google Scholar]
- 32.Sørheim R, Torsvik V L, Goksøyr J. Phenotypical divergences between populations of soil bacteria isolated on different media. Microb Ecol. 1989;17:181–192. doi: 10.1007/BF02011852. [DOI] [PubMed] [Google Scholar]
- 33.Strunk, O., O. Gross, B. Reichel, M. May, S. Hermann, N. Stuckmann, B. Nonhoff, M. Lenke, A. Ginhart, T. Ludwig, A. Bode, K.-H. Schleifer, and W. Ludwig. Arb: a software environment for sequence data. Nucleic Acids Res., in press. [DOI] [PMC free article] [PubMed]
- 34.Swofford D L. PAUP: phylogenetic analysis using parsimony, version 3.0. Champaign: Illinois Natural History Survey; 1990. [Google Scholar]
- 35.Tiedje J M, Zhou J-Z, Nüsslein K, Moyer C L, Fulthorpe R R. Extent and patterns of soil microbial diversity. In: Martins M T, et al., editors. Progress in microbial ecology. Sao Paulo, Brazil: Brazilian Society for Microbiology; 1997. pp. 35–41. [Google Scholar]
- 36.Torsvik V, Goksøyr J, Daae F L. High diversity in DNA of soil bacteria. Appl Environ Microbiol. 1990;56:782–787. doi: 10.1128/aem.56.3.782-787.1990. [DOI] [PMC free article] [PubMed] [Google Scholar]
- 37.Vitousek P M, Turner D R, Kitayama K. Foliar nutrients during long-term soil development in Hawaiian montane rain forest. Ecology. 1995;76:712–720. [Google Scholar]
- 38.Ward D M, Bateson M M, Weller R, Ruff-Roberts A L. 16S rRNA sequences reveal numerous microorganisms in a natural community. Nature. 1990;345:63–65. doi: 10.1038/345063a0. [DOI] [PubMed] [Google Scholar]
- 39.Ward D M, Bateson M M, Weller R, Ruff-Roberts A L. Ribosomal RNA analysis of microorganisms as they occur in nature. In: Marshall K C, editor. Advances in microbial ecology. Vol. 12. New York, N.Y: Plenum Press; 1992. pp. 219–286. [Google Scholar]
- 40.Weisblum B, Haenssler E. Fluorometric properties of the bisbenzimidazole derivative Hoechst 33258, a fluorescent probe specific for AT concentration in chromosomal DNA. Chromosoma. 1974;46:255–260. doi: 10.1007/BF00284881. [DOI] [PubMed] [Google Scholar]
- 41.Weisburg W G, Barns S M, Pelletier D A, Lane D J. 16S ribosomal DNA amplification for phylogenetic study. J Bacteriol. 1991;173:697–703. doi: 10.1128/jb.173.2.697-703.1991. [DOI] [PMC free article] [PubMed] [Google Scholar]
- 42.Weisburg W G, Tully J G, Rose D L, Petzel J P, Oyaizu H, Yang D, Mandelco L, Sechrest J, Lawrence T G, Van Etten J, Maniloff J, Woese C R. A phylogenetic analysis of the mycoplasmas: basis for their classification. J Bacteriol. 1989;171:6455–6467. doi: 10.1128/jb.171.12.6455-6467.1989. [DOI] [PMC free article] [PubMed] [Google Scholar]
- 43.Zhou J, Bruns M A, Tiedje J M. Rapid method for the recovery of DNA from soils of diverse composition. Appl Environ Microbiol. 1996;62:316–322. doi: 10.1128/aem.62.2.316-322.1996. [DOI] [PMC free article] [PubMed] [Google Scholar]
- 44.Zhou J, Davey M E, Figueras J B, Rivkina E, Gilichinsky D, Tiedje J M. Phylogenetic diversity of a bacterial community determined from Siberian tundra soil DNA. Microbiology. 1997;143:3913–3919. doi: 10.1099/00221287-143-12-3913. [DOI] [PubMed] [Google Scholar]


