

Abstract
Background
Preserving and enhancing mobility is an important part of healthy ageing. Life-space mobility is a construct that captures actual mobility within the home and the community. The objective of this systematic review was to synthesise the measurement properties and interpretability of scores produced by life-space mobility measures in community-dwelling older adults.
Methods
This systematic review followed Consensus-based Standards for the selection of health Measurement Instruments (COSMIN). Multiple databases were searched to identify potentially relevant articles. Data extraction and assessment of methodological quality was conducted by two independent reviewers. When possible, results were quantitatively pooled for each measurement property. If studies could not be combined quantitatively, then findings were summarised qualitatively using means and percentage of confirmed hypothesis. Synthesised results were assessed against the COSMIN criteria for good measurement properties.
Results
A total of 21 full text articles were included in the review. The University of Alabama at Birmingham Study of Aging Life-Space Assessment (LSA) was the most evaluated life-space mobility measure. The LSA demonstrated content validity, internal consistency (Cronbach’s alpha 0.80–0.92), reliability [intra-class correlation value 0.89 (95% confidence interval (CI): 0.80, 0.94)] and convergent validity with measures of physical function in community-dwelling older adults.
Conclusion
This systematic review summarised the measurement properties of life-space mobility measures in community-dwelling older adults following COSMIN guidelines. The LSA has been translated into multiple languages and has sufficient measurement properties for assessing life-space mobility among community-dwelling older adults.
Keywords: mobility, life-space, measurement properties, older people
Key Points
This systematic review synthesised the measurement properties of life-space mobility measures in community-dwelling older adults.
The University of Alabama at Birmingham Study of Aging Life-Space Assessment (LSA) was the most evaluated life-space mobility measure.
Scores produced by the LSA demonstrated evidence of reliability and validity in community-dwelling older adults.
Introduction
The United Nations Decade of Healthy Ageing (2021–2030) calls for strengthening measurements for monitoring the healthy ageing and well-being of older people [1]. Preserving and enhancing mobility is an important outcome for healthy ageing policies, action plans, strategies and programmes [2]. Mobility, as described by the World Health Organization (WHO), is movement in all its forms, powered by the body or a vehicle [2]. Life-space mobility is a construct that refers to the movement of a person within their environment, extending from their home to the community and beyond [3–5]. A recent commentary presents a framework for comprehensive mobility measurement [6]. Within this framework, an older person’s ability to be mobile is made up of their perceived mobility ability (e.g. self-reported difficulty with walking) and their actual mobility performance in daily life (e.g. measures of counts or frequency of mobility activities). Life-space mobility measures make up the latter facet of mobility because they consider the spaces one visits in everyday life and the frequency of these visits over a specific time period [3]. These measures of actual or real-world mobility are gaining increased attention as an important indicator of healthy ageing.
Existing measures of life-space mobility include the Nursing Home Life-Space Diameter (NHLSD) [7], the Life Space Questionnaire (LSQ) [5] and the University of Alabama at Birmingham Study of Aging Life-Space Assessment (LSA) [8]. The NHLSD was developed for use in nursing homes, whereas the LSQ and LSA were developed for use in community-dwelling older adults. The LSQ asks about the life-space areas respondents visited over the past 3 days. The LSA asks about life-space areas visited during the past month, the frequency of these visits and if assistance was needed [8].
Although previous reviews have been published on life-space mobility measures, one was a narrative review [9] and the other focused on the use of these measures in the German language and included institutionalised settings [10]. The WHO is currently developing a measurement and evaluation framework for healthy ageing, which will include indicators for, and measurement of, functional ability. Within this framework, the ‘ability to be mobile’ is described as a key domain of functional ability—one of the three main components of healthy ageing. In another review [11], we summarised the psychometric properties of perceived measures of mobility ability. In this paper, we consider the psychometric properties of life-space mobility measures that reflect actual real-life mobility. The objective of this systematic review was to synthesise the measurement properties and interpretability of scores produced by life-space mobility measures, namely, the NHLSD, LSQ and LSA, in community-dwelling older adults.
Methods
This systematic review followed COnsensus-based Standards for the selection of health Measurement INstruments (COSMIN) methodology for conducting systematic reviews of psychometric properties [12] and the Preferred Reporting Items for Systematic Reviews and Meta-Analyses (PRISMA) statement [13]. The protocol for this systematic review has been published [14].
Criteria for considering studies for this review
Studies were included if they met the criteria listed below.
Population
Community-dwelling older adults aged 60 years of age or over. Studies were also included if the mean sample age was above 60 years or at least 50% of the sample was aged 60 years or over, or results were reported separately for persons aged 60 years or over. Older adults living in the community with chronic or neurological conditions were included.
Construct
The construct of interest was life-space mobility, which is an individual’s movement across environments starting from the home and extending to the world around them [3, 4, 5, 14].
Instruments
A preliminary search of life-space mobility measures and consultation with experts identified three main self-report measures that have been commonly used in older adults: the NHLSD, LSQ and LSA. These three measures and their modified versions were the focus of this review. The NHSLD was included if it had been adapted or used in community-dwelling older adults.
Outcomes
All psychometric properties were included [12]. Data on interpretability and feasibility were also extracted. Content validity of included measures was also evaluated [15].
Type of studies
Studies whose primary aim was to evaluate the measurement properties of life-space mobility measures were included in the review. Studies were not excluded based on design; all study designs were included. Grey literature and review articles were excluded.
Language
Only studies published in English were included.
Search methods
MEDLINE (Ovid), Embase (Ovid) PsycINFO (Ovid) and CINAHL (EBSCO) were searched up to June 2021 with the terms ‘life-space’ or ‘life space’ to identify potentially relevant articles. The reference list of the included studies was also checked to ensure that any other potentially relevant studies were not missed.
Data collection and analysis
Selection of studies
Two reviewers independently screened all the titles and abstracts. Studies that met the inclusion criteria were kept for full text-review. Two reviewers then independently reviewed the full-text articles and assessed their eligibility for inclusion. Those that met inclusion criteria were retained for further review.
Data extraction and management
Data extraction and assessment of methodological quality was conducted by two independent reviewers, and any disagreements between the reviewers were resolved by discussion with a third reviewer. The software Covidence [16] was used to import the references from the databases, screen titles and abstracts, and identify full text articles.
Assessment of content validity
The content validity of measures was evaluated following the steps outlined in the COSMIN manual for evaluating the content validity of patient-reported outcome measures [15].
Assessment of methodological quality
Assessment of methodological quality was performed using the COSMIN Risk of Bias (ROB) checklist (Box 3–10). Each measurement property from each study was rated as ‘very good’, ‘adequate’, ‘doubtful’ or ‘inadequate’. Furthermore, each measurement property from included studies was rated according to COSMIN’s criteria for good measurement properties (Appendix A). Each measurement property per study was rated as sufficient (+), insufficient (−) or indeterminate (?). When construct validity was assessed using correlation coefficient values, we hypothesised correlations ≥0.50 for measures capturing similar constructs; ≥0.30 for measures capturing related but distinct constructs; and <0.30 for unrelated constructs. For related but distinct constructs, although we expected a minimum correlation of 0.30, we did not specify an upper limit as the maximum correlation could vary. The direction of the correlations (+/−) was based on the underlying measurement scale of the instrument.
Statistical analysis and data synthesis
For content validity, individual ratings were summarised to determine an overall rating for content validity as sufficient (+), insufficient (−) or inconsistent (±). When possible, study results were pooled for each measurement property with forest plots. A random-effects model with transformation of coefficients was used for the analysis [17]. If considerable heterogeneity was present (I2 value > 75%), subgroup analysis using a random-effects model was conducted by study location (country), participant characteristics (average age, average number of comorbidities) and study quality (risk of bias). If studies could not be combined quantitatively, then findings were summarised qualitatively using means and percentage of confirmed hypothesis. All synthesised results were assessed against the COSMIN criteria for good measurement properties to determine a rating of sufficient (+), insufficient (−), inconsistent (±) or indeterminate (?). Results were sufficient if ≥75% of hypotheses were met and insufficient if ≥75% were not met. Inconsistent results were centred on ≥50% of ratings.
Summary of the evidence and grading the evidence quality
COSMIN’s modified Grading of Recommendations Assessment and Development and Evaluation (GRADE) approach (Appendix B) was used to evaluate the quality of the pooled evidence per measurement property. Two independent reviewers graded the quality of the evidence, and any disagreements between the reviewers were resolved by discussion with a third reviewer. The evidence was graded as high, moderate, low or very low taking into consideration the following four factors: ROB, inconsistency, indirectness and imprecision [12]. For content validity studies, only ROB, inconsistency and indirectness were considered.
Results
Study selection
From the four databases, 2,362 records were obtained and after removing duplicates, 1,489 records were screened. Sixty-eight full-text articles were reviewed, of which 48 were excluded (Figure 1). A total of 20 articles were included from the databases searched. Upon examination of the reference list for the included articles, an additional article was included, for a final total of 21 articles.
Figure 1.
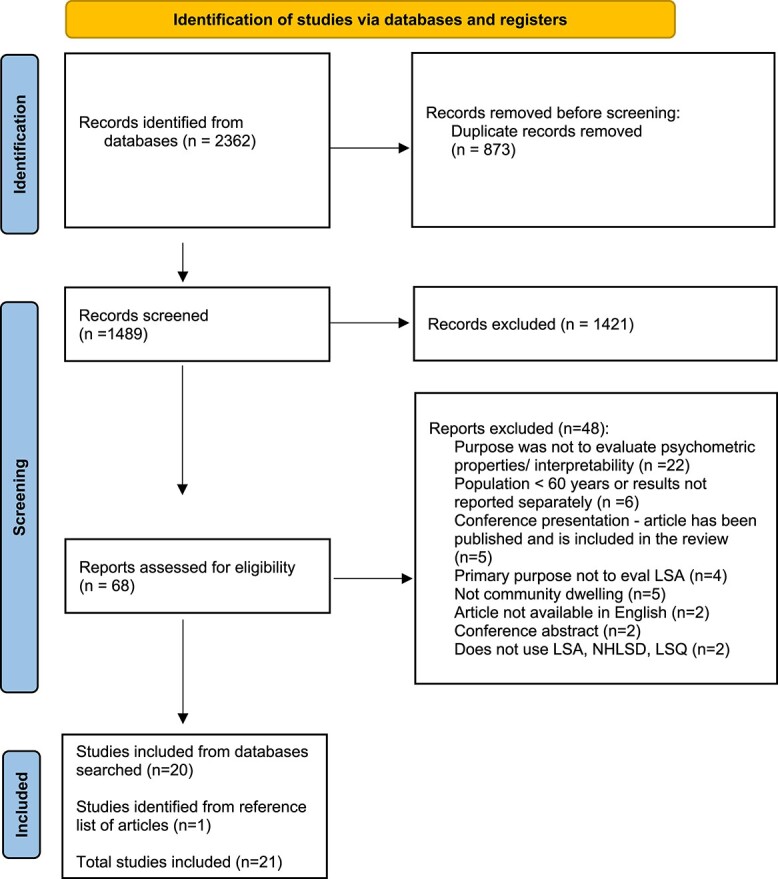
Flow diagram outlining study selection process [13].
Life-space mobility measures
Four measures emerged from the review: the LSA, a modified version of the LSA, the LSQ and a modified version of the LSQ. There were no studies that reported on the NHLSD in community-dwelling older adults. A description of the measures can be found in Appendix C. Seventeen out of the 21 articles evaluated the psychometric properties or the interpretability of the LSA composite score (LSA-C). Three articles assessed the modified LSA, one assessed the LSQ and one assessed the modified LSQ (Table 1).
Table 1.
Study characteristics, interpretability and feasibility of the included life-space mobility measures
| Author (year) | Measures assessed | Country | Sample size | Properties assessed | Mean Age (SD) | % Females | Population | Mean life space score | Change scores | Cut-off scores | Floor/ceiling effects | Completion time | Completion rate (for longitudinal studies) | Other interpretability findings |
|---|---|---|---|---|---|---|---|---|---|---|---|---|---|---|
| Ullrich et al. (2021) | Modified LSA-C; Modified LSA-E, LSA-I, LSA-M (German) |
Germany | 65 for convergent validity; 55 for reliability; 32 for responsiveness | Reliability; convergent validity; responsiveness; interpretability | 81.4 ± 5.9 | 72.3 | Older persons without cognitive impairment | Modified LSA-C scores ranged between 4.5 and 70 | Ceiling effect for LSA-M with 35.4% of participants reaching the maximal; floor effect for LSA-I with 47.7% reaching the lowest possible score. | 4.1 ± 2.1 minutes (range 1–10 minutes) | 100% completion rate after 12-weeks | |||
| Tseng et al. (2020) | LSA (Chinese) | Northern Taiwan | 225 (40 for reliability); For content validity: 5 professionals | Reliability; convergent validity; content validity | 72.60 (6.57) | 70.70 | 65 or older; living in the community; normal cognitive function | 69.74 (16.02) | ||||||
| McCrone et al. (2019) | LSA | UK | 276 for known groups; 273 for convergent validity; 228 for responsiveness | Convergent validity; known-groups validity; responsiveness | Median (range): 80.5 (25–99) | 73.6 | Community-dwelling, newly referred from outpatients; domiciliary, non-hospitalised; and domiciliary, recent hospital discharge | Median (range):20 (4–92) | Mean change between PT appointment and discharge appointment (avg: 8 weeks): 10.5 points (95% CI = 8.3–12.8) | 82.6% had both assessment s completed (median time of 53 days) | ||||
| Ullrich et al. (2019) | Modified LSA-C; Modified LSA-E, LSA-I, LSA-M (german) |
Germany | 117 for convergent validity; 102 for reliability; 53 for responsiveness | Reliability; convergent validity; responsiveness; interpretability | 82.3 (6.0) | 76.3 | Older persons with mild to moderate cognitive impairment discharged from geriatric rehabilitation | Modified LSA-C: 29.7 (15.4); LSA-E: 2.8 (1.4); LSA-I: 1.4 (1.6); LSA-M: 4.1 (1.1) (n = 102) |
LSA-M: ceiling effect, with 29.9% obtaining the maximum score. LSA-I: floor effect with 49.6% obtaining the minimum score | Mean completion time (SD) to assess the Modified LSA-C was 4.1 (2.2) min. | 100% completion rate after 12 weeks | |||
| Ullrich et al. (2019) | Modified LSA-C; (German) | Germany | 118 total sample; 108 for cut-off calculation | Interpretability | 82.3 (6.0) | 76.3 | Older persons with mild to moderate cognitive impairment discharged home from geriatric rehabilitation | Modified LSA -C: 23.9 (13.2) | Modified LSA -C = 26.75 for differentiating people with low and high life-space mobility | |||||
| Kennedy et al. (2018) | LSA | USA | 412 | Interpretability | 81.7 (4.77) | 57.3 | Adults 75 years and older participating in a longitudinal epidemiological study across the state of Alabama | 64.6 (25.2) | MIC (improvement in walking status) = 2.5 points (95% CI = 1.3–3.8 points). MIC (decline) = 2.9 points (95% CI = 1.7–4.2 points). Effect size = 0.4; SRM = 1 | |||||
| Garcia et al. (2018) | LSA (Brazilian version) | Brazil | 62 | Internal consistency; reliability; measurement error; convergent validity; interpretability | 65 (range: 62–71) | 39 | Older adults with chronic obstructive pulmonary disease, in São Paulo, Brazil | Baseline: 62 (52–80) | 90% MDC = 0.2 points | |||||
| Simoes et al. (2018) | LSA (Brazilian-Portuguese) | Brazil | 80; For content validity: 10 professionals +30 participants | Internal consistency; reliability; measurement error; convergent validity; interpretability; content validity | 70.04 (8.6) | 61 | Brazilian community-dwelling older adults age ≥ 60 years | 52.86 (23.52) | 90% MDC = 0.36 points | |||||
| Yang et al. (2017) | LSA (Korean) | Korea | 34 | Reliability; convergent validity | 65.11(2.39) | 41.18 | Stroke patients receiving outpatient rehabilitation treatment | 42.29 (3.68) | ||||||
| Fristedt et al. (2016) | LSA-C, LSA-E, LSA-I, LSA-M | Sweden | 312 | Convergent validity | 80 (5) | 53 | General older population in Sweden | LSA-C = 65 (23); LSA-E median and IQR = 5 (4–5); LSA-I median and IQR(Q1-Q3) = 4 (2–5); LSA-M median and IQR = 5 (5–5) | ||||||
| Portegijs et al. (2016) | LSA | Finland | Baseline: 848; longitudinal: 755 | Convergent validity; predictive validity; interpretability | Median: 80.4 (IQR 7.4) | 62 | 75- to 90-year-old community-dwelling people living in Central Finland. | Median baseline score = 64 (IQR 30.4) | Decline >11.7 identified those who developed ADL inability over 2 years | LSA = 52.25 for identifying participants who developed ADL inability over 2 years | ||||
| Ji et al. (2015) | LSA (Chinese) | China | 100 (40 for reliability) | Reliability; convergent validity | 72.23 (5.05) | 50 | Older adults’ health records | 71.87 (20.24) | ||||||
| Cavanaugh et al. (2014) | LSA | USA | 40 | / | 80.7 (7.5) | 55 | Community-dwelling older adult and his or her close companion | 71.1 (95% CI = 61.8–80.3) | Self-report vs proxy version: ICC (1,1) = 0.88; 95% CI = 0.79–0.94; P < 0.001.) | |||||
| Portegijs et al. (2014) | LSA-C, LSA-E, LSA-I, LSA-M (Finnish) | Finland | 1-year: 808; Reliability: 39 | Reliability; measurement error; responsiveness | 80.6 (4.2) | / | Community-dwelling older people aged 75#90; living in central Finland | median (IQR) = 64 (3) | LSA-M: ceiling effects: 52%; LSA-I: ceiling effects: 44%; LSA-E: ceiling effects: 48% | 95.28% at 1 year follow-up | ||||
| Curcio et al. (2013) | LSA-C, LSA-E, LSA-I, LSA-M (Spanish and Portuguese) | Colombia and Brazil | 300 (39 for reliability) | Reliability; convergent validity | Colombia: 69.1 (6.4); Brazil: 69.6 (3.0); | 50 | Community-dwelling older adults (65–74 years of age) | Colombia: LSA-C = 51.85 (19.01); LSA-E = 3.96 (1.03); LSA-I = 3.80 (1.14); LSA-M = 4.16 (0.75) Brazil: LSA-C = 59.61 (17.75); LSA-E = 4.37 (0.82); LSA-I = 4.32 (0.91); LSA-M = 4.44 (0.69) | ||||||
| Shimada et al. (2010) | LSA (Japanese) | Japan | Baseline: 2404; longitudinal: 436 | Predictive validity; convergent validity; interpretability | Cross-sectional: 78.8(7.0); Longitudinal: 79.2(6.8) | Cross-sectional: 71.5; longitudinal: 72.5 | All participants used preventive health care services provided by the Japanese long-term care insurance system. | Cross-sectional: 56.2 (28.1); longitudinal: 47.3 (20.1) | Cut points of IADLs limitation: 56 points using Youden index | |||||
| Auger et al. (2009) | LSA-C, LSA-E, LSA-I, LSA-M (French) | Canada | 40 | Reliability; content validity | 65 (10) | 57.5 | ≥ 50 who obtained a power motor device from a subsidised program | LSA-C = 25 (14); LSA-E = 1.8 (1.5); LSA-I = 0.2 (0.5); LSA-M = 3.8 (1.2) | Telephone version: 3–18 min (mean + SD: 9.2 + 3.9) | |||||
| Kammerlind et al. (2009) | LSA-C; LSA-E, LSA-I, LSA-M (Swedish) | Sweden | 298 | Reliability; measurement error; interpretability | 80 (5) | 51 | Older persons in Sweden | LSA-C = 65.1 (22.4); LSA-E median (IQR) = 5.0 (4.0–5.0); LSA-I median (IQR): 4.5 (2.0–5.0); LSA-M median (IQR) = 5.0 (5.0–5.0) | LSA-C = 50% ceiling effect; LSA-E: 59% ceiling effect; LSA-I: 15% floor effect; LS-M: =79% ceiling effect | |||||
| Barnes et al. (2007) | LSQ -modified (0–6 levels) | USA | 909 | Convergent validity | 80.89 (7.14) | 74.6 | Participants from retirement communities and subsidised housing facilities in and around the Chicago metropolitan area. | 60.28% had a level 6 score (outside of town) | ||||||
| Baker et al. (2003) | LSA-C, LSA-E, LSA-I, LSA-M | USA | 306 | Reliability; convergent validity | 75.07(6.8) | 54 | Medicare beneficiaries aged 65 and older living in central Alabama | LSA-C: 62.9 (24.7); LSA-E: 4.1(1.1); LSA-I: 3.5(1.8); LSA-M: 4.6(0.7) | LSA-C showed at least a 10-point change for 50% of subjects (39% decreased and 11% increased) over 6 months | |||||
| Stalvey et al. (1999) | LSQ | USA | 242 (200 for reliability) | Reliability; measurement error; convergent validity | 27% age 55–64, 51% age 65–74 and 22% age 75–85 | 44 | Older adults were recruited from eye care clinics in Alabama | 6 (1.4) | 83% had their 2nd assessment completed (test-retest at 1-year) |
CI, confidence interval; LSA, Life-Space Assessment; LSA-C, Life-Space Assessment-Composite; LSA-E, Life-Space Assessment-Equipment; LSA-M, Life-Space Assessment-Maximal; LSA-I, Life-Space Assessment-Independent; LSQ, Life-Space Questionnaire; MID, minimal important change; SD, standard deviation.
Study characteristics
The included studies had a large range in sample size, ranging from 32 [18] to 2,404 [19] participants (Table 1). The included studies were conducted in Canada [20], Sweden [21, 22], United States [5, 8, 23–25], Finland [26, 27], Brazil [28–30], Korea [31], Colombia [30], China [32], Japan [19], United Kingdom [33], Northern Taiwan [34] and Germany [18, 35, 36].
Measurement properties
Table 2 outlines the summary of findings for each measurement property and its quality of evidence for the LSA-C. Summary of findings tables can be found in Appendix D for the LSA subscales, the LSQ and the modified versions of these measures. Appendix E gives an overview of GRADE for each property, for each measure. Results of each study and their ratings (ROB and criteria for good measurement properties) can be found in Appendix F.
Table 2.
Summary of findings table for the LSA-composite
| Property | # of tests/hypotheses | Summary or pooled result | Overall rating | Quality of evidence |
|---|---|---|---|---|
| Internal consistency | 2 | 100% of hypotheses were confirmed; Cronbach alpha: 0.8–0.92 | Sufficient | High |
| Reliability | 10 | 100% of hypotheses were confirmed; asee forest plot; overall ICC = 0.89 (0.80–0.94) | Sufficient | High |
| Measurement error | 3 | 0% of hypotheses were confirmed; SEM ranges from 4.12 to 9.1 | Insufficient | High |
| Content validity | 3 | 86% of items of the French version corresponded to the original version; LSA explains its conceptual model and administration instructions, and no professional made considerations or had concerns about the concept of life-space mobility; the item-level content validity index (assess relevancy of items) was 1.00 and the scale level was 0.86 for the LSA-C scale | Sufficient | Moderatea |
| Predictive validity | 2 | 100% of hypotheses were confirmed; able to identify those with declines in ADLs/IADLs | Sufficient | High |
| Convergent validity | 36 | 78% of hypotheses were confirmed; asee forest plots. Overall correlation with IADL: 0.53 (0.38–0.66); with GDS: −0.51 (−0.63- (−0.36)) | Sufficient | High |
| Known-groups validity | 3 | 67% of hypotheses were confirmed | Sufficient; inconsistent | Very lowb |
| Responsiveness | 4 | 50% of hypotheses were confirmed | Sufficient; inconsistent | Moderatec |
ADL, Activities of Daily Living; IADL, Instrumental Activities of Daily Living; GDS, Geriatric Depression Scale; ICC, intraclass correlation coefficient; SEM, standard error of measurement.
aOnly considers risk of bias, inconsistency and indirectness in GRADE. No issues with inconsistency and indirectness were found. There was at least one doubtful rating, therefore downgraded to moderate quality of evidence.
bVery serious risk of bias and serious inconsistency
cSerious inconsistency
Content validity
Three studies reported on the content validity of the LSA.
Simoes et al. asked 10 professionals and 30 older adults about the questionnaire’s comprehensiveness, and they reported no concerns with the LSA reflecting its conceptual model, its administration instructions or the concept of life-space mobility [28]. Tseng et al. administered a 4-point item-level and scale-level content validity index to five professionals to assess relevancy and reported good content validity [34]. Auger et al. evaluated the content validity of the French version of the LSA and reported that 86% of items corresponded to the English version [20]. The relevance, comprehensiveness and comprehensibility of the LSA was met according to the reviewers and the three studies.
When examining the development of the LSA [3], relevance of the LSA was rated as sufficient, and comprehensiveness and comprehensibility were rated as insufficient as concept elicitation and cognitive interviewing were not performed. However, as content validation studies provide more current, robust evidence, overall ratings for the LSA were sufficient. Moderate quality of evidence was found as there were doubtful ratings for ROB, mainly due to a lack of information on how the studies were conducted.
The content validity of the LSQ was assessed by examining the development study by Stalvey et al. [5] and reviewer ratings. Although reviewers rated the relevance, comprehensiveness and comprehensibility of the LSQ as sufficient, Stalvey et al. did not report on concept elicitation or cognitive interviewing, causing comprehensiveness and comprehensibility to receive an insufficient rating. Therefore, the overall quality of evidence of the LSQ was rated as very low due to inconsistent ratings, a lack of content validation studies and indirectness from the population (i.e. population from single site; an eye care clinic).
A content validity analysis on the modified versions of the LSQ and LSA were performed using the papers on the development of the original versions, the development of the modified versions and reviewer ratings. Similar to the original versions, overall quality of evidence was moderate for the modified version of the LSA and very low for the modified version of the LSQ.
Internal consistency
Two studies [28, 29] evaluated the internal consistency of the LSA and reported Cronbach’s alphas of 0.80 and 0.92. Both had very good ROB ratings and the overall quality of evidence was high (Table 2).
Reliability
Twelve studies [8, 18, 20, 22, 27–32, 34, 35] evaluated the test-retest reliability of the LSA or its modified version, and one study [5] evaluated the test-retest reliability of the LSQ (Appendix F). The second administration of the test occurred between 2 days and 2 weeks for the LSA and its subscales and 1 year for the LSQ. A pooled intraclass correlation coefficient (ICC) value of 0.89 (95% confidence interval (CI): 0.80, 0.94) was obtained for the LSA-C (Figure 2). The I2 value for the pooled results was 95%; therefore, subgroup analysis was performed by risk of bias and mean age. The sub-group analysis was statistically significant for risk of bias (P = 0.02) but not for mean age (P = 0.48). The forest plots for these analyses are presented in Appendix G. Sub-group analysis by country was not performed, as this variable could not be categorised into groups. Subgroup analysis by average number of comorbidities could also not be assessed because this information was not included in a number of studies.
Figure 2.
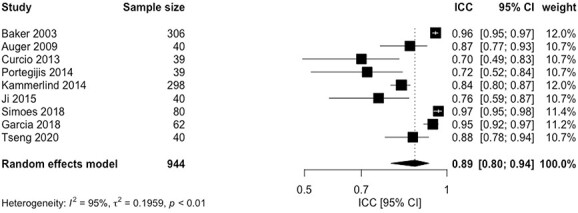
Forest plot intraclass correlation coefficient values.
For the LSA subscales, ICC values ranged from 0.37 to 0.86 for life-space with equipment (LSA-E), 0.63–0.94 for independent life-space (LSA-I) and 0.49–0.81 for maximum life-space (LSA-M). A weighted kappa of 0.80 was reported for the LSQ (Appendix F). The overall quality of evidence for the LSA-C score was high, whereas the LSA subscales had very low to low qualities of evidence with very serious ROBs (i.e. multiple studies of inadequate quality or one study of doubtful). The LSQ had very low quality of evidence as there was extremely serious risk of bias (i.e. only one study with inadequate risk of bias).
Measurement error
Three studies evaluated the measurement error of the LSA-C, [22, 28, 29] two studies examined the LSA subscales, [22, 27] and one study examined the LSQ [5]. The standard error of measurement (SEM) for the LSA-C ranged from 4.12 to 9.1. These values were higher than the minimal important change (MIC) value [23]; therefore, hypotheses were not met (please refer to Appendix A for hypotheses). However, there was a high quality of evidence for this property. Percent agreement for LSA subscales ranged from 59 to 81%, with a low quality of evidence for the LSA-E and moderate for the LSA-I and LSA-M.
Predictive validity
Two studies looked at the predictive validity of the LSA-C [19, 26]. Portegijis et al. evaluated whether baseline LSA-C scores could identify those who developed ADL difficulties at 2 years and reported an AUC of 0.79 [26]. Shimada et al. reported an odds ratio of 2.18 (95% CI: 1.26–3.79) and a c-index of 0.84 (P < 0.001) for the LSA-C predicting functional decline in Instrumental Activities of Daily Living (IADL) at 1 year [19]. These studies had a sufficient rating with an overall high quality of evidence (Table 2 and Appendix F).
Convergent validity
Nine reports [8, 19, 21, 28, 29, 31–34] examined the convergent validity of the LSA-C, and two reports evaluated the modified LSA [18, 35]. One report evaluated the convergent validity of the LSQ [5] and another one the modified LSQ [25].
Forest plots were performed for LSA-C against measures of IADL and the Geriatric Depression Scale (GDS) (Appendix H). Pooled correlations were 0.53 (95% CI: 0.38–0.66) against IADL and −0.51 (95% CI: −0.63- (−0.36)) against GDS. For the LSA-C, correlations ranged from 0.37 to 0.60 with performance-based measures and 0.43 to 0.63 with accelerometry data. For LSA-C, 78% of the 36 hypotheses (Appendix A) were confirmed, with a high quality of evidence (Table 2). With performance-based measures, correlations were 0.47 for the LSA-E, 0.60–0.63 for the LSA-I and 0.19–0.20 for the LSA-M. The LSQ had moderate quality of evidence, with 25% of hypotheses confirmed.
Known-groups validity
One report [33] evaluated the known-groups validity of the LSA-C testing three hypotheses. McCrone et al. evaluated the mean difference between three cohorts: (i) outpatients (ii) domiciliary, non-hospitalised and (iii) domiciliary, recent hospital discharge. We expected at least a 3-point difference between the cohorts [23] and that this difference was statistically significant. McCrone et al. reported a statically significant difference of 14.1 between cohorts 1 and 2 (P < 0.001), a statistically significant difference of 17.3 between cohorts 1 and 3 (P < 0.001) and a difference of 3.3 with an unreported P-value between cohorts 2 and 3 [33]. The overall quality of evidence was very low due to very serious ROB because of poor reporting, inconsistent ratings and very serious indirectness due to having an age range of 25–99 years (Table 2).
Responsiveness
Four studies [18, 27, 33, 35] evaluated responsiveness. For LSA-C, 50% of hypotheses were confirmed [27, 33] and a standardised response mean (SRM) value of 0.60 was reported with physiotherapy intervention [33]. Portegijis et al. evaluated the correlation between LSA scores and perceived change in mobility over 1 year and reported a correlation of 0.22; however, we expected the correlation to be at least 0.30 [27]. The overall quality of evidence for the LSA-C for this property was moderate due to inconsistent ratings.
Two studies reported SRM values 0.70 and 0.80 following a home-based exercise program for the modified LSA-C [18, 35]. These two studies [18, 35] also evaluated the responsiveness of the subscales of the modified LSA. Hypotheses were 100% met for the subscales of the modified LSA, with SRMs from rehabilitation interventions ranging from 0.33 to 0.35 for LSA-E, 0.43 to 0.46 for LSA-I and 0.48 to 0.60 for LSA-M. The overall quality of evidence was moderate for the subscales due to Imprecision (i.e. samples less than 100) and serious ROB from doubtful ratings resulting from no predefined expectations of SRM magnitudes.
Feasibility and interpretability
Mean completion time for the LSA was 9.2 minutes over the phone [20]. For the modified LSA, the mean completion time was reported as 4.1 minutes when answered in person [18, 35]. Longitudinal studies reported a completion rate of 95.28% for the LSA [27] and 83% for the LSQ [5], at 1 year (Table 1).
Kennedy et al. evaluated MIC values for the LSA-C using a walking status anchor at monthly intervals [23]. An MIC of 2.5 points was reported for improvements in walking status, and an MIC of 2.9 points was reported for declines in walking status. Portegijis et al. reported a decline of >11.7 points on the LSA-C for those who developed ADL inability over 2 years [26]. Baker et al. reported at least a 10-point change in LSA over 6 months in 50% of participants [8], and McCrone et al. reported a mean change of 10.5 points between physiotherapy initial assessment and discharge, over an average of 8 weeks [33]. LSA-C cut-points for detecting ADL/IADL difficulties were 52.25 and 56 [19, 26]. A ceiling effect of 50% was reported for the LSA-C, [22] 48–59% reported for the LSA-E, [22, 27] 44% reported for the LSA-I, [27] and 29.9–79% reported for the LSA-M [18, 22, 27, 35]. For the modified LSA, a cut-off value of 26.75 differentiated between people with low and high life-space mobility [36]. Results related to interpretability are presented in Table 1.
One study assessed agreement between the LSA when completed by the participant versus their companion, and it reported an ICC of 0.88 between the two versions [24].
Discussion
This systematic review synthesised the measurement properties of life-space mobility measures in community-dwelling older adults following COSMIN guidelines. A total of 21 studies emerged from this review, of which the majority evaluated the University of Alabama at Birmingham Study of Aging LSA. The LSA assesses the actual day-to-day extent of movement across five different life-space areas, the frequency of this movement and whether assistance is needed or not. The LSA has been translated into multiple languages and has demonstrated content validity in community-dwelling older adults. This review identified that there is evidence in support of its reliability and validity in community-dwelling older adults.
The life-space mobility measures included in this review were developed based on the concept of life-space, which is broadly defined as an area that an individual moves through in daily life within a specific time frame [3]. Although performance-based tests such as the Time-Up-and-Go test or the gait speed test can be useful for evaluating one’s locomotor capacity for mobility, they are often performed in standardised settings that may not always be reflective of how one functions in daily life. Similarly, perceived measures of mobility ability do not always reflect actual day-to-day movement [37]. Life-space mobility measures provide an opportunity to assess actual or enacted mobility within the home or community setting and can complement measures of perceived mobility or capacity.
Responsiveness is an important psychometric property, especially when an outcome measure is used to evaluate treatment effects or change over time. This review identified four studies that evaluated the responsiveness of the LSA: two for the original version [27, 33] and two for the modified version [18, 35]. Among the included studies, the SRM values ranged from 0.60 to 0.80 (moderate to large) for the LSA or its modified version. However, distribution-based methods like the SRM can be affected by standard deviation values, the sample under study and variations in the treatment effect [38]. Therefore, future responsiveness studies evaluating change in scores on the LSA with change in scores on other mobility measures that have demonstrated responsiveness in community-dwelling older adults, are needed.
This review had several strengths. We closely followed COSMIN’s internationally accepted guidelines for systematically evaluating the measurement properties of patient-reported outcomes [12]. Furthermore, we evaluated the quality of the pooled evidence per measurement property using the modified GRADE approach. Also, as per COSMIN recommendations, we rated the measurement properties and methodological quality of the composite scores separately from the subscale scores, as the overall performance of each one might be different.
A limitation of this review was that we only included articles published in English, therefore, studies that evaluated the measurement properties of life-space mobility measures in other languages may have been missed. Moreover, we only included studies whose objectives were to evaluate the measurement properties of life-space mobility questionnaires. Articles that reported associations between life-space mobility and other variables, but were not measurement studies were excluded because they would have been assessed unfairly for quality. Therefore, we might have missed studies that could be informative, but did not meet the criteria for inclusion. In addition, when creating hypotheses against related but distinct constructs (e.g. GDS), a maximum correlation was not provided which could affect overall ratings. Furthermore, the instruments were usually tested in middle- or high-income countries or urban settings, which may limit the generalisability of our results. There were also deviations from the original protocol that should be noted. To align with COSMIN recommendations, grey literature, editorials and conference proceedings were excluded, as these often provide limited information and can impede quality assessment. Furthermore, as publication bias and selective reporting bias is difficult to quantify with studies on measurement properties, these were not assessed. Also, the eligibility criteria for age was reduced from 65 years old to 60, to better reflect the definition of an older person from the WHO.
In conclusion, based on our findings and synthesis of the literature, the LSA has sufficient measurement properties for assessing life-space mobility of older persons living in the community. There is a need for further well-designed studies on the responsiveness of the LSA in community-dwelling older adults and on its modified versions in general.
Supplementary Material
Contributor Information
Ayse Kuspinar, School of Rehabilitation Science, McMaster University, Hamilton, Ontario, Canada; McMaster Institute for Research on Aging, McMaster University, Hamilton, Ontario, Canada.
Ava Mehdipour, School of Rehabilitation Science, McMaster University, Hamilton, Ontario, Canada.
Marla K Beauchamp, School of Rehabilitation Science, McMaster University, Hamilton, Ontario, Canada; McMaster Institute for Research on Aging, McMaster University, Hamilton, Ontario, Canada.
Qiukui Hao, School of Rehabilitation Science, McMaster University, Hamilton, Ontario, Canada.
Emily Cino, Faculty of Medicine, University of Ottawa, Ottawa, ON, Canada.
Christopher Mikton, Demographic Change and Healthy Aging Unit, Social Determinants of Health, World Health Organization, Geneva, Switzerland.
Jotheeswaran Amuthavalli Thiyagarajan, Ageing and Health Unit, Department of Maternal, Newborn, Child and Adolescent Health and Ageing, WHO HQ, Geneva, Switzerland.
Theresa Diaz, Epidemiology, Monitoring and Evaluation Unit, Department of Maternal, Newborn, Child and Adolescent Health and Ageing, WHO HQ, Geneva, Switzerland.
Parminder Raina, McMaster Institute for Research on Aging, McMaster University, Hamilton, Ontario, Canada; Department of Health Research Methods, Evidence, and Impact, McMaster University, Hamilton, Ontario, Canada; Labarge Centre for Mobility in Aging, McMaster, University, Hamilton, Ontario, Canada.
Declaration of Conflicts of Interest
M.B. holds a tier 2 Canada Research Chair in Mobility, Aging, and Chronic Disease. P.R. holds the Raymond and Margaret Labarge Chair in Optimal Aging and Knowledge Application for Optimal Aging and a Tier 1 Canada Research Chair in Geroscience.
Declaration of Sources of Funding
In-kind contributions for this review were provided by the McMaster Institute for Research on Aging and Labarge Centre for Mobility in Aging.
Disclaimer
The authors alone are responsible for the views expressed in this article and they do not necessarily represent the views, decisions or policies of the institutions with which they are affiliated.
Data Availability Statement
The data underlying this article are available in the article and in its online supplementary material.
References
- 1. Amuthavalli Thiyagarajan J, Mikton C, Harwood RH et al. The UN decade of healthy ageing: strengthening measurement for monitoring health and wellbeing of older people. Age Ageing 2022; 51: afac147. 10.1093/ageing/afac147. [DOI] [PMC free article] [PubMed] [Google Scholar]
- 2. Organization, W.H . World Report on Ageing and Health. Luxembourg: World Health Organization, 2015. [Google Scholar]
- 3. Parker M, Baker PS, Allman RM. A life-space approach to functional assessment of mobility in the elderly. J Gerontol Soc Work 2002; 35: 35–55. [Google Scholar]
- 4. Webber SC, Porter MM, Menec VH. Mobility in older adults: a comprehensive framework. Gerontologist 2010; 50: 443–50. [DOI] [PubMed] [Google Scholar]
- 5. Stalvey BT, Owsley C, Sloane ME, Ball K. The life space questionnaire: a measure of the extent of mobility of older adults. J Appl Gerontol 1999; 18: 460–78. [Google Scholar]
- 6. Beauchamp M, Hao Q, Kuspinar A et al. A unified framework for the measurement of mobility in older persons. Age Ageing 2023; afad125. 10.1093/ageing/afad125. [DOI] [PMC free article] [PubMed] [Google Scholar]
- 7. Tinetti ME, Ginter SF. The nursing home life-space diameter: a measure of extent and frequency of mobility among nursing home residents. J Am Geriatr Soc 1990; 38: 1311–5. [DOI] [PubMed] [Google Scholar]
- 8. Baker PS, Bodner EV, Allman RM. Measuring life-space mobility in community-dwelling older adults. J Am Geriatr Soc 2003; 51: 1610–4. [DOI] [PubMed] [Google Scholar]
- 9. Johnson J, Rodriguez MA, Al Snih S. Life-space mobility in the elderly: current perspectives. Clin Interv Aging 2020; 15: 1665–74. [DOI] [PMC free article] [PubMed] [Google Scholar]
- 10. Ullrich P, Werner C, Abel B, Hummel M, Bauer JM, Hauer K. Assessing life-space mobility: a systematic review of questionnaires and their psychometric properties. Z Gerontol Geriatr 2022; 55: 660–6. [DOI] [PMC free article] [PubMed] [Google Scholar]
- 11. Beauchamp M, Hao Q, Kuspinar A et al. Measures of perceived mobility ability in community-dwelling older adults: a systematic review of psychometric properties. Age Ageing 2023; afad124. 10.1093/ageing/afad124. [DOI] [PMC free article] [PubMed] [Google Scholar]
- 12. Mokkink LB, Prinsen CAC, Patrick DL et al. COSMIN methodology for systematic reviews of patient-reported outcome measures (PROMs). Qual Life Res 2018; 78: 6–63. [DOI] [PMC free article] [PubMed] [Google Scholar]
- 13. Page MJ, McKenzie JE, Bossuyt PM et al. The PRISMA 2020 statement: an updated guideline for reporting systematic reviews. Int J Surg 2021; 88: 105906. 10.1016/j.ijsu.2021.105906. [DOI] [PubMed] [Google Scholar]
- 14. Cino E, Beauchamp M, Richardson J, Masrur M, Kuspinar A. Psychometric properties of life-space mobility measures in community-dwelling older adults: a systematic review protocol. JBI Evid Synth 2021; 19: 1425–32. [DOI] [PubMed] [Google Scholar]
- 15. Terwee CB, Prinsen CA, de Vet HCW et al. COSMIN Methodology for Assessing the Content Validity of PROMs–User Manual. Amsterdam: VU University Medical Center, 2018. [Google Scholar]
- 16. Covidence systematic review software . Veritas Health Innovation. Melbourne, Australia, 2021. Available at www.covidence.org. [Google Scholar]
- 17. Palazón-Bru A, Tomás-Rodríguez MI, Mares-García E, Gil-Guillén VF. A reliability generalization meta-analysis of the Victorian Institute of Sport Assessment Scale for Achilles tendinopathy (VISA-A). Foot Ankle Int 2019; 40: 430–8. [DOI] [PubMed] [Google Scholar]
- 18. Ullrich P, Abel B, Bauer JM, Hauer K. Validation of the Life-Space Assessment (LSA-CI) in multi-morbid, older persons without cognitive impairment. Eur Geriatr Med 2021; 12: 657–62. [DOI] [PubMed] [Google Scholar]
- 19. Shimada H, Sawyer P, Harada K et al. Predictive validity of the classification schema for functional mobility tests in instrumental activities of daily living decline among older adults. Arch Phys Med Rehabil 2010; 91: 241–6. [DOI] [PubMed] [Google Scholar]
- 20. Auger C, Demers L, Gélinas I et al. Development of a French-Canadian version of the life-space assessment (LSA-F): content validity, reliability and applicability for power mobility device users. Disabil Rehabil Assist Technol 2009; 4: 31–41. [DOI] [PubMed] [Google Scholar]
- 21. Fristedt S, Kammerlind A-S, Bravell ME, Fransson EI. Concurrent validity of the Swedish version of the Life-Space Assessment Questionnaire. BMC Geriatr 2016; 37: 1–6. 10.1140/epje/i2014-14041-2. [DOI] [PMC free article] [PubMed] [Google Scholar]
- 22. Kammerlind A-SC, Fristedt S, Ernsth Bravell M, Fransson EI. Test–retest reliability of the Swedish version of the Life-Space Assessment Questionnaire among community-dwelling older adults. Clin Rehabil 2014; 28: 817–23. [DOI] [PubMed] [Google Scholar]
- 23. Kennedy RE, Almutairi M, Williams CP, Sawyer P, Allman RM, Brown CJ. Determination of the minimal important change in the Life-Space Assessment. J Am Geriatr Soc 2019; 67: 565–9. [DOI] [PubMed] [Google Scholar]
- 24. Cavanaugh JT, Crawford K. Life-space assessment and physical activity scale for the elderly: validity of proxy informant responses. Arch Phys Med Rehabil 2014; 95: 1527–32. [DOI] [PubMed] [Google Scholar]
- 25. Barnes LL, Wilson RS, Bienias JL et al. Correlates of life space in a volunteer cohort of older adults. Exp Aging Res 2007; 33: 77–93. [DOI] [PubMed] [Google Scholar]
- 26. Portegijs E, Rantakokko M, Viljanen A, Sipilä S, Rantanen T. Identification of older people at risk of ADL disability using the life-space assessment: a longitudinal cohort study. J Am Med Dir Assoc 2016; 17: 410–4. [DOI] [PubMed] [Google Scholar]
- 27. Portegijs E, Iwarsson S, Rantakokko M, Viljanen A, Rantanen T. Life-space mobility assessment in older people in Finland; measurement properties in winter and spring. BMC Res Notes 2014; 7: 1–9. 10.1186/1756-0500-7-323. [DOI] [PMC free article] [PubMed] [Google Scholar]
- 28. do Socorro Mp Simões M, Garcia IF, da Cm Costa L, Lunardi AC. Life-space assessment questionnaire: novel measurement properties for Brazilian community-dwelling older adults. Geriatr Gerontol Int 2018; 18: 783–9. [DOI] [PubMed] [Google Scholar]
- 29. Garcia IFF, Tiuganji CT, Simões MSMP, Lunardi AC. A study of measurement properties of the Life-Space Assessment questionnaire in older adults with chronic obstructive pulmonary disease. Clin Rehabil 2018; 32: 1374–82. [DOI] [PubMed] [Google Scholar]
- 30. Curcio C-L, Alvarado BE, Gomez F, Guerra R, Guralnik J, Zunzunegui MV. Life-space assessment scale to assess mobility: validation in Latin American older women and men. Aging Clin Exp Res 2013; 25: 553–60. [DOI] [PubMed] [Google Scholar]
- 31. Yang Y-N, Kim BR, Uhm KE et al. Life space assessment in stroke patients. Ann Rehabil Med 2017; 41: 761–8. [DOI] [PMC free article] [PubMed] [Google Scholar]
- 32. Ji M, Zhou Y, Liao J, Feng F. Pilot study on the Chinese version of the Life Space Assessment among community-dwelling elderly. Arch Gerontol Geriatr 2015; 61: 301–6. [DOI] [PubMed] [Google Scholar]
- 33. McCrone A, Smith A, Hooper J, Parker RA, Peters A. The Life-Space Assessment measure of functional mobility has utility in community-based physical therapist practice in the United Kingdom. Phys Ther 2019; 99: 1719–31. [DOI] [PMC free article] [PubMed] [Google Scholar]
- 34. Tseng Y-C, Gau B-S, Lou M-F. Validation of the Chinese version of the Life-Space Assessment in community-dwelling older adults. Geriatr Nurs 2020; 41: 381–6. [DOI] [PubMed] [Google Scholar]
- 35. Ullrich P, Werner C, Bongartz M, Kiss R, Bauer J, Hauer K. Validation of a modified Life-Space Assessment in multimorbid older persons with cognitive impairment. Gerontologist 2019; 59: e66–75. [DOI] [PubMed] [Google Scholar]
- 36. Ullrich P, Werner C, Eckert T et al. Cut-off for the Life-Space Assessment in persons with cognitive impairment. Aging Clin Exp Res 2019; 31: 1331–5. [DOI] [PubMed] [Google Scholar]
- 37. Glass TA. Conjugating the “tenses” of function: discordance among hypothetical, experimental, and enacted function in older adults. Gerontologist 1998; 38: 101–12. [DOI] [PubMed] [Google Scholar]
- 38. De Vet HC, Terwee CB, Mokkink LB, Knol DL Measurement in Medicine: A Practical Guide. Cambridge: Cambridge University Press, 2011. 10.1017/CBO9780511996214. [DOI] [Google Scholar]
Associated Data
This section collects any data citations, data availability statements, or supplementary materials included in this article.
Supplementary Materials
Data Availability Statement
The data underlying this article are available in the article and in its online supplementary material.