

Abstract

The preference for different conformations in morpholine has a notable effect on its behavior and reactivity in organic synthesis. Herein, we explored the intricate conformational properties of morpholines through a combination of advanced mass spectrometric techniques and theoretical calculations. Notably, we employed infrared (IR) resonant vacuum ultraviolet (VUV) mass-analyzed threshold ionization spectroscopy to measure the unique vibrational spectra of the distinct conformers (Chair-Eq and Chair-Ax) in morpholine for the first time. Through precise VUV photon energy adjustments to coincide with the vibrational excitation via IR absorption, we effectively pinpointed the adiabatic ionization thresholds corresponding to the Chair-Eq (65 442 ± 4 cm–1) and Chair-Ax (65 333 ± 4 cm–1) conformers. This allowed us to accurately determine the conformational stability between the two conformers (109 ± 4 cm–1). By shedding light on the conformational properties of morpholine, this study brings far-reaching implications to the fields of organic synthesis and pharmaceutical research.
Morpholine [O(CH2CH2)2NH] is an aliphatic heterocyclic compound that is increasingly being exploited in a wide range of industrial, pharmaceutical, and organic synthesis applications as a result of its notable nucleophilic properties.1−4 Its distinct reactivity and versatility render it a highly valuable compound in the field of medicinal chemistry, where it serves as a foundational building block for the development of biologically active molecules and the design of straightforward synthetic pathways.5,6 Hence, understanding the conformational properties of morpholine is essential for determining its conformation-dependent pharmacological activity and developing efficient synthetic methods. This importance arises from the fact that many nucleophilic reactions are intricately intertwined with the conformational interconversions of molecules.7,8 The conformational structure of morpholine has been investigated experimentally using various spectroscopic tools, such as nuclear magnetic resonance spectroscopy, infrared (IR) spectroscopy, microwave spectroscopy, and Raman spectroscopy.9−12 These techniques have identified the stable equatorial and axial NH conformations in only the chair form of morpholine. This is attributed to the considerably higher relative energy of the boat form in comparison to that of the chair form.
However, the preferential conformation in the chair form of morpholine has not yet been fully revealed, and more comprehensive investigations are needed to measure and predict the conformer populations of morpholine and their stabilities. In fact, the theoretical predictions for the preferential conformation in morpholine depend upon the methods used and the uncertainties in calculating relative energies for conformers with similar stability.13,14 Additionally, determining the contributions of individual conformers to the congested vibrational spectrum is difficult as a result of comparable force fields among the atoms in the conformers.15,16
Ion spectroscopic techniques have shown promise in selectively studying specific conformations or vibrational states of molecules by adiabatically cooling them to reduce conformational complexity.17−19 These techniques allow for the initial selection of a particular conformation or vibrational state followed by conformer-specific photodissociation dynamics. By analysis of the vibrational spectra, one can identify peaks corresponding to specific conformers. However, exploring the vibrational temperature-dependent conformational population is necessary to obtain a complete picture, which relies on constructed potential energy surfaces associated with conformational interconversion.20−22
To address these challenges, we utilized high-resolution vacuum ultraviolet mass-analyzed threshold ionization (VUV-MATI) spectroscopy combined with two-dimensional potential energy surface analysis.23−25 VUV-MATI is a powerful technique that can elucidate the precise conformational structures of molecules. Previously, this technique was used to investigate the conformer-specific photoionization (PI) dynamics of morpholine.26 The results revealed highly favorable Franck–Condon transitions for ionic transitions from the Chair-Ax conformer, while transitions from the Chair-Eq conformer were extremely unfavorable as a result of the existence of only the axial-like NH conformation in the cationic (D0) state. Consequently, the observed ionic transitions were attributed solely to the Chair-Ax conformer with no information about the conformational preference in the neutral (S0) state.
Previous techniques, such as ultraviolet (UV) and UV laser double resonance, focused primarily on hydrogen-bonded clusters or van der Waals complexes in chromophore-containing systems and were limited by the resonance-enhanced multiphoton ionization (REMPI) scheme.27−31 Subsequent advancements in double resonance techniques involving IR and VUV that can circumvent the limitations of REMPI allowed for the analysis of aliphatic species without a chromophore group, albeit with some uncontrollable fragmentations.32,33 In contrast, IR dip/hole-burn VUV-MATI spectroscopy offers a direct means to gather structural information on individual conformers in both the S0 and D0 states, providing precise experimental data on conformational populations.34−36 Specifically, IR hole-burn VUV-MATI delivers spectra of individual conformers in the D0 state, while IR dip VUV-MATI captures the distinct IR spectra of individual conformers in the S0 state.
In this study, we investigated the conformational stability of morpholine and determined the preferred conformer using IR resonant VUV-MATI spectroscopy. By analyzing the IR resonant VUV-PI spectra of morpholine obtained under different supersonic expansion conditions, we can estimate the relative populations of the Chair-Eq and Chair-Ax conformers in the S0 state. The results reveal that the Chair-Eq conformer is more stable than the Chair-Ax conformer. Furthermore, we investigated the PI efficiency curves of the identified conformers by exciting their vibrational modes in the IR resonant VUV-PI spectra. This enabled us to determine the adiabatic ionization energies of the Chair-Eq and Chair-Ax conformers, providing a more accurate assessment of their conformational stability.
The IR absorption spectrum of morpholine in the S0 state was obtained using IR resonant VUV-PI (Figure 1a). The VUV laser pulse had a frequency of 65 232 cm–1, which was below the ionization thresholds of morpholine.26 The preceding IR laser pulse was scanned through the CH and NH stretching regions. This measurement is expected to capture the combined vibrational spectra of the stable equatorial and axial NH conformations that are expected to exist in the S0 state, based on previous findings.9−12 Prior to measurements, we performed density functional theory (DFT) simulations of the IR spectra for the two anticipated conformers, Chair-Eq and Chair-Ax, using the B3LYP/aug-cc-pVTZ level. The simulated spectra are depicted in panels b and c of Figure 1 for Chair-Eq and Chair-Ax, respectively. To address uncertainties arising from the incomplete treatment of the electron configuration interaction with finite basis sets, we scaled the frequencies in the simulated spectra appropriately.37,38
Figure 1.

(a) IR resonant VUV-PI spectrum of morpholine obtained by scanning the frequency of the IR laser in the range of 2715–3400 cm–1. The VUV laser was fixed at a frequency of 65 232 cm–1. The morpholine sample was expanded supersonically with Ar gas at a pressure of 6 atm. (b) Simulated IR spectrum of the Chair-Eq conformer of morpholine calculated using DFT. (c) Simulated IR spectrum of the Chair-Ax conformer of morpholine calculated using DFT.
However, assigning the peaks in the measured IR absorption spectrum to specific vibrational modes of the corresponding conformer at this stage was difficult, with only the simulated IR spectra of Chair-Eq and Chair-Ax conformers in the S0 state. This difficulty arises from the presence of indistinguishable peaks in the congested IR absorption spectrum, where conformers with similar force fields in equilibrium exhibit overlapping peaks.39 To accurately determine the vibrational peaks corresponding to individual conformers, we employed IR resonant one-photon VUV-MATI spectroscopy. This involved monitoring the vibrational spectrum of cationic morpholine as a function of VUV photon energy, revealing the adiabatic ionic transitions from the Chair-Ax conformer in the S0 state to the Chair-Ax-like+ • conformer in the D0 state.26 Notably, the most intense peak observed at 65 332 cm–1 corresponds to the 0–0 band of the Chair-Ax conformer.
To obtain the IR dip VUV-MATI spectrum, we monitored the 0–0 band while scanning the frequency of the IR laser, and the results are shown in Figure 2a. Importantly, the measured IR dip spectrum represents the unique IR spectrum of the Chair-Ax conformer in the S0 state. Furthermore, all of the distinct peaks observed in the IR dip spectrum of the Chair-Ax conformer (Figure 2a) matched the peaks observed in the IR absorption spectrum of morpholine (Figure 2b). However, owing to highly unfavorable FC transitions, we were unable to obtain the VUV-MATI spectrum of the Chair-Eq conformer.26 However, considering that the measured IR absorption spectrum of morpholine serves as a proxy for the vibrational spectra of both Chair-Eq and Chair-Ax conformers in equilibrium, the unique IR spectrum of the Chair-Eq conformer can be accurately derived by utilizing the IR absorption spectrum. To achieve this, we scaled the IR dip spectrum of the Chair-Ax conformer with respect to the relatively isolated peak intensity observed at 2963 cm–1 in the IR resonant VUV-PI spectrum of morpholine. Subsequently, the unique IR spectrum of the Chair-Eq conformer could be obtained by subtracting the scaled IR dip spectrum of the Chair-Ax conformer from the IR resonant VUV-PI spectrum, as depicted in Figure 2c.
Figure 2.

(a) IR dip VUV-MATI spectrum obtained by monitoring the 0–0 band at 65 331 cm–1 corresponding to the Chair-Ax conformer in the VUV-MATI spectrum. (b) IR resonant VUV-PI spectrum of morpholine obtained by scanning the IR laser frequency. (c) Unique IR spectra of the Chair-Eq (blue) and Chair-Ax (red) conformers. The spectrum of the Chair-Ax conformer represents the scaled IR dip VUV-MATI spectrum of the Chair-Ax conformer, with scaling based on the peak intensity at 2963 cm–1 in the IR resonant VUV-PI spectrum. The spectrum of the Chair-Eq conformer is obtained by subtracting the scaled IR dip VUV-MATI spectrum of the Chair-Ax conformer from the IR resonant VUV-PI spectrum. (d) Simulated IR spectra of the Chair-Eq (blue) and Chair-Ax (red) conformers calculated using DFT with anharmonic potentials.
To assign the peaks observed in the vibrational spectra of the individual conformers, we performed simulations of the IR spectra for each conformer using DFT (with B3LYP/aug-cc-pVTZ) with anharmonic potentials. The simulated IR spectra for the Chair-Eq and Chair-Ax conformers are shown in Figure 2d. These spectra were then compared to the unique IR spectra obtained through the IR dip VUV-MATI scheme (Figure 2c). The spectra were in good agreement; therefore, we correctly assigned most of the vibrational peaks in the IR dip spectra as well as the IR resonant VUV-PI spectrum to the fundamental vibrational modes associated with the N–CH2 and O–CH2 symmetric and asymmetric stretching vibrations of each conformer. The assigned vibrational modes obtained through the combination of experimental measurements and theoretical calculations are listed in Table 1 along with the calculated results and the previously reported values. This indicates that the acquired IR spectra correspond to the unique vibrational spectra of the Chair-Eq and Chair-Ax conformers in the S0 state of morpholine. Notably, we observed Fermi resonances38,39 between the O–CH2 symmetric stretching (41) and the overtones or combinations of C–H and N–H bending for the Chair-Eq conformer, which appeared at 2902 cm–1 (282/272), 2919 cm–1 (271261), and 2952 cm–1 (7161). For the Chair-Ax conformer, the Fermi resonance occurred between the N–CH2 symmetric stretching (41) and the overtone of the N–H bending, appearing at 2926 cm–1 (282).
Table 1. Vibrational Assignment for the High-Frequency Region (cm–1) of the Chair-Eq and Chair-Ax Conformers of Morpholine in the S0 State Was Based on Experimental Measurements and Theoretical Calculations.
| mode (CS)a | IRb | harmonicc | anharmonicd | IR resonant VUV-PI | IR dip VUV-MATI | mode description |
|---|---|---|---|---|---|---|
| Chair-Eq | ||||||
| 251 | 2819 (0.39) | 2807 (0.24) | 2803 (0.20) | 2803 (0.18) | N–CH2 asym. stretch | |
| 51 | 2735 | 2823 (1.00) | 2829 (0.29) | 2832 (0.72) | 2832 (0.68) | N–CH2 sym. stretch |
| 41 | 2864 | 2873 (0.99) | 2859 (0.64) | 2864 (0.64) | 2864 (0.62) | O–CH2 sym. stretch |
| 282/272 | 2862 (0)/2865 (0) | 2908 (0.44)/2913 (0.11) | 2903 (0.30) | 2902 (0.29) | overtone of NH bend/overtone of CH2 bend | |
| 271261 | 2870 (0) | 2924 (0.23) | 2920 (0.28) | 2919 (0.25) | CH2 bend + NH bend | |
| 231/7161 | 2924 | 2947 (0.47)/2888 (0) | 2954 (0.51)/2945 (0.31) | 2952 (1.00)e | 2952 (0.85) | N–CH2 asym. stretch/combination of CH2 bends |
| 221/21 | 2924 | 2974 (0.45)/2976 (0.19) | 2974 (0.62)f/2976 (0.15) | 2974 (0.62) | 2974 (0.62)f | O–CH2 asym. stretch/O–CH2 sym. stretch |
| Chair-Ax | ||||||
| 251/51 | 2864 | 2837 (0.28)/2845 (1.00) | 2841 (0.03)/2843 (0.09) | 2841 (0.20) | 2841 (0.15) | O–CH2 asym. stretch/O–CH2 sym. stretch |
| 282/262 | 2841 (0)/2883 (0) | 2910 (0.03)/2928 (0.02) | 2926 (0.23) | 2926 (0.14) | overtone of NH bend/overtone of NH bend | |
| 41/241 | 2902 | 2913 (0.37)/2911 (0.30) | 2943 (0.07)/2944 (0.02) | 2926 (0.23) | 2926 (0.14) | N–CH2 sym. stretch/N–CH2 asym. stretch |
| 31/231 | 2950 | 2958 (0.27)/2958 (0.60) | 2954 (0.10)/2954 (0.04) | 2952 (1.00)e | 2953 (0.16) | N–CH2 sym. stretch/N–CH2 asym. stretch |
| 221 | 2961 | 2963 (0.41) | 2963 (0.18)f | 2963 (0.18) | 2963 (0.18)f | O–CH2 asym. stretch |
Vibrational assignment with Mülliken notation for individual conformers in the neutral morpholine.
Vibrational frequencies measured by the IR spectroscopy in ref (42).
Harmonic vibrational frequencies calculated for the Chair-Eq and Chair-Ax conformers optimized using DFT with B3LYP/aug-cc-pVTZ, scaled by 0.964 with respect to the 221 mode, with the peak intensities in parentheses scaled with respect to the 51 mode of the two conformers.
Anharmonic vibrational frequencies calculated for the Chair-Eq and Chair-Ax conformers using DFT with B3LYP/aug-cc-pVTZ, scaled by 1.007 and 1.009, respectively, with respect to the 221 mode.
Peak intensities in parentheses were normalized by the most intense peak at 2952 cm–1.
Peak intensities in parentheses were scaled with respect to the 221 mode in the IR dip spectra of the two conformers.
We then thoroughly investigated the conformational preference in morpholine, which is crucial for determining its structural stability, reactivity, and functional properties. The conformational preference can be revealed by examining the relative populations of the Chair-Eq and Chair-Ax conformers under different molecular beam conditions.40,41 The analysis was based on the vibrational peaks observed in the IR resonant VUV-PI spectra of morpholine obtained under supersonic expansion conditions with helium (He) at 6.0 atm and argon (Ar) at 1.5 and 6.0 atm, as shown in Figure S1 of the Supporting Information. Then, the peak areas were estimated by fitting the data using a single Gaussian function and dividing by the IR absorption probabilities of the corresponding vibrational excitation. In particular, the same 221 mode at 2974 and 2963 cm–1 for the Chair-Eq and Chair-Ax conformers was chosen. Then, the IR absorption probabilities were calculated using harmonic and anharmonic potentials. Calculations with harmonic potentials revealed that the IR absorption cross sections of the 221 mode for the two conformers are similar. In contrast, the IR absorption probabilities calculated using anharmonic potentials are different, mainly because they considered Fermi resonance-induced changes in intensities and frequencies. Accordingly, under the cold beam condition with Ar, the population ratios (IAx/IEq) between the Chair-Ax and Chair-Eq conformers for harmonic and anharmonic potentials were determined to be 0.372 and 0.171, while under the warm condition with He, the ratios were 0.451 and 0.207, respectively. In reality, these different treatments in population estimation produce considerable deviations in the relative population between the two conformers, resulting in a large uncertainty in the calculated conformational stability.
Evidently, although the population ratio between conformers with an energy difference in the neutral ground state would rapidly decrease with the temperature of the molecular beam, both estimations indicated that the population of the Chair-Ax conformer in the neutral state is significant, even under molecular beam conditions. This implies that the energy difference between two conformers should be very small or the conformational cooling in morpholine under the molecular beam condition might be inefficient considering that the vibrational temperature achieved with Ar was found to be ca. 50 K in our thietane study.43 The vibrational temperature of the molecular beam of the sample was hence deduced from the Boltzmann distribution of the hot band (3911) for the Chair-Ax conformer at −24 cm–1 in the MATI spectrum, as shown in Figure S2 of the Supporting Information. The vibrational temperatures of morpholine achieved with He and Ar carrier gases were determined to be 166 and 128 K, respectively. We can deduce that the conformational cooling is considerably inefficient as a result of the structure having ineffective vibrational energy relaxation under the molecular beam, as mentioned in previous studies on the conformational preferences of isobutanal and propanal.20,44
From the population ratios of the conformers determined at vibrational temperatures of 166 and 128 K, the conformational stability or the enthalpy difference (EAx – EEq) can be calculated using the equation ΔH = −RT ln K + TΔS, where K is estimated from the relative populations and ΔS is determined through quantum chemical calculations. In our study, at a vibrational temperature of 128 K, the energy differences (ΔH) obtained from the population ratios between the Chair-Eq and Chair-Ax conformers, estimated using both harmonic and anharmonic potentials, were determined to be 97 ± 10 and 166 ± 10 cm–1, respectively. The conformational stabilities and population ratios of the Chair-Eq and Chair-Ax conformers at different vibrational temperatures, as determined by the IR resonant VUV-PI study, are summarized in Table 2, along with previous results. It is noteworthy that the determined energy differences vary depending upon the method used.
Table 2. Conformational Stability and Population of Morpholine Were Determined via Two-Photon IR + VUV PI and IR Resonant VUV-PI Measurements.
| method | T (K) | K (har)a | K (anh)a | ΔH (har)b ( cm–1) | ΔH (anh)b ( cm–1) |
|---|---|---|---|---|---|
| IR resonant VUV-PI | 166 | 0.451 | 0.207 | 103 ± 12 | 192 ± 12 |
| 128 | 0.372 | 0.171 | 97 ± 10 | 166 ± 10 | |
| calc | 0 | 255 | |||
| UV-PDd | mol beam | 180 ± 50 | |||
| IRe | 350–490 | 175 ± 35 | |||
| two-photon IR + VUV-PIEf | 128 | 0.323 | 109 ± 4 | ||
Peak area ratios (IAx/IEq) between two conformers divided by the IR absorption probabilities calculated for 22 modes of the Chair-Ax and Chair-Eq conformers with harmonic and anharmonic potentials using B3LYP/aug-cc-pVTZ.
Enthalpy difference (EAx – EEq) using the simple equation ΔH = −RT ln K + TΔS, where K was estimated by the relative populations and ΔS was determined by quantum chemical calculations.
Difference of the calculated adiabatic ionization energy [ΔAIEcal(Eq–Ax)].
Enthalpy difference (EAx – EEq) from ref (45).
Enthalpy difference (EAx – EEq) from ref (9).
The difference between the measured adiabatic ionization energies [ΔAIE(Eq–Ax)] of the Chair-Eq and Chair-Ax conformers equaled the relative energy of the Chair-Ax conformer, resulting from the existence of only the Chair-Ax-like+ • conformer in the D0 state.
However, it is important to note that the relatively high population of the Chair-Ax conformer, even under supersonic expansion conditions, is a result of the small energy difference between the two conformers, facilitating their equilibration. Furthermore, a previous investigation of the vibrational states and dissociation pathways of morpholinyl products provided an initial estimate of the energy difference between the two conformers as 180 ± 50 cm–1.45 This disparity highlights the challenge of accurately determining the conformational stability of morpholine. Further research and refined experimental techniques are required to obtain more precise measurements and a deeper understanding of the conformational preferences and energy differences between the conformers in morpholine.
The two-photon IR + VUV PI efficiency (PIE) curves of the Chair-Eq and Chair-Ax conformers were acquired via the vibrational excitation of each conformer in the S0 state. The conformer-specific PIE curves of morpholine show the adiabatic ionic transition to a Chair-Ax-like+ • conformer in the D0 state from each conformer in the S0 state, where the ionization onset essentially corresponds to the ionization energy of each conformer. Further, the results indicate that the difference between the measured adiabatic ionization energies [ΔAIE(Eq–Ax)] of the Chair-Eq and Chair-Ax conformers equals the relative energy of the Chair-Ax conformer to the Chair-Eq conformer in the S0 state, which corresponds to the conformational stability of morpholine. In particular, we utilized five intense vibrational peaks from the IR resonant VUV-PI spectrum for excitation with fixed IR frequencies, followed by scanning the VUV wavelength to ionize the molecule. Two of these peaks, at 2974 and 2963 cm–1, corresponded to the 221 mode of the Chair-Eq and Chair-Ax conformers, respectively, while the isolated peak at 2864 cm–1 represented the 4 mode of the Chair-Eq conformer. This shows that the measured conformer-specific PIE curve quantified the ionic transition of a conformer with the ionization onset. In contrast, the two peaks at 2832 and 2952 cm–1, which are associated with the vibrational modes of both conformers, led to the two-photon IR + VUV-PIE curves displaying individual ionization onsets for both the Chair-Ax and Chair-Eq conformers, as shown in Figure 3.
Figure 3.
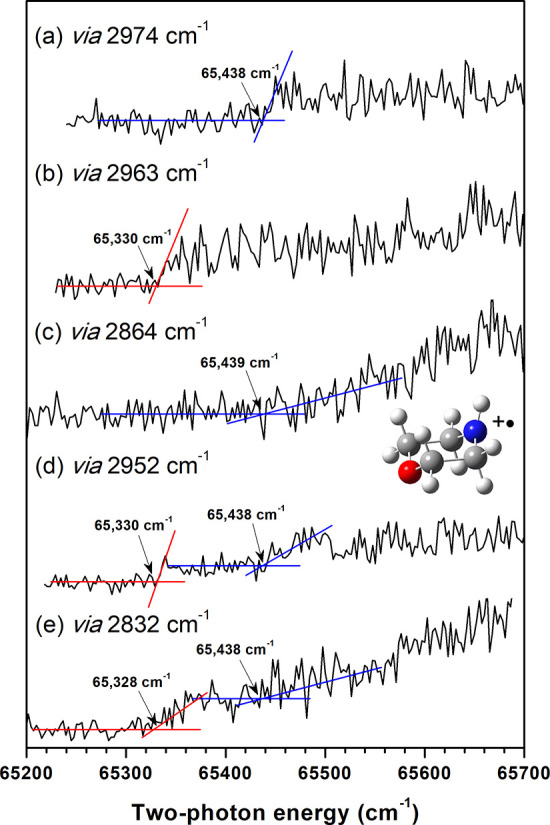
Two-photon IR + VUV-PIE curves for morpholine conformers measured via excitations of vibrational modes at (a) 2974, (b) 2963, (c) 2864, (d) 2952, and (e) 2832 cm–1 observed in the IR resonant VUV-PI spectrum of morpholine. The ionization onset positions for the Chair-Ax conformer are indicated by red lines, while those for the Chair-Eq conformer are indicated by blue lines in the figure. These two-photon IR + VUV-PIE curves provide valuable information about the conformational stability and energy differences between the conformers in morpholine.
Comparing the measured conformer-specific PIE curve for the Chair-Ax conformer (65 330 cm–1) to our previous measurement on the VUV-PIE curve (65 329 cm–1),26 we found excellent agreement, validating the accuracy of the obtained ionization thresholds for each conformer. By exciting the vibrational mode of the Chair-Eq conformer at 2974 cm–1, the ionization onset was observed at 65 438 cm–1 (Figure 3a), which corresponds to the ionization threshold from the Chair-Eq conformer to the Chair-Ax-like+ • conformer. Similarly, when exciting the 4 mode of the Chair-Eq conformer at 2864 cm–1, the ascending ionization onset was found at 65 439 cm–1 (Figure 3c). This is attributed to the unfavorable Franck–Condon factors for adiabatic ionic transitions from the Chair-Eq conformer in the S0 state to only the Chair-Ax-like+ • conformer in the D0 state. Remarkably, this value was in good agreement with that estimated in Figure 3a.
Furthermore, for the vibrational modes that overlapped between the two conformers (at 2832 and 2952 cm–1), the individual ionization onsets of the Chair-Ax and Chair-Eq conformers were clearly observed in the two-photon PIE curves (panels d and e of Figure 3). On the basis of these measurements, we determined the averaged ionization onsets for the Chair-Ax and Chair-Eq conformers to be 65 329 and 65 438 cm–1, respectively, resulting in an enthalpy difference of 109 ± 4 cm–1, as listed in Table 2. Notably, this value falls within the range of the estimated values obtained from population area ratios with harmonic IR absorption probabilities derived from the IR resonant VUV-PI spectra under different molecular beam conditions. This concurrence is significant because the population ratio determined from the enthalpy difference extracted from the two-photon IR + VUV-PIE curves of the two conformers aligns exceptionally well with the value estimated from the same vibrational temperature, as given in Table 2. This strongly implies that the population ratios between the two conformers can be reliably employed to assess conformational stability, contingent upon the availability of accurately calculated values for the IR absorption probability, vibrational temperature, and entropy difference. Most of all, the two-photon IR + VUV-PIE curves provided conclusive information on the ionization thresholds and conformational stability between the Chair-Eq and Chair-Ax conformers in morpholine. Considering the accurate adiabatic ionization energy of the Chair-Ax conformer from the previous VUV-MATI study, we accurately determined the adiabatic ionization energy of the Chair-Eq conformer to be 8.1138 ± 0.0005 eV (65 442 ± 4 cm–1).
To summarize, our study employed IR resonant VUV-MATI spectroscopy to explore the conformational stability of morpholine and reveal its preferred conformer. By analyzing the IR resonant VUV-PI spectra of morpholine under different supersonic expansion conditions, we successfully estimated the relative populations of the Chair-Eq and Chair-Ax conformers in the S0 state. The results revealed that the Chair-Eq conformer is more stable than the Chair-Ax conformer. To further investigate the conformational stability, we examined the two-photon IR + VUV-PIE curves by selectively exciting the vibrational modes corresponding to a specific conformer based on the analyzed IR resonant VUV-PI spectrum. This approach, which determined the adiabatic ionization energies, allowed for more accurate assessments of conformational stability. These comprehensive results significantly enhance our understanding of the conformational preferences and energy differences among the conformers in morpholine. Therefore, the reactivity of morpholine in various chemical reactions can be reliably predicted, providing valuable information for the design of new molecules with tailored properties.
Experimental Methods
Experiments were performed using a custom-built VUV-MATI mass spectrometer as described in detail in previous studies.46,47 The VUV laser pulse used in the experiments had a coherent and tunable wavelength range of 126.3–128.6 nm. This VUV laser pulse was generated through resonant four-wave difference mixing (FWDM) based on transitions in Kr (4p6–5p[1/2]0 or 4p6–5p[5/2]2), with alternating transitions to account for wavevector mismatches depending upon the desired VUV wavelength. The MATI ion signals obtained were normalized using the power of the tunable visible laser used for FWDM-based VUV generation. For IR resonant VUV-PI/MATI, a high-resolution IR laser light in the range of 2715–3400 cm–1 was generated using a narrowband optical parametric oscillator/amplifier (OPO/OPA) system (∼0.1 cm–1, Laser Vision). This IR laser light had an approximate energy of 7 mJ per pulse and was generated by pumping the OPO/OPA system with a Nd:YAG laser seeded with a wavelength of 1064 nm. The generated IR laser light was focused using a telescope comprising two CaF2 lenses (f = 75 and −100 mm) and aligned perpendicular to both the molecular beam and the ion-flight direction within the PI chamber.
In the experiments, the VUV laser pulse was delayed by approximately 5 ns relative to the IR laser pulse, which allowed for the photoexcitation of the neutral conformers to a specific vibrational state. The frequencies of all lasers used in the experiments were measured and calibrated using a wavemeter (wavelength meter WS5, HighFinesse) with an accuracy of 0.1 cm–1.
Quantum chemical calculations were performed using the Gaussian 16 program package48 at various levels of theory, including B3LYP, CAM-B3LYP, M06-2X, ωB97XD, and MP2. Basis sets up to aug-cc-pVTZ were used to obtain the optimized structures and vibrational frequencies for the neutral and cationic conformers in morpholine. In particular, the IR spectra of the neutral conformers were simulated at the B3LYP/aug-cc-pVTZ level with harmonic and anharmonic potentials for comparison to the experimental IR spectra. Anharmonic frequencies for each conformer in the S0 state were obtained by performing the numerical differentiations along the normal modes. In addition, the AIE of each conformer was calculated with zero-point energy corrections.
Acknowledgments
This work was supported by the National Research Foundation of Korea (Grants 2023R1A2C2002749 and 2021R1I1A1A01047743).
Supporting Information Available
The Supporting Information is available free of charge at https://pubs.acs.org/doi/10.1021/acs.jpclett.3c02280.
The authors declare no competing financial interest.
Supplementary Material
References
- Wijtmans R.; Vink M. K. S.; Schoemaker H. E.; van Delft F. L.; Blaauw R. H.; Rutjes F. P. J. T. Biological Relevance and Synthesis of C-Substituted Morpholine Derivatives. Synthesis 2004, 2004, 641–662. 10.1055/s-2004-816003. [DOI] [Google Scholar]
- Eicher T.; Hauptmann S.; Speicher A.. The Chemistry of Heterocycles: Structures, Reactions, Synthesis, and Applications, 3rd ed.; John Wiley & Sons: Hoboken, NJ, 2013. [Google Scholar]
- Kumari A.; Singh R. K. Morpholine as ubiquitous pharmacophore in medicinal chemistry: Deep insight into the structure–activity relationship (SAR). Bioorg. Chem. 2020, 96, 103578 10.1016/j.bioorg.2020.103578. [DOI] [PubMed] [Google Scholar]
- Fernández D. F.; González-Esguevillas M.; Keess S.; Schäfer F.; Mohr J.; Shavnya A.; Knauber T.; Blakemore D. C.; MacMillan D. W. C. Redefining the Synthetic Logic of Medicinal Chemistry. Photoredox-Catalyzed Reactions as a General Tool for Aliphatic Core Functionalization. Org. Lett. 2023, 10.1021/acs.orglett.3c00994. [DOI] [PMC free article] [PubMed] [Google Scholar]
- Kourounakis A. P.; Xanthopoulos D.; Tzara A. Morpholine as a privileged structure: A review on the medicinal chemistry and pharmacological activity of morpholine containing bioactive molecules. Med. Res. Rev. 2020, 40, 709–752. 10.1002/med.21634. [DOI] [PubMed] [Google Scholar]
- Lenci E.; Calugi L.; Trabocchi A. Occurrence of Morpholine in Central Nervous System Drug Discovery. ACS Chem. Neurosci. 2021, 12, 378–390. 10.1021/acschemneuro.0c00729. [DOI] [PMC free article] [PubMed] [Google Scholar]
- Seeman J. I. Effect of Conformational Change on Reactivity in Organic Chemistry. Evaluations, Applications, and Extensions of Curtin-Hammett/Winstein-Holness Kinetics. Chem. Rev. 1983, 83, 83–134. 10.1021/cr00054a001. [DOI] [Google Scholar]
- Chamberland S.; Woerpel K. A. Using Nucleophilic Substitution Reactions to Understand How a Remote Alkyl or Alkoxy Substituent Influences the Conformation of Eight-Membered Ring Oxocarbenium Ions. Org. Lett. 2004, 6, 4739–4741. 10.1021/ol047998d. [DOI] [PubMed] [Google Scholar]
- Baldock R. W.; Katritzky A. R. The Conformational Analysis of Saturated Heterocycles. Part XVIII. The Orientation of NH-Groups in Piperidines and Morpholines from Infrared Spectroscopy. J. Chem. Soc. B 1968, 1470–1477. 10.1039/j29680001470. [DOI] [Google Scholar]
- Sloan J. J.; Kewley R. Microwave spectrum of morpholine. Can. J. Chem. 1969, 47, 3453–3462. 10.1139/v69-571. [DOI] [Google Scholar]
- Kessler H. Detection of Hindered Rotation and Inversion by NMR Spectroscopy. Angew. Chem., Int. Ed. Engl. 1970, 9, 219–235. 10.1002/anie.197002191. [DOI] [Google Scholar]
- SenGupta S.; Maiti N.; Chadha R.; Kapoor S. Conformational analysis of morpholine studied using Raman spectroscopy and density functional theoretical calculations. Chem. Phys. Lett. 2015, 639, 1–6. 10.1016/j.cplett.2015.09.003. [DOI] [Google Scholar]
- Kim M.; Sim E.; Burke K. Understanding and reducing errors in density functional calculations. Phys. Rev. Lett. 2013, 111, 073003 10.1103/PhysRevLett.111.073003. [DOI] [PubMed] [Google Scholar]
- Kim Y.; Song S.; Sim E.; Burke K. Halogen and Chalcogen Binding Dominated by Density-Driven Errors. J. Phys. Chem. Lett. 2019, 10, 295–301. 10.1021/acs.jpclett.8b03745. [DOI] [PubMed] [Google Scholar]
- De Smedt J.; Vanhouteghem F.; Van Alsenoy C.; Geise H. J.; Van der Veken B.; Coppens P. Methyl Vinyl Ketone in the Gas Phase, Investigated by Electron Diffraction, Infrared Band Contour Analysis and Microwave Spectroscopy, Supplemented with Ab-Initio Calculations of Geometries and Force Fields. J. Mol. Struct. 1989, 195, 227–251. 10.1016/0022-2860(89)80171-1. [DOI] [Google Scholar]
- Baker J.; Jarzecki A. J.; Pulay P. Direct Scaling of Primitive Valence Force Constants: An Alternative Approach to Scaled Quantum Mechanical Force Fields. J. Phys. Chem. A 1998, 102, 1412–1424. 10.1021/jp980038m. [DOI] [Google Scholar]
- Park S. T.; Kim S. K.; Kim M. S. Observation of conformation specific pathways in the photodissociation of 1-iodopropane ions. Nature 2002, 415, 306–308. 10.1038/415306a. [DOI] [PubMed] [Google Scholar]
- Dian B. C.; Longarte A.; Zwier T. S. Conformational dynamics in a dipeptide after single-mode vibrational excitation. Science 2002, 296, 2369–2373. 10.1126/science.1071563. [DOI] [PubMed] [Google Scholar]
- Kim M. H.; Shen L.; Tao H.; Martinez T. J.; Suits A. G. Conformationally controlled chemistry: Excited-state dynamics dictate ground-state reaction. Science 2007, 315, 1561–1565. 10.1126/science.1136453. [DOI] [PubMed] [Google Scholar]
- Lee Y. R.; Kim M. H.; Kim H. L.; Kwon C. H. Conformer-specific photoionization and conformational stabilities of isobutanal revealed by one-photon mass-analyzed threshold ionization (MATI) spectroscopy. J. Chem. Phys. 2018, 149, 174302 10.1063/1.5051682. [DOI] [PubMed] [Google Scholar]
- Lee Y. R.; Kim K. E.; Kim M. H.; Kim H. L.; Kwon C. H. Formyl torsion and cationic structure of gauche conformer in isobutanal by conformer-specific VUV-MATI spectroscopy and Franck-Condon fitting. J. Chem. Phys. 2019, 151, 014304 10.1063/1.5110436. [DOI] [PubMed] [Google Scholar]
- Park S. M.; Choi J.; Kim H. L.; Kwon C. H. Conformer-specific VUV-MATI spectroscopy of methyl vinyl ketone: Stabilities and cationic structures of the s-trans and s-cis conformers. Phys. Chem. Chem. Phys. 2020, 22, 28383–28392. 10.1039/D0CP05782G. [DOI] [PubMed] [Google Scholar]
- Lee Y. R.; Kim H. L.; Kwon C. H. Determination of the cationic conformational structure of tetrahydrothiophene by one-photon MATI spectroscopy and Franck–Condon fitting. Phys. Chem. Chem. Phys. 2020, 22, 6184–6191. 10.1039/D0CP00073F. [DOI] [PubMed] [Google Scholar]
- Eom S. Y.; Lee Y. R.; Kwon C. H. Accurate conformational stability and cationic structure of piperidine determined by conformer-specific VUV-MATI spectroscopy. Phys. Chem. Chem. Phys. 2020, 22, 22823–22832. 10.1039/D0CP04407E. [DOI] [PubMed] [Google Scholar]
- Eom S. Y.; Kang D. W.; Kwon C. H. Conformational structure of cationic tetrahydropyran by one-photon vacuum ultraviolet mass-analyzed threshold ionization spectroscopy. Phys. Chem. Chem. Phys. 2021, 23, 1414–1423. 10.1039/D0CP05969B. [DOI] [PubMed] [Google Scholar]
- Eom S. Y.; Lee Y. R.; Park S. M.; Kwon C. H. Determination of the highest occupied molecular orbital and conformational structures of morpholine based on its conformer-specific photoionization dynamics. Phys. Chem. Chem. Phys. 2022, 24, 28477–28485. 10.1039/D2CP04112J. [DOI] [PubMed] [Google Scholar]
- Lipert R. J.; Colson S. D. Persistent spectral hole burning of molecular clusters in a supersonic jet. J. Phys. Chem. 1989, 93, 3894–3896. 10.1021/j100347a008. [DOI] [Google Scholar]
- Riehn Ch.; Lahmann Ch.; Wassermann B.; Brutschy B. IR depletion spectroscopy. A method for characterizing a microsolvation environment. Chem. Phys. Lett. 1992, 197, 443–450. 10.1016/0009-2614(92)85798-F. [DOI] [Google Scholar]
- Ebata T.; Fujii A.; Mikami N. Vibrational spectroscopy of small-sized hydrogen-bonded clusters and their ions. Int. Rev. Phys. Chem. 1998, 17, 331–361. 10.1080/014423598230081. [DOI] [Google Scholar]
- Bakker J. M.; Aleese L. M.; Meijer G.; von Helden G. Fingerprint IR spectroscopy to probe amino acid conformations in the gas phase. Phys. Rev. Lett. 2003, 91, 203003 10.1103/PhysRevLett.91.203003. [DOI] [PubMed] [Google Scholar]
- Choi C. M.; Choi D. H.; Heo J.; Kim N. J.; Kim S. K. Ultraviolet-ultraviolet hole burning spectroscopy in a quadrupole ion trap: Dibenzo[18]crown-6 complexes with alkali metal cations. Angew. Chem., Int. Ed. 2012, 51, 7297–7300. 10.1002/anie.201202640. [DOI] [PubMed] [Google Scholar]
- Matsuda Y.; Mikami N.; Fujii A. Vibrational spectroscopy of size-selected neutral and cationic clusters combined with vacuum-ultraviolet one-photon ionization detection. Phys. Chem. Chem. Phys. 2009, 11, 1279–1290. 10.1039/b815257h. [DOI] [PubMed] [Google Scholar]
- Han H.; Camacho C.; Witek H. A.; Lee Y. Infrared absorption of methanol clusters (CH3OH)n with n = 2–6 recorded with a time-of-flight mass spectrometer using infrared depletion and vacuum-ultraviolet ionization. J. Chem. Phys. 2011, 134, 144309 10.1063/1.3572225. [DOI] [PubMed] [Google Scholar]
- Park S. M.; Kwon C. H. Development and verification of conformer-specific vibrational spectroscopy. J. Phys. Chem. A 2021, 125, 9251–9258. 10.1021/acs.jpca.1c07162. [DOI] [PubMed] [Google Scholar]
- Park S. M.; Kwon C. H. Identification of individual conformers in C4H6O isomers using conformer-specific vibrational spectroscopy. RSC Adv. 2021, 11, 38240–38246. 10.1039/D1RA07397D. [DOI] [PMC free article] [PubMed] [Google Scholar]
- Park S. M.; Lee Y. R.; Kwon C. H. Conformational Structures of Neutral and Cationic Pivaldehyde Revealed by IR-Resonant VUV-MATI Mass Spectroscopy. Int. J. Mol. Sci. 2022, 23, 14777. 10.3390/ijms232314777. [DOI] [PMC free article] [PubMed] [Google Scholar]
- Sinha P.; Boesch S. E.; Gu C.; Wheeler R. A.; Wilson A. K. Harmonic vibrational frequencies: Scaling factors for HF, B3LYP, and MP2 methods in combination with correlation consistent basis sets. J. Phys. Chem. A 2004, 108 (42), 9213–9217. 10.1021/jp048233q. [DOI] [Google Scholar]
- Merrick J. P.; Moran D.; Radom L. An evaluation of harmonic vibrational frequency scale factors. J. Phys. Chem. A 2007, 111 (45), 11683–11700. 10.1021/jp073974n. [DOI] [PubMed] [Google Scholar]
- Zhan H.; Hu Y.; Wang P.; Chen J. Molecular structures of gas-phase neutral morpholine and its monohydrated complexes: Experimental and theoretical approaches. RSC Adv. 2017, 7, 6179–6186. 10.1039/C6RA26582K. [DOI] [Google Scholar]
- Stride J. A.; Dallin P. H.; Jayasooriya U. A. Intermolecular Fermi resonance. J. Chem. Phys. 2003, 119, 2747–2752. 10.1063/1.1587118. [DOI] [Google Scholar]
- Lindenmaier R.; Williams S. D.; Sams R. L.; Johnson T. J. Quantitative infrared absorption spectra and vibrational assignments of crotonaldehyde and methyl vinyl ketone using gas-phase mid-infrared, far-infrared, and liquid Raman spectra: s-cis vs s-trans composition confirmed via temperature studies and ab initio methods. J. Phys. Chem. A 2017, 121, 1195–1212. 10.1021/acs.jpca.6b10872. [DOI] [PubMed] [Google Scholar]
- Vedal D.; Ellestad O. H.; Klaboe P.; Hagen G. The vibrational spectra of piperidine and morpholine and their N-deuterated analogs. Spectrochim. Acta 1976, 32A, 877–890. 10.1016/0584-8539(76)80159-6. [DOI] [Google Scholar]
- Lee Y. R.; Park C. B.; Hwang J.; Sung B. J.; Kim H. L.; Kwon C. H. Observation of the ring-puckering vibrational mode in thietane cation. J. Phys. Chem. A 2017, 121, 1163–1167. 10.1021/acs.jpca.6b12724. [DOI] [PubMed] [Google Scholar]
- Choi S.; Kang T. Y.; Choi K.-W.; Han S.; Ahn D.-S.; Baek S. J.; Kim S. K. Ionization spectroscopy of conformational isomers of propanal: The origin band of the conformational preference. J. Phys. Chem. A 2008, 112, 5060–5063. 10.1021/jp800775s. [DOI] [PubMed] [Google Scholar]
- Oliver T. A. A.; King G. A.; Ashfold M. N. R. The conformer resolved ultraviolet photodissociation of morpholine. Chem. Sci. 2010, 1, 89–96. 10.1039/c0sc00119h. [DOI] [Google Scholar]
- Lee Y. R.; Kwon C. H. Innovative mass spectrometer for high-resolution ion spectroscopy. J. Chem. Phys. 2021, 155, 164203 10.1063/5.0066348. [DOI] [PubMed] [Google Scholar]
- Lee Y. R.; Kwon C. H. Determination of highest occupied molecular orbital and cationic structures of cyclopentanone using high-resolution vacuum ultraviolet mass-analyzed threshold ionization mass spectrometry. Bull. Korean Chem. Soc. 2022, 43, 636–644. 10.1002/bkcs.12508. [DOI] [Google Scholar]
- Frisch M. J.; Trucks G. W.; Schlegel H. B.; Scuseria G. E.; Robb M. A.; Cheeseman J. R.; Scalmani G.; Barone V.; Petersson G. A.; Nakatsuji H.; Li X.; Caricato M.; Marenich A. V.; Bloino J.; Janesko B. G.; Gomperts R.; Mennucci B.; Hratchian H. P.; Ortiz J. V.; Izmaylov A. F.; Sonnenberg J. L.; Williams-Young D.; Ding F.; Lipparini F.; Egidi F.; Goings J.; Peng B.; Petrone A.; Henderson T.; Ranasinghe D.; Zakrzewski V. G.; Gao J.; Rega N.; Zheng G.; Liang W.; Hada M.; Ehara M.; Toyota K.; Fukuda R.; Hasegawa J.; Ishida M.; Nakajima T.; Honda Y.; Kitao O.; Nakai H.; Vreven T.; Throssell K.; Montgometry J. A. Jr.; Peralta J. E.; Ogliaro F.; Bearpark M. J.; Heyd J. J.; Brothers E. N.; Kudin K. N.; Staroverov V. N.; Keith T. A.; Kobayashi R.; Normand J.; Raghavachari K.; Rendell A. P.; Burant J. C.; Iyengar S. S.; Tomasi J.; Cossi M.; Millam J. M.; Klene M.; Adamo C.; Cammi R.; Ochterski J. W.; Martin R. L.; Morokuma K.; Farkas O.; Foresman J. B.; Fox D. J.. Gaussian 16; Gaussian, Inc.: Wallingford, CT, 2016.
Associated Data
This section collects any data citations, data availability statements, or supplementary materials included in this article.