Abstract
The extent to which CD8+ T cells specific for other antigens expand to compensate for the mutational loss of the prominent DbNP366 and DbPA224 epitopes has been investigated using H1N1 and H3N2 influenza A viruses modified by reverse genetics. Significantly increased numbers of CD8+ KbPB1703+, CD8+ KbNS2114+, and CD8+ DbPB1-F262+ T cells were found in the spleen and in the inflammatory population recovered by bronchoalveolar lavage from mice that were first given the −NP−PA H1N1 virus intraperitoneally and then challenged intranasally with the homologous H3N2 virus. The effect was less consistent when this prime-boost protocol was reversed. Also, though the quality of the response measured by cytokine staining showed some evidence of modification when these minor CD8+-T-cell populations were forced to play a more prominent part, the effects were relatively small and no consistent pattern emerged. The magnitude of the enhanced clonal expansion following secondary challenge suggested that the prime-boost with the −NP−PA viruses gave a response overall that was little different in magnitude from that following comparable exposure to the unmanipulated viruses. This was indeed shown to be the case when the total response was measured by ELISPOT analysis with virus-infected cells as stimulators. More surprisingly, the same effect was seen following primary challenge, though individual analysis of the CD8+ KbPB1703+, CD8+ KbNS2114+, and CD8+ DbPB1-F262+ sets gave no indication of compensatory expansion. A possible explanation is that novel, as yet undetected epitopes emerge following primary exposure to the −NP−PA deletion viruses. These findings have implications for both natural infections and vaccines.
Immune escape variants are a common feature of some RNA virus infections (6, 16). Even though most such mutational change is associated with the antibody response (20, 42), effector CD8+ T cells can supply the necessary selective pressure. Individuals with subclinical human immunodeficiency virus (HIV) infection may suddenly show evidence of increased viral load following the emergence of mutants that no longer express a key peptide recognized by controlling CD8+ T cells (13, 14). Evidence of T-cell-induced in vivo variation is also found experimentally with a model of chronic neurological disease caused by mouse hepatitis virus (21). However, even the small RNA viruses generally express a spectrum of immunogenic peptides that can be presented in the context of one or another of the four or more different major histocompatibility complex class I (MHCI) glycoproteins expressed in any healthy person or MHC heterozygous mouse (4, 17, 38). Why is it, then, that there can be an apparent failure to compensate for the loss of an immunodominant peptide and the associated CD8+-T-cell-mediated control?
The influenza A viruses vary rapidly under antibody-mediated selection pressure (24), though they do not normally establish persistent infections in mammalian hosts. Experiments with T-cell-receptor (TCR) transgenic mice have shown that influenza virus escape variants can emerge in the face of what is essentially a monoclonal CD8+-T-cell response (26). This may not be a common occurrence in nature, as influenza viruses can also be controlled by the humoral response in the absence of CD8+-T-cell effector function (10, 28, 31). Even so, though neutralizing antibody would likely eliminate any escape variants selected by the cytotoxic T lymphocytes (CTLs), the internal proteins that tend to provide the peptide targets for T-cell recognition can show evidence of naturally occurring mutation (5). Thus, it is important to understand in this scenario whether other epitopes would compensate for the mutation and function to clear the virus from the site of infection. Recent advances in technology with the influenza A viruses have made it possible to generate mutations that disable peptide binding in the groove of the MHCI glycoprotein (19), allowing analysis of the question whether minor CD8+-T-cell responses can compensate for the loss of a major epitope.
The reverse genetics approach (18, 37) was used to generate variants of PR8 (PR, H1N1) and HK (HK, H3N2) influenza A viruses with substitutions in the nucleoprotein (NP366-374, ASNENMETM) and acid polymerase (PA224-233, SSLENFRAYV) peptides that bind the H2Db MHCI glycoprotein (3, 32). These mutations resulted in the replacement of the asparagine at the fifth position of both epitopes with glutamine (N5Q). Viruses were thus generated with single mutations in NP or PA and double mutations in NP and PA. These PR and HK mutants (−NP, −PA, and −NP−PA) grow both in tissue culture and in C57BL/6J (B6) mouse lung at titers comparable to those found following infection with the wild-type (WT) viruses, though they are much more likely to cause fatal infection in antibody-negative μMT mice (37). Furthermore, these mutants did not cause mortality in BALB/c (H2d) mice, as these viruses were engineered to disrupt only the NP and PA peptides that bind to H2Db (37). This panel of PR−NP, PR−PA, and PR−NP−PA viruses was used in prime-boost experiments (37) with the homologous HK variants to analyze the characteristics of the secondary CD8+-T-cell response to the residual polymerase 1 (PB1703-711, SSYRRPVGI) determinant presented by H2Kb (4). There was some augmentation of KbPB1703-specific T-cell numbers in mice that were first immunized intraperitoneally (i.p.) with the PR8−NP−PA virus and then infected intranasally (i.n.) after a month or more with the HK−NP−PA virus. However, the KbPB1703-specific CD8+ set never compensated numerically for the loss of the CD8+ DbNP366+ and CD8+ DbPA224+ populations that predominate following the WT HK-RG→PR-RG challenge.
This experimental approach (37) has now been extended to look further at possible compensation by CD8+ T cells specific for other known, minor epitopes (8, 36), following secondary challenge. The consequences of primary infection are presented for the first time, and the possibility that an initial exposure to these deletion viruses modifies the response profile following WT challenge is investigated. In addition, the question is asked whether the quality of the CD8+-T-cell response to minor epitopes changes in the absence of the immunodominant effector populations.
MATERIALS AND METHODS
Mice, viruses, and infection.
Female B6 mice were purchased from the Jackson Laboratory (Bar Harbor, Maine), and CD4+-T-cell-deficient MHC class II−/− mice (15) were bred at St. Jude Children's Research Hospital. All were held under specific-pathogen-free conditions at St. Jude Children's Research Hospital, and the B6 mice were first infected at 8 to 10 weeks of age. The generation and preparation of WT PR and mutant (PR−NP, PR−PA, and PR−NP−PA) recombinant viruses from the A/Puerto Rico/8/34 plasmids by using the eight-plasmid reverse genetics system and the subsequent replacement of the H1N1 PR8 hemagglutinin (H) and neuraminidase (N) plasmids (WT HK, HK−NP, HK−PA, and HK−NP−PA) with those from the H3N2 A/Aichi/2/68 (HK) virus have been described previously (18, 37). Primed (PR variants i.p. at 108 50% egg infective doses [EID50]) and naïve mice were first anesthetized by i.p. injection of 2,2,2-tribromoethanol (Avertin) and then infected i.n. with 107 EID50 of the HK viruses (1). The mice were anesthetized again at time of sampling and then exsanguinated by section of the axillary artery. The spleens were removed, and inflammatory cell populations were recovered from the infected respiratory tract by bronchoalveolar lavage (BAL).
Flow cytometry, tetramer staining, and peptide stimulation.
Virus-specific CD8+-T-cell responses were analyzed by flow cytometry (11). Lymphocytes from disrupted spleens or mediastinal lymph nodes (MLN) were enriched for CD8+ T cells by incubation with monoclonal antibodies to CD4 (GK1.5) and MHC class II glycoprotein (M5/114.15.2), followed by anti-rat and anti-mouse immunoglobulin G-coated magnetic beads (Dynal A.S., Oslo, Norway). This routinely gave a >90% depletion of CD4+-T-cell numbers when measured with a non-cross-reactive monoclonal antibody (RM4-4) to CD4. Inflammatory cell populations recovered from the pneumonic lung by BAL were depleted of macrophages by incubation on plastic for 1 h at 37°C. The DbNP366 and DbPA224 tetramers were made by complexing H2Db with the immunogenic NP (ASNENMETM) or PA (SSLENFRAYV) peptide (3, 32). The KbPB1703 and KbNS2114 tetramers utilized H2Kb and the polymerase 1 (PB1, SSYRRPVGI) or nonstructural protein 2 (NS2114-121, RTFSFQLI) peptide (4, 36). Lymphocytes were incubated for 60 min at room temperature with the phycoerythrin-conjugated tetramers in phosphate-buffered saline-bovine serum albumin-azide followed by anti-CD8α-PerCP Cy5.5 (PharMingen, San Diego, Calif.). Other CD8+ T cells were analyzed by the peptide stimulation-cytokine (PepC) assay. Lymphocytes were first incubated with 1 μM NP, PA, PB1, NS2, matrix protein (M1128-135, MGLIYNRM), or PB1-F262-70 (LSLRNPILV) peptide (8, 36) for 5 h in the presence of 5 μg of brefeldin A (Epicentre Technologies, Madison, Wis.)/ml and then fixed and stained for CD8α, gamma interferon (IFN-γ; PE-XMG 1.2), and tumor necrosis factor alpha (TNF-α; APC-MP6-XT22). The data were acquired on a Becton Dickinson FACSCalibur and analyzed using CELLQuest software (Becton Dickinson Immunocytometry Systems, San Jose, Calif.).
ELISPOT analysis.
The ELISPOT protocol was used to estimate the total size of IFN-γ-producing CD8+-T-cell populations in spleen following stimulation with virus-infected antigen-presenting cells (APCs). Plates were coated overnight with 10 μg of purified anti-IFN-γ antibody (BD Biosciences)/ml and then washed four times and blocked for at least 30 min at 37°C with 200 μl of complete medium. Serial dilutions of purified, splenic CD8+ T cells from virus-infected B6 mice were then plated with APCs generated by suspending (for 1 h at 37°C) naïve spleen cells from naïve, uninfected B6 or MHC class II−/− mice in 1 ml of allantoic fluid from wtHKx31RG virus-infected hen eggs, followed by incubation for a further 3 h at 37°C after the addition of 10 ml of complete medium. Cell numbers were adjusted to plate 5 × 10⁵ stimulator cells/well. The plates were washed thoroughly after 48 h of incubation, biotin-conjugated anti-IFN-γ antibody was added at a concentration of 5 μg/ml, and the reaction mixture was incubated overnight. Streptavidin-alkaline phosphatase conjugate (Dako) was then added at a dilution of 1:500 in 100 μl for 1 h, washed, and developed with a 5-bromo-4-chloro-3-indolylphosphate-nitroblue tetrazolium (BCIP-NBT) solution until spots were visible. The plates were washed again, dried, and counted on a Zeiss ELISPOT reader.
Data set and statistical analysis.
Many of the data are expressed as virus-specific CD8+-T-cell numbers, which were calculated from the percentage of cells staining with tetrameric reagents or IFN-γ (PepC assay) and the percentage of CD8α+ and the total cell counts for the enriched spleen, MLN, or BAL sample populations that were analyzed by flow cytometry. The results are generally for groups of five mice. The findings for those infected with the mutant (−NP, −PA, and −NP−PA) viruses were compared (generally by Student's t test) with the numbers generated following exposure to WT virus. Significant differences, P ≤ 0.05, are identified by an asterisk in the figures.
RESULTS
The basic aim of these experiments was to determine whether the increase in numbers that we saw previously (37) for the CD8+ KbPB1703+ set in the absence of concurrent, secondary CD8+ DbNP366+ and CD8+ DbPA224+ responses in B6 (H2b) mice can be augmented by the expansion of other, minor virus-specific CD8+ populations. The analysis also asked whether the quality of these minor responses changes when the predominant CD8+ DbNP366+ and CD8+ DbPA224+ T cells are not involved. A separate HK→PR prime and boost study (data not shown) with these −NP, −PA, and −NP−PA viruses in BALB/c (H2d) mice confirmed that there was no difference in the prevalence of T cells specific for the NP147-155 (TYQRTRALV) peptide presented by H2Kd. This establishes that the N5Q substitution that prevents binding of the ASNENMETM peptide to H2Db modifies neither the immunogenicity of other NP regions nor the basic pathogenesis of the infectious process in the absence of the H2Db MHCI glycoprotein.
Analysis of the recall response.
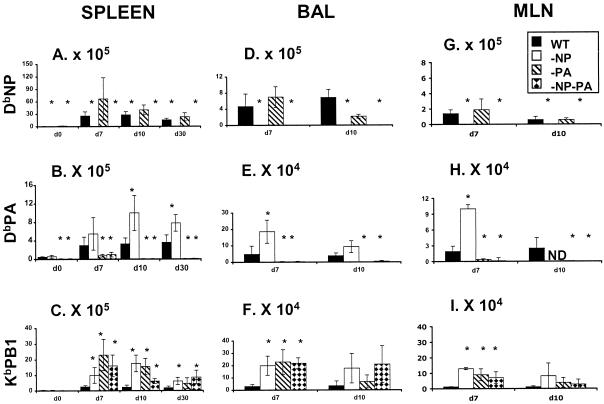
The compensatory clonal expansion above the values for the WT HK→PR challenge (solid bars, Fig. 1) that we saw previously for the KbPB1703-specific set following the loss of CD8+ DbNP366+ and CD8+ DbPA224+ T cells in mice primed (PR) and boosted (HK) with the variant (open bars, −NP; diagonally striped bars, −PA; diamond-patterned bars, −NP−PA, Fig. 1) influenza A viruses was found consistently for tetramer staining of the CD8+ set in spleen, BAL sample, and MLN populations analyzed on day 7 at the peak of the secondary response (Fig. 1C, F, and I). This increase in CD8+ KbPB1703+-T-cell numbers was still apparent in the spleen on day 10 and day 30, though not in the BAL sample or the MLN. The inflammatory process in the BAL sample cells begins to resolve by day 10, while activated-memory CD8+ T cells present on day 10 and the few remaining cells on day 30 are likely to have down-regulated expression of the CD62L lymph node homing receptor and will thus tend to be found in the spleen, where CD62L does not play a part in lymphocyte localization (33). There was also a persistent increase in the numbers of splenic CD8+ DbPA224+ T cells in the mice that were given the PR−NP and HK−NP viruses (Fig. 1B and E). This means that, because the spleen contains a very high proportion of the peripheral CD8+-T-cell pool, the size of both the CD8+ KbPB1703+ and CD8+ DbPA224+ memory populations is substantially increased (Fig. 1B and C) over the values found in the WT HK→PR mice. By contrast, no significant change in magnitude was found at any time point for the immunodominant CD8+ DbNP366+ set in the HK−PA→PR−PA challenge group (Fig. 1A, D, and G).
FIG. 1.
Extent of compensation by CD8+ DbPA224+ and CD8+ KbPB1703+ T cells in mice primed and challenged with the mutant viruses. The B6 mice were infected i.p. (108 EID50) with PR (H1N1) and challenged i.n. (107 EID50) with HK (H3N2) RG (solid bars) and −NP (open bars), −PA (diagonally striped bars), and −NP−PA (diamond-patterned bars) mutant viruses. Spleen (A to C), BAL sample (D to F), and MLN (G to I) populations were sampled on day 0 (spleen only, at 8 weeks after i.p. priming), day 7, day 10, and day 30 (spleen only) after i.n. challenge. The numbers of virus-specific CD8+ T cells were calculated from total cell counts, and percent values were determined by staining with the DbNP366 (A, D, and G), DbPA224 (B, E, and H) and KbPB1703 (C, F, and I) tetramers. It is important to note that the scales for the y axis differ, reflecting the number of cells recovered from the site sampled. The results are expressed as means ± standard deviations, and statistical significance (relative to the HK-WT challenge) was determined by Student's t test (*, P ≤ 0.05, n = 5).
This analysis of CD8+ KbPB1703+-T-cell prevalence by tetramer staining (Fig. 1) was done in parallel with a peptide stimulation-IFN-γ (PepC) study that added the capacity to measure the KbPB1703-, KbNS2114-, and KbM1128-specific responses (Table 1; Fig. 2). The numbers of spleen memory T cells specific for all epitopes were ≤1.0% at 8 weeks after i.p. priming with the PR viruses (day 0, Table 1). The smallest values were consistently found for the CD8+ populations responding to the NS2114-121 and M1128-135 peptides, reinforcing the impression that KbNS2114 and KbM1128 are indeed minor epitopes (day 0, Table 1).
TABLE 1.
Analysis of IFN-γ+ CD8+ T cells from spleen in a secondary response following homologous challengea
| Day | Virus | % IFN-γ+ CD8+ T cells (mean ± SD)
|
||||
|---|---|---|---|---|---|---|
| NP | PA | PB1 | NS2 | M1 | ||
| 0 | WT | 0.6 ± 0.1 | 0.3 ± 0.08 | 0.4 ± 0.1 | 0.07 ± 0.04 | 0.01 ± 0.02 |
| −NP | 0.02 ± 0.03* | 0.24 ± 0.07 | 0.3 ± 0.15 | 0.07 ± 0.03 | 0.01 ± 0.02 | |
| −PA | 1.0 ± 0.1 | 0.01 ± 0.03* | 0.15 ± 0.05 | 0.08 ± 0.05 | 0.01 ± 0.01 | |
| −NP−PA | 0.04 ± 0.03* | 0.02 ± 0.03* | 0.16 ± 0.1 | 0.08 ± 0.06 | 0.02 ± 0.02 | |
| 7 | WT | 10.9 ± 0.4 | 1.0 ± 0.5 | 1.5 ± 0.6 | 0.5 ± 1.3 | 0.14 ± 0.07 |
| −NP | 0.2 ± 0.1* | 2.7 ± 1.0 | 5.6 ± 1.8* | 1.7 ± 0.8 | 0.17 ± 0.06 | |
| −PA | 13.4 ± 4.9 | 0.5 ± 0.09* | 4.3 ± 0.9* | 3.1 ± 1.3* | 0.16 ± 0.15 | |
| −NP−PA | 0.2 ± 0.06* | 0.4 ± 0.3* | 3.8 ± 1.0* | 4.69 ± 1.8* | 0.48 ± 0.40 | |
| 10 | WT | 15.2 ± 6.1 | 1.3 ± 0.1 | 2.3 ± 1.0 | 0.9 ± 0.2 | 0.05 ± 0.02 |
| −NP | 0.2 ± 0.1* | 4.1 ± 0.8* | 10.0 ± 2.9 | 4.5 ± 0.7* | 0.3 ± 0.2* | |
| −PA | 13.4 ± 1.5 | 0.1 ± 0.09* | 6.2 ± 2.0 | 4.8 ± 1.0* | 0.4 ± 0.4 | |
| −NP−PA | 0.03 ± 0.01* | 0.1 ± 0.1* | 3.4 ± 0.7 | 4.8 ± 1.3* | 0.3 ± 0.2 | |
| 30 | WT | 17.5 ± 9.0 | 2.0 ± 0.8 | 3.1 ± 1.3 | 1.7 ± 1.0 | 0.07 ± 0.05 |
| −NP | 0.1 ± 0.02* | 4.9 ± 1.7* | 9.3 ± 1.5* | 3.7 ± 2.3* | 0.05 ± 0.04 | |
| −PA | 14.6 ± 4.7 | 0.5 ± 0.1* | 4.1 ± 2.0 | 1.3 ± 0.9 | 0.05 ± 0.03 | |
| −NP−PA | 0.1 ± 0.02* | 0.3 ± 0.1* | 4.7 ± 2.6 | 4.6 ± 1.3* | 0.2 ± 0.1 | |
Ten-week-old, female B6 mice were primed i.p. with 108 EID50 of PR8 WT and mutants per mouse. The mice were challenged i.n. with homologous X31 viruses at 107 EID50 per mouse. Spleens were harvested on days 0 (8 weeks after priming), 7, 10, and 30, and the IFN-γ+ assay was performed as described in Materials and Methods. The significant differences from the WT are indicated as * (P < 0.05).
FIG. 2.
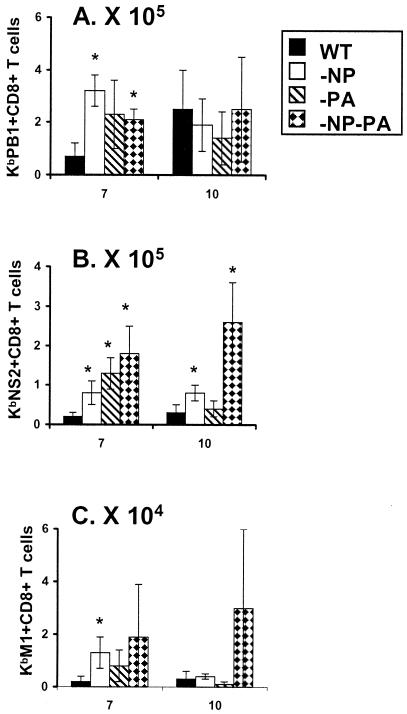
Localization of CD8+ KbPB1703+, CD8+ KbNS2114+, and CD8+ KbM1128+ IFN-γ+ T cells to the respiratory tract of virus secondarily challenged mice. This is the same experiment shown in Fig. 1. Individual BAL samples were stimulated with 1 μM concentrations of the PB1703-711 (A), NS2114-121 (B), and M1128-135 (C) peptides for 5 h and stained for IFN-γ expression (PepC assay). The numbers of IFN-γ+ CD8+ T cells were calculated and expressed as means ± standard deviations. Differences from the WT group are indicated by an asterisk (P ≤ 0.05, by Student's t test).
The spleen response to KbM1128 was minimal throughout and was not significantly increased (over the WT HK→PR challenge) for the mutant viruses (days 7 to 30, Table 1). However, though stimulation with the NS2114-121 peptide tended to elicit relatively small numbers of CD8+ T cells in mice primed and boosted with the WT viruses, the KbNS2114-specific sets found at all time points for the HK−NP−PA→PR−NP−PA challenge were at least comparable in size to the KbPB1703-specific populations (Table 1). Furthermore, even in the WT HK→PR mice, substantial numbers of memory KbNS2114-specific T cells were found on day 30 (Table 1).
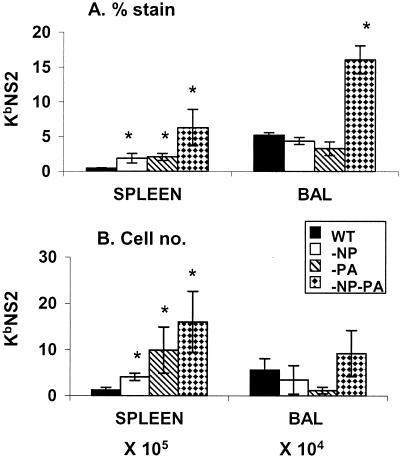
The same was true when we looked at the KbNS2114- and KbPB1703-specific sets in the day 7 BAL sample populations (Fig. 2A and B). Both were consistently and substantially increased in number for the mice given the mutant viruses. The profile for KbM1128 was similar, but the T-cell numbers were 5 to 10 times lower than those found for the other epitopes, and the counts were also more variable (Fig. 2C). The decision was thus taken not to pursue the KbM1128 analysis further, though we did proceed to make the KbNS2114 tetramer. In a further experiment, tetramer analysis of the secondary response to KbNS2114 on day 10 after priming and challenge with the mutant and WT viruses (Fig. 3) confirmed what was seen previously with the IFN-γ study (Table 1; Fig. 2). Overall, there seems to be a good measure of compensation by the expansion of other epitope-specific CD8+-T-cell populations in the secondary HK−NP−PA→PR−NP−PA response.
FIG. 3.
Tetramer analysis of the KbNS2114-specific set in spleen and BAL fluid populations from secondarily challenged mice. The i.p. priming with PR viruses and i.n. challenge with HK viruses were done exactly as described in the legend to Fig. 1, and lymphocyte populations were sampled on day 10 after homologous challenge. The results (means ± standard deviations, n = 5) are expressed as the percentage of cells staining (A) and the numbers of epitope-specific cells (B). Significant differences from the WT group are indicated by an asterisk (P ≤ 0.05).
Reversing the prime-boost conditions.
The experimental protocol was then varied by first giving the HK viruses i.n., followed 30 days later by i.p. challenge with a high dose of the PR viruses (Table 2). Changing from PR i.p.→HK i.n. to HK i.n.→PR i.p. reversed the sequence of lytic and nonlytic infection in this prime-boost strategy. Though there is substantial replication of the virus in the lung and upper airways following i.n. challenge, virus given i.p. is thought to induce only a single cycle of protein synthesis with little (if any) virus production and consequent infection of other cells. The difference reflects the fact that cleavage of the influenza virus hemagglutinin to make mature virus requires the involvement of a protease that is restricted in distribution to the respiratory epithelium (22, 40). This change in regimen would thus limit the availability of the antigen in the secondary challenge with the PR viruses. Again, the response to KbM1128 was minimal, while the responses to KbPB1703 and KbNS2114 were significantly enhanced in the mice given the mutant viruses (Table 2).
TABLE 2.
Characteristics of the response in mice primed i.n. and challenged with WT and mutant virusesa
| Virus | % IFN-γ+ CD8+ T cells (mean ± SD)
|
||||
|---|---|---|---|---|---|
| NP | PA | PB1 | NS2 | M1 | |
| WT | 7.4 ± 3.2 | 0.7 ± 0.3 | 1.4 ± 0.5 | 0.3 ± 0.1 | 0.3 ± 0.5 |
| −NP | 0.01 ± 0.01* | 4.9 ± 1.6* | 7.9 ± 1.6* | 2.97 ± 0.9* | 0.5 ± 0.4 |
| −PA | 6.5 ± 0.8 | 0.1 ± 0.03* | 3.4 ± 0.9* | 2.76 ± 1.1* | 0.3 ± 0.09 |
| −NP−PA | 0.04 ± 0.03* | 0.09 ± 0.06* | 4.8 ± 1.2* | 2.97 ± 1.1* | 0.7 ± 0.2 |
B6 mice were primed i.n. with 106 EID50 of HK WT and mutants (−NP, −PA, and −NP−PA). Viruses were then challenged 30 days later i.p. with 108 EID50 of the homologous PR viruses. The spleens were harvested on day 10 and analyzed by PepC assay as described in Materials and Methods. Significant differences from the HK-WT are indicated as * (P < 0.05).
Primary response.
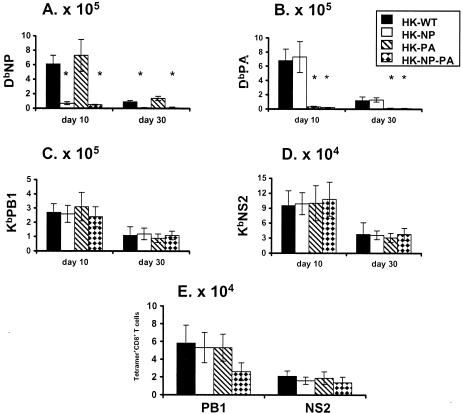
The experiments so far (37) (Tables 1 and 2; Fig. 1 to 3) focused on the recall of virus-specific CD8+-T-cell memory, without presenting a systematic analysis of what happens after primary i.n. exposure to the WT HK, HK−NP, HK−PA, and HK−NP−PA viruses. Unlike the situation following secondary challenge (Fig. 1 to 3; Table 1), there was no enhancement of CD8+ KbPB1703+- or CD8+ KbNS2114-T-cell numbers at the peak of the primary response in spleen on day 10 or in the early stage of memory on day 30 (Fig. 4A to D). This was also true for the BAL sample cells on day 10 (Fig. 4E). The compensatory effect (Fig. 1 to 3; Table 1) found for the recall response following i.n. challenge with the homologous, mutant HK and PR viruses was thus not seen for these individual epitope-specific sets following primary infection (Fig. 4).
FIG. 4.
Characteristics of the primary virus-specific CD8+-T-cell response. The B6 mice were infected i.n. with 107 EID50 of the HK variants. The spleen (A to D) and BAL fluid (E) populations were sampled on day 10 at the peak of the acute response, and the early phase of memory was measured on day 30 (A to D) for the spleen. The numbers of tetramer+ CD8+ T cells were calculated from total cell counts and the percentages of cells staining. The results are expressed as means ± standard deviations, and significant differences from the HK-WT values are indicated by an asterisk (P ≤ 0.05).
Challenge with WT virus.
The question was then asked whether priming with the mutant viruses in any way modifies the response following a WT challenge, a situation that would occur following natural infection if such viruses were being used in a vaccination strategy. Mice were first exposed i.p. to the panel of PR viruses. All were later infected i.n. with WT HK virus. In general, the CD8+ KbPB1703+ response in the WT HK-infected mice that had been primed with the PR−NP, PR−PA, and PR−NP−PA viruses was not significantly increased over that found for the WT HK→PR group (Table 3). This is in accord with the observation that priming with the mutant viruses does not either increase the magnitude of the primary response (Fig. 4) or result in persistent memory (day 0, Fig. 1) of the KbPB1703 epitope. The number of CD8+ KbNS2114+ T cells in spleen was, however, significantly enhanced in the PR−NP−PA mice challenged i.n. with the WT HK virus (last row, Table 3), but the counts were still small compared with the secondary response to DbNP366 in the mice primed with WT PR and PR−PA (DbNP366 epitope, Table 3). However, though a contemporary comparison was not done in age-matched, naïve mice, the primary responses to both DbNP366 and DbPA224 in the PR−NP, PR−PA, and PR−NP−PA-primed mice looked to be small (compare results in Table 3 and Fig. 4), suggesting that secondary responses to both major and minor epitopes can diminish the magnitude of a concurrent primary response.
TABLE 3.
Response in mice primed i.p. with the mutant viruses and then challenged i.n. with WT virusa
| Virus | Epitope | No. of tetramer+ CD8+ T cells (mean ± SD)
|
|||
|---|---|---|---|---|---|
| Expt 1
|
Expt 2
|
||||
| Spleen (106) | BAL fluid (105) | Spleen (105) | BAL fluid (105) | ||
| WT (2) | DbNP366 | 7.4 ± 3.0 | 10 ± 8.0 | 9.2 ± 4.1 | 17 ± 11 |
| −NP (1) | 0.1 ± 0.05* | 0.09 ± 0.07* | 0.6 ± 0.03* | 0.02 ± 0.02* | |
| −PA (2) | 5.6 ± 4.0 | 13 ± 7.0 | 13.1 ± 8 | 1.5 ± 7.0 | |
| −NP−PA (1) | 0.2 ± 005* | 0.1 ± 0.07* | 0.3 ± 0.06* | 0.1 ± 0.03* | |
| WT (2) | DbPA224 | 1.2 ± 0.7 | 1.1 ± 0.7 | 2.4 ± 0.7 | 2.0 ± 0.7 |
| −NP (2) | 0.7 ± 0.3 | 3.6 ± 3.0* | 8.6 ± 1.9* | 0.7 ± 0.9 | |
| −PA (1) | 0.08 ± 0.07* | 0.006 ± 0.003* | 0.2 ± 0.09* | 0.08 ± 0.08 | |
| −NP−PA (1) | 0.1 ± 0.06* | 0.003 ± 0.002* | 0.5 ± 0.1* | 0.1 ± 0.04* | |
| WT (2) | KbPB1703 | 1.3 ± 0.4 | 0.7 ± 0.5 | 1.4 ± 0.8 | 1.7 ± 0.9 |
| −NP (2) | 0.6 ± 0.5 | 0.5 ± 0.4 | 2.8 ± 0.4 | 0.1 ± 0.1* | |
| −PA (2) | 0.3 ± 0.3 | 0.2 ± 0.1 | 1.1 ± 0.9 | 0.6 ± 0.4 | |
| −NP−PA (2) | 1.3 ± 0.5 | 0.2 ± 0.1 | 2.1 ± 0.9 | 1.4 ± 0.7 | |
| WT (2) | KbNS2114 | 0.3 ± 0.1 | 0.3 ± 0.2 | 0.3 ± 0.1 | 1.2 ± 0.9 |
| −NP (2) | 0.1 ± 0.08 | 0.2 ± 0.1 | 1.6 ± 0.5 | 0.08 ± 0.09 | |
| −PA (2) | 0.1 ± 0.1 | 1.0 ± 1.2 | 0.8 ± 0.4 | 0.3 ± 0.2 | |
| −NP−PA (2) | 1.1 ± 0.08* | 2.2 ± 1.2* | 1.6 ± 0.7* | 1.3 ± 0.4 | |
B6 mice mice were primed i.p. with 108 EID50 of the PR WT and mutant (−NP, −PA, and −NP−PA) viruses and then challenged i.n. with 107 EID50 of the WT HKx31 virus. The spleen and BAL fluid populations were harvested on day 9 (experiment 1) or day 8 (experiment 2). The mice in experiment 1 were challenged 2 months after priming, while those in experiment 2 were left for 7 months prior to challenge. The numbers in parentheses indicate the type of response generated for each virus-specific epitope following the WT virus challenge. The numbers of tetramer CD8+ T cells were calculated from the percentages of cells staining and the total cell counts. Significant differences from the WT values are indicated as * (P < 0.05).
Quality of the compensatory secondary response.
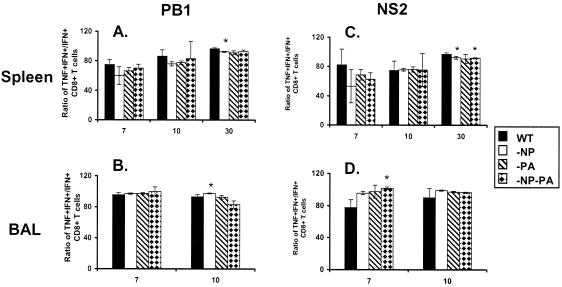
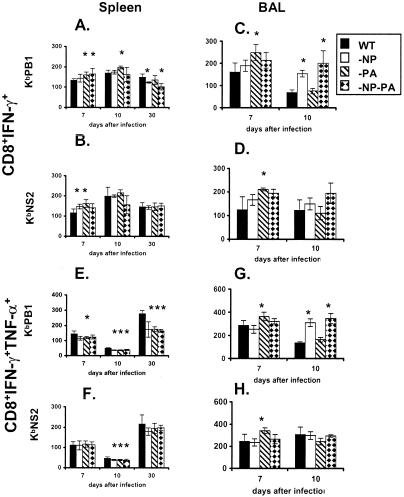
The analysis of quality is based on the cytokine expression profiles following short-term peptide stimulation (23, 29). The two measures were the percent TNF-α+ cells within the CD8+ IFN-γ+ cell set (Fig. 5) and the intensity of IFN-γ (Fig. 6A to D) and TNF-α (Fig. 6E to H) staining determined as mean fluorescence intensity (MFI). The MFI value can be considered to reflect the magnitude of peptide-induced cytokine production. The great majority of the KbNS2114- and KbPB1703-specific CD8+ IFN-γ+ T cells recovered from the spleen and BAL fluid compartments of secondarily challenged mice were found to produce TNF-α (Fig. 5). This profile was not substantially modified for the mutant viruses, though it was consistently the case that the prevalence of TNF-α+ cells in spleen (Fig. 5A and C) was at maximum frequency on day 30, in accord with previous observations on the maturation of “functional avidity” with time (23, 30). The values for the BAL cells recovered from the respiratory tract, the site of high antigen load in this influenza model, were always close to maximum frequency (Fig. 5C and D).
FIG. 5.
Prevalence of IFN-γ+ TNF-α+ CD8+ KbPB1703+ and CD8+ KbNS2114+ T cells in a secondary response. The mice were primed and challenged as described in the legend to Fig. 1. The levels of TNF-α+ and IFN-γ+ production were determined by intracellular cytokine staining subsequent to peptide stimulation (see legend to Fig. 2), and the IFN-γ+ TNF-α+/IFN-γ+ ratios were determined for the BAL fluid and spleen populations. The results are expressed as means ± standard deviations, and significant differences from the findings for the WT group are indicated by an asterisk (P ≤ 0.05).
FIG. 6.
Intensity of IFN-γ and TNF-α staining for peptide-stimulated CD8+ KbPB1703+ and CD8+ KbNS2114+ T cells. The MFI values are shown for IFN-γ+ (A to D) and TNF-α+ (E to H) in T cells from spleen (A, B, E, and F) and BAL samples (C, D, G, and H). The statistical analysis compares values significantly different from those for the WT, and the asterisk denotes P ≤ 0.05.
The intensity of MFI staining was significantly higher for spleen cells recovered on day 7 from mice given some of the deletion viruses (day 7, Fig. 6A and B), but the effects were not large and were not mirrored by the profiles for TNF-α (day 7, Fig. 6E and F). The MFI values for TNF-α (but not IFN-γ) then fell substantially on day 10 (day 10, Fig. 6; compare panels E and F and panels A and B), which could reflect that TNF-αhigh cells are being recruited to the virus-infected lung. The intensity of staining was more than restored by day 30 (Fig. 6E and F), though the CD8+ KbPB1703+ memory T cells from mice given the mutants were consistently making less cytokine than those induced by the prime-boost with the WT viruses (day 30, Fig. 6A and E). However, the same effect was not seen for the CD8+ KbNS2114 set (day 30, Fig. 6B and F). The most striking finding for the inflammatory CD8+ T cells recovered by BAL was that the intensity of both IFN-γ and TNF-α staining on day 7 was greatest in the mice given the HK−PA→PR−PA challenge (day 7, Fig. 6C, D, G, and H), while the highest levels of both cytokines for CD8+ KbPB1703+ (but not CD8+ KbNS2114+) T cells recovered from the resolving response on day 10 were found for the mice given the mutant NP viruses (day 10, Fig. 6; compare panels C and G and panels D and H). Overall, there was no substantial change in the quality of the acute response or memory for these minor T-cell populations expanded in the absence of the major subsets.
Extent of compensation in primary and secondary responses.
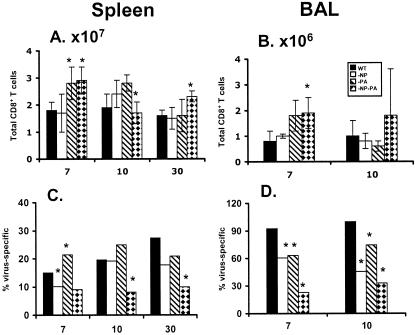
The findings from the tetramer and IFN-γ PepC assays indicated that the size of the residual epitope-specific CD8+-T-cell populations increased following secondary (Tables 1 and 2; Fig. 1 to 3), but not primary (Fig. 4), challenge with the −NP−PA viruses. The data presented in part in Table 1 and Fig. 2 were thus used to estimate the total size of the secondary CD8+-T-cell response (Fig. 7), the aim being to determine the overall extent of compensation while at the same time addressing the possibility that T cells specific for some other, substantial epitope are not being measured. The total CD8+-T-cell counts in the HK−NP−PA→PR−NP−PA group were significantly increased for day 7 in the spleen and BAL sample (Fig. 7A and B), while the opposite effect was seen for the relative prevalence (percentages) of virus-specific cells in the day 7 and day 10 BAL sample populations (Fig. 7D). Overall, it seemed that the compensation effect in the secondary response was partial.
FIG. 7.
Comparison of the prevalence of epitope-specific and nonspecific CD8+ T cells. The total CD8+-cell counts (A and B) were subdivided to compare the size of the virus-specific (C and D) IFN-γ+ CD8+-T-cell sets from Table 1. (A and C) Spleen populations; (B and D) BAL sample populations. The asterisk indicates P ≤ 0.05, where the −NP, −PA, and −NP−PA groups were compared to WT by a two-sided exact P value for the two-sample Wilcoxon rank-sum test.
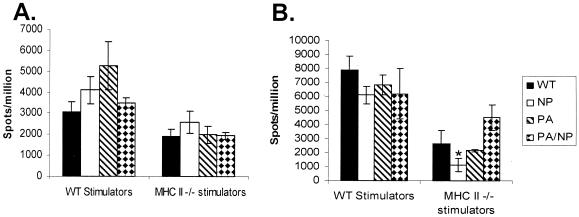
It is, however, also possible that other minor epitopes (41) are being expanded in the HK−NP−PA→PR−NP−PA response. ELISPOT analysis after stimulation with virus-infected cells was thus used to estimate the total size of both primary (HK viruses i.n.) and secondary (PR viruses i.p. and then HK viruses i.n.) virus-specific CD8+-T-cell responses in spleen (Fig. 8). Though ELISPOT analysis with virus-infected APCs is generally less sensitive than the flow-cytometric PepC assays, the results indicated that the level of both primary (Fig. 8A) and secondary (Fig. 8B) response made by CD4-depleted virus-immune spleen cells following stimulation with HK-infected stimulators was no different for the WT RG and −NP−PA viruses. This was also true when MHC class II−/− APCs were used to obviate any possibility that the result was confounded by residual CD4+-T-cell responders, though the level of stimulation was somewhat lower, reflecting, perhaps, that dendritic cells from CD4+-T-cell-deficient mice do not function optimally due to lack of “background conditioning” (27) by other helper T-cell responses.
FIG. 8.
ELISPOT analysis of the influenza virus-specific CD8+-T-cell response. The total virus-specific response assay was performed following primary (A) or secondary (B) infection with the WT, −NP, −PA, and −NP−PA influenza viruses. Purified CD8+ splenocytes from infected mice were incubated for 48 h with MHC class II+/+ (B6) and MHC class II−/− (IAb−/−) APCs that were infected in vitro with WT HKx31 influenza virus. The numbers of IFN-γ-producing cells are expressed as spots per million CD8+ T cells. The results are shown as means ± standard errors (n = 4), and the asterisk indicates values that differed significantly from the WT result (P < 0.05). The analysis was repeated (data not shown) with comparable results.
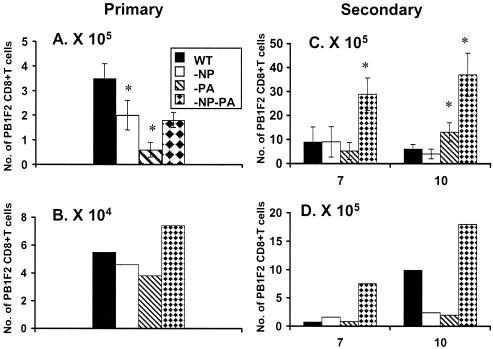
The ELISPOT results (Fig. 8) thus suggest that other epitopes may be emphasized in, particularly, the primary response to these mutant viruses. We had not been using the PB1-F262-70 (8) peptide because earlier experiments (unpublished data) had indicated that the primary response to this H2Db-restricted epitope is minimal. Analysis for the DbPB162-specific set indicated that the sizes of the CD8+ PB1-F262+ sets in spleen (Fig. 9A) and BAL fluid (Fig. 9B) were not increased following primary i.n. challenge with the HK−NP−PA virus. However, the secondary response to DbPB162 was substantial (Fig. 9C and D), indicating that this could explain the apparent difference for the estimates of total size by the PepC (Fig. 7) and ELISPOT (Fig. 8) assays. This apparent compensation in the primary response (Fig. 8A) following i.n. challenge with the HK−NP−PA virus is not, however, resolved by this analysis with DbPB162 (Fig. 9A and B). One possibility is that other, previously disregarded peptides may be involved following primary exposure (41). Future experiments will test the idea that the range of a primary response can be expanded in the absence of prominent epitopes.
FIG. 9.
Prevalence of CD8+ PB1-F262 population in the primary and secondary response. The IFN-γ+ CD8+ PB1-F262+-T-cell numbers (per mouse) in spleen (A and C) and BAL sample (B and D) populations were determined by the PepC assay following primary (day 10, panels A and B) and secondary (days 7 and 10, panels C and D) i.n. challenge. (A and C) Results from spleen and BAL samples for primary infection; (C and D) data from spleen and BAL samples for secondary infection. The HKx31 WT and mutant viruses were given i.n. while the homologous PR viruses were given i.p. 6 weeks previously to those mice that were secondarily challenged. The values for spleen that were significantly different from those for the WT are identified by an asterisk (P < 0.05). Spleen samples were tested individually, and the BAL samples were pooled from the four mice. The experiment was repeated with comparable results (data not shown).
DISCUSSION
The absence of any obvious change in “quality” for the enlarged CD8+ KbPB1703+ and CD8+ KbNS2114+ populations that develop in the absence of the major DbNP366- and DbPA224-specific sets could reflect that the functional capacity of these T-cell sets is close to maximized in the normal infectious process. The much smaller KbPB1703- and KbNS2114-specific T-cell populations generated in mice primed and boosted with WT viruses already make high levels of IFN-γ and TNF-α following in vitro stimulation with peptide. There was no evidence of any correlation between greater clonal expansion and a lower-quality response in the acute phase following secondary challenge.
Even so, the CD8+ KbPB1703+ memory T cells sampled on day 30 from the mice given the mutant viruses were making less IFN-γ and TNF-α than those from the WT prime-boost, reversing the situation found for the day 10 BAL sample population specific for the same epitope. The change between the acute response and memory is, however, unlikely to reflect some TNF-α-mediated editing process, which has been shown in previous experiments to operate only for the relatively small numbers of T cells that have localized to the site of virus-induced pathology (and high antigen load) in the infected lung (34, 39). Also, this divergence in cytokine production for CD8+ KbPB1703+ inflammatory (day 10 BAL sample) and memory (day 30 spleen) T cells was not replicated for the CD8+ KbNS2114+ response. Both in the sense of numerical compensation and in the sense of induced cytokine expression profiles, T cells specific for KbPB1703 and KbNS2114 can behave differently.
The overall conclusion from these experiments, and the less extensive previous study (37), is that each epitope-specific CD8+-T-cell population has inherent characteristics that can be varied only within certain limits. However, it is possible to push responses to a higher level, at least in terms of the extent of clonal expansion (12) and eventual numbers, such that residual T-cell sets can compensate fully for the loss of major epitopes, at least following secondary challenge. There are situations where it might be deemed advantageous to enhance the potential for a particular CD8+-T-cell response. What may normally be a minor epitope on the surface of a virus-infected (or tumor) cell (2) may, in fact, be a particularly useful target for T-cell-mediated elimination. The question of what determines these immunodominance hierarchies needs to be answered.
One possibility is that immunodominance may be a function of the avidity of the interaction between the clonotypic TCRs and antigenic peptide-MHCI complexes (23). If so, the relationship between clonal expansion and TCR avidity may be an inverse one. The DbNP366- and DbPA224-specific responses are equivalent in size following primary infection, but in excess of 10-fold-more CD8+ DbNP366+ T cells are generated following secondary challenge (25). This could in part reflect that the DbPA224 epitope seems to be expressed mainly on dendritic cells (DCs), while DbNP366 is found on a variety of cell types including DCs and infected epithelium (9). Current experiments are looking at the possibility that relocating the PA224-233 peptide to the influenza virus neuraminidase stalk (7) will change the profile of antigen expression, the quality of the responding CD8+ DbPA224+ T cells, and the relationship between the secondary CD8+ DbNP366+ and CD8+ DbPA224+ responses. The answers are not yet in, but it may be desirable to repeat this type of analysis with the more minor PB1703-711, NS2114-121, and PB1-F262-70 peptides.
It is clearly the case that there is no interaction (direct or indirect) between different epitope-specific CD8+-T-cell populations following influenza virus infection of previously unexposed mice. Prior evidence suggests that the induction of primary CD8+-T-cell responses is totally dependent on the binding of naïve precursors to antigen-presenting DCs over a relative short time (35). Any primary response may thus be considered to reflect the spectrum of epitope availability on the DCs and, perhaps, the size of the potential TCR responder repertoire. The fact that these minor responses increased in magnitude following secondary challenge with mutant viruses presumably reflects that the more readily triggered memory T cells are responding to prolonged epitope expression on DCs (and other cell types) as a consequence of delayed elimination in the absence of the normally immunodominant effector T-cell populations. Again, the interplay among antigen concentration, antigen availability, TCR repertoire constraints, and TCR epitope avidity presumably determines the ultimate magnitude of the secondary response. It is worth establishing the relative importance of these different components as we try to develop CD8+-T-cell-peptide-based vaccines to counter infectious and, perhaps, oncogenic processes. The present experiments define some of the baselines for moving such analyses forward.
Acknowledgments
This work was supported by USPHS grants AI29579 and CA21765 and by ALSAC at St. Jude Children's Research Hospital. P.C.D. is a Burnet Fellow of the Australian National Health and Medical Research Council.
We thank Wen Yue, Astrid Gutierrez, and Stephanie Cisneros for technical assistance. We acknowledge Cheng Cheng and Liu Wen at the Department of Biostatistics for statistical analysis on Fig. 7.
REFERENCES
- 1.Allan, W., Z. Tabi, A. Cleary, and P. C. Doherty. 1990. Cellular events in the lymph node and lung of mice with influenza. Consequences of depleting CD4+ T cells. J. Immunol. 144:3980-3986. [PubMed] [Google Scholar]
- 2.Banchereau, J., S. Paczesny, P. Blanco, L. Bennett, V. Pascual, J. Fay, and A. K. Palucka. 2003. Dendritic cells: controllers of the immune system and a new promise for immunotherapy. Ann. N. Y. Acad. Sci. 987:180-187. [DOI] [PubMed] [Google Scholar]
- 3.Belz, G. T., W. Xie, J. D. Altman, and P. C. Doherty. 2000. A previously unrecognized H-2Db-restricted peptide prominent in the primary influenza A virus-specific CD8+-T-cell response is much less apparent following secondary challenge. J. Virol. 74:3486-3493. [DOI] [PMC free article] [PubMed] [Google Scholar]
- 4.Belz, G. T., W. Xie, and P. C. Doherty. 2001. Diversity of epitope and cytokine profiles for primary and secondary influenza A virus-specific CD8+ T cell responses. J. Immunol. 166:4627-4633. [DOI] [PubMed] [Google Scholar]
- 5.Boon, A. C., G. de Mutsert, Y. M. Graus, R. A. Fouchier, K. Sintnicolaas, A. D. Osterhaus, and G. F. Rimmelzwaan. 2002. Sequence variation in a newly identified HLA-B35-restricted epitope in the influenza A virus nucleoprotein associated with escape from cytotoxic T lymphocytes. J. Virol. 76:2567-2572. [DOI] [PMC free article] [PubMed] [Google Scholar]
- 6.Burton, D. R., R. C. Desrosiers, R. W. Doms, W. C. Koff, P. D. Kwong, J. P. Moore, G. J. Nabel, J. Sodroski, I. A. Wilson, and R. T. Wyatt. 2004. HIV vaccine design and the neutralizing antibody problem. Nat. Immunol. 5:233-236. [DOI] [PubMed] [Google Scholar]
- 7.Castrucci, M. R., S. Hou, P. C. Doherty, and Y. Kawaoka. 1994. Protection against lethal lymphocytic choriomeningitis virus (LCMV) infection by immunization of mice with an influenza virus containing an LCMV epitope recognized by cytotoxic T lymphocytes. J. Virol. 68:3486-3490. [DOI] [PMC free article] [PubMed] [Google Scholar]
- 8.Chen, W., P. A. Calvo, D. Malide, J. Gibbs, U. Schubert, I. Bacik, S. Basta, R. O'Neill, J. Schickli, P. Palese, P. Henklein, J. R. Bennink, and J. W. Yewdell. 2001. A novel influenza A virus mitochondrial protein that induces cell death. Nat. Med. 7:1306-1312. [DOI] [PubMed] [Google Scholar]
- 9.Crowe, S. R., S. J. Turner, S. C. Miller, A. D. Roberts, R. A. Rappolo, P. C. Doherty, K. H. Ely, and D. L. Woodland. 2003. Differential antigen presentation regulates the changing patterns of CD8+ T cell immunodominance in primary and secondary influenza virus infections. J. Exp. Med. 198:399-410. [DOI] [PMC free article] [PubMed] [Google Scholar]
- 10.Eichelberger, M., W. Allan, M. Zijlstra, R. Jaenisch, and P. C. Doherty. 1991. Clearance of influenza virus respiratory infection in mice lacking class I major histocompatibility complex-restricted CD8+ T cells. J. Exp. Med. 174:875-880. [DOI] [PMC free article] [PubMed] [Google Scholar]
- 11.Flynn, K. J., G. T. Belz, J. D. Altman, R. Ahmed, D. L. Woodland, and P. C. Doherty. 1998. Virus-specific CD8+ T cells in primary and secondary influenza pneumonia. Immunity 8:683-691. [DOI] [PubMed] [Google Scholar]
- 12.Flynn, K. J., J. M. Riberdy, J. P. Christensen, J. D. Altman, and P. C. Doherty. 1999. In vivo proliferation of naive and memory influenza-specific CD8+ T cells. Proc. Natl. Acad. Sci. USA 96:8597-8602. [DOI] [PMC free article] [PubMed] [Google Scholar]
- 13.Goulder, P. J., C. Brander, Y. Tang, C. Tremblay, R. A. Colbert, M. M. Addo, E. S. Rosenberg, T. Nguyen, R. Allen, A. Trocha, M. Altfeld, S. He, M. Bunce, R. Funkhouser, S. I. Pelton, S. K. Burchett, K. McIntosh, B. T. Korber, and B. D. Walker. 2001. Evolution and transmission of stable CTL escape mutations in HIV infection. Nature 412:334-338. [DOI] [PubMed] [Google Scholar]
- 14.Goulder, P. J., R. E. Phillips, R. A. Colbert, S. McAdam, G. Ogg, M. A. Nowak, P. Giangrande, G. Luzzi, B. Morgan, A. Edwards, A. J. McMichael, and S. Rowland-Jones. 1997. Late escape from an immunodominant cytotoxic T-lymphocyte response associated with progression to AIDS. Nat. Med. 3:212-217. [DOI] [PubMed] [Google Scholar]
- 15.Grusby, M. J., H. Auchincloss, Jr., R. Lee, R. S. Johnson, J. P. Spencer, M. Zijlstra, R. Jaenisch, V. E. Papaioannou, and L. H. Glimcher. 1993. Mice lacking major histocompatibility complex class I and class II molecules. Proc. Natl. Acad. Sci. USA 90:3913-3917. [DOI] [PMC free article] [PubMed] [Google Scholar]
- 16.Hahn, Y. S. 2003. Subversion of immune responses by hepatitis C virus: immunomodulatory strategies beyond evasion? Curr. Opin. Immunol. 15:443-449. [DOI] [PubMed] [Google Scholar]
- 17.Harrer, T., E. Harrer, S. A. Kalams, P. Barbosa, A. Trocha, R. P. Johnson, T. Elbeik, M. B. Feinberg, S. P. Buchbinder, and B. D. Walker. 1996. Cytotoxic T lymphocytes in asymptomatic long-term nonprogressing HIV-1 infection. Breadth and specificity of the response and relation to in vivo viral quasispecies in a person with prolonged infection and low viral load. J. Immunol. 156:2616-2623. [PubMed] [Google Scholar]
- 18.Hoffmann, E., S. Krauss, D. Perez, R. Webby, and R. G. Webster. 2002. Eight-plasmid system for rapid generation of influenza virus vaccines. Vaccine 20:3165-3170. [DOI] [PubMed] [Google Scholar]
- 19.Hoffmann, E., G. Neumann, Y. Kawaoka, G. Hobom, and R. G. Webster. 2000. A DNA transfection system for generation of influenza A virus from eight plasmids. Proc. Natl. Acad. Sci. USA 97:6108-6113. [DOI] [PMC free article] [PubMed] [Google Scholar]
- 20.Kaverin, N. V., I. A. Rudneva, N. A. Ilyushina, N. L. Varich, A. S. Lipatov, Y. A. Smirnov, E. A. Govorkova, A. K. Gitelman, D. K. Lvov, and R. G. Webster. 2002. Structure of antigenic sites on the haemagglutinin molecule of H5 avian influenza virus and phenotypic variation of escape mutants. J. Gen. Virol. 83:2497-2505. [DOI] [PubMed] [Google Scholar]
- 21.Kim, T. S., and S. Perlman. 2003. Protection against CTL escape and clinical disease in a murine model of virus persistence. J. Immunol. 171:2006-2013. [DOI] [PubMed] [Google Scholar]
- 22.Klenk, H. D., and W. Garten. 1994. Host cell proteases controlling virus pathogenicity. Trends Microbiol. 2:39-43. [DOI] [PubMed] [Google Scholar]
- 23.La Gruta, N. L., S. J. Turner, and P. C. Doherty. 2004. Hierarchies in cytokine expression profiles for acute and resolving influenza virus-specific CD8+ T cell responses: correlation of cytokine profile and TCR avidity. J. Immunol. 172:5553-5560. [DOI] [PubMed] [Google Scholar]
- 24.Laver, W. G., G. M. Air, R. G. Webster, W. Gerhard, C. W. Ward, and T. A. Dopheide. 1980. The mechanism of antigenic drift in influenza virus: sequence changes in the haemagglutinin of variants selected with monoclonal hybridoma antibodies. Philos. Trans. R. Soc. Lond. B Biol. Sci. 288:313-326. [DOI] [PubMed] [Google Scholar]
- 25.Marshall, D. R., S. J. Turner, G. T. Belz, S. Wingo, S. Andreansky, M. Y. Sangster, J. M. Riberdy, T. Liu, M. Tan, and P. C. Doherty. 2001. Measuring the diaspora for virus-specific CD8+ T cells. Proc. Natl. Acad. Sci. USA 98:6313-6318. [DOI] [PMC free article] [PubMed] [Google Scholar]
- 26.Price, G. E., R. Ou, H. Jiang, L. Huang, and D. Moskophidis. 2000. Viral escape by selection of cytotoxic T cell-resistant variants in influenza A virus pneumonia. J. Exp. Med. 191:1853-1867. [DOI] [PMC free article] [PubMed] [Google Scholar]
- 27.Ridge, J. P., F. Di Rosa, and P. Matzinger. 1998. A conditioned dendritic cell can be a temporal bridge between a CD4+ T-helper and a T-killer cell. Nature 393:474-478. [DOI] [PubMed] [Google Scholar]
- 28.Scherle, P. A., G. Palladino, and W. Gerhard. 1992. Mice can recover from pulmonary influenza virus infection in the absence of class I-restricted cytotoxic T cells. J. Immunol. 148:212-217. [PubMed] [Google Scholar]
- 29.Slifka, M. K., and J. L. Whitton. 2000. Activated and memory CD8+ T cells can be distinguished by their cytokine profiles and phenotypic markers. J. Immunol. 164:208-216. [DOI] [PubMed] [Google Scholar]
- 30.Slifka, M. K., and J. L. Whitton. 2001. Functional avidity maturation of CD8+ T cells without selection of higher affinity TCR. Nat. Immunol. 2:711-717. [DOI] [PubMed] [Google Scholar]
- 31.Topham, D. J., and P. C. Doherty. 1998. Clearance of an influenza A virus by CD4+ T cells is inefficient in the absence of B cells. J. Virol. 72:882-885. [DOI] [PMC free article] [PubMed] [Google Scholar]
- 32.Townsend, A. R., J. Rothbard, F. M. Gotch, G. Bahadur, D. Wraith, and A. J. McMichael. 1986. The epitopes of influenza nucleoprotein recognized by cytotoxic T lymphocytes can be defined with short synthetic peptides. Cell 44:959-968. [DOI] [PubMed] [Google Scholar]
- 33.Tripp, R. A., D. J. Topham, S. R. Watson, and P. C. Doherty. 1997. Bone marrow can function as a lymphoid organ during a primary immune response under conditions of disrupted lymphocyte trafficking. J. Immunol. 158:3716-3720. [PubMed] [Google Scholar]
- 34.Turner, S. J., N. L. La Gruta, J. Stambas, G. Diaz, and P. C. Doherty. 2004. Differential tumor necrosis factor receptor 2-mediated editing of virus-specific CD8+ effector T cells. Proc. Natl. Acad. Sci. USA 101:3545-3550. [DOI] [PMC free article] [PubMed] [Google Scholar]
- 35.van Stipdonk, M. J., E. E. Lemmens, and S. P. Schoenberger. 2001. Naive CTLs require a single brief period of antigenic stimulation for clonal expansion and differentiation. Nat. Immunol. 2:423-429. [DOI] [PubMed] [Google Scholar]
- 36.Vitiello, A., W. R. Heath, and L. A. Sherman. 1989. Consequences of self-presentation of peptide antigen by cytolytic T lymphocytes. J. Immunol. 143:1512-1517. [PubMed] [Google Scholar]
- 37.Webby, R. J., S. Andreansky, J. Stambas, J. E. Rehg, R. G. Webster, P. C. Doherty, and S. J. Turner. 2003. Protection and compensation in the influenza virus-specific CD8+ T cell response. Proc. Natl. Acad. Sci. USA 100:7235-7240. [DOI] [PMC free article] [PubMed] [Google Scholar]
- 38.Yewdell, J. W., and J. R. Bennink. 1999. Immunodominance in major histocompatibility complex class I-restricted T lymphocyte responses. Annu. Rev. Immunol. 17:51-88. [DOI] [PubMed] [Google Scholar]
- 39.Zheng, L., G. Fisher, R. E. Miller, J. Peschon, D. H. Lynch, and M. J. Lenardo. 1995. Induction of apoptosis in mature T cells by tumour necrosis factor. Nature 377:348-351. [DOI] [PubMed] [Google Scholar]
- 40.Zhirnov, O., and H. D. Klenk. 2003. Human influenza A viruses are proteolytically activated and do not induce apoptosis in CACO-2 cells. Virology 313:198-212. [DOI] [PubMed] [Google Scholar]
- 41.Zhong, W., P. A. Reche, C. C. Lai, B. Reinhold, and E. L. Reinherz. 2003. Genome-wide characterization of a viral cytotoxic T lymphocyte epitope repertoire. J. Biol. Chem. 278:45135-45144. [DOI] [PubMed] [Google Scholar]
- 42.Zolla-Pazner, S. 2004. Identifying epitopes of HIV-1 that induce protective antibodies. Nat. Rev. Immunol. 4:199-210. [DOI] [PMC free article] [PubMed] [Google Scholar]


