Abstract
Background
Intracranial pressure (ICP) normally ranges from 5 to 15 mmHg. Elevation in ICP is an important clinical indicator of neurological injury, and ICP is therefore monitored routinely in several neurological conditions to guide diagnosis and treatment decisions. Current measurement modalities for ICP monitoring are highly invasive, largely limiting the measurement to critically ill patients. An accurate noninvasive method to estimate ICP would dramatically expand the pool of patients that could benefit from this cranial vital sign.
Methods
This work presents a spectral approach to model-based ICP estimation from arterial blood pressure (ABP) and cerebral blood flow velocity (CBFV) measurements. The model captures the relationship between the ABP, CBFV and ICP waveforms and utilizes a second-order model of the cerebral vasculature to estimate ICP.
Results
The estimation approach was validated on two separate clinical datasets, one recorded from thirteen pediatric patients with a duration of around seven hours, and the other recorded from five adult patients, one hour and 48 minutes in duration. The algorithm was shown to have an accuracy (mean error) of 0.4 mmHg and −1.5 mmHg, and a precision (standard deviation of the error) of 5.1 mmHg and 4.3 mmHg, in estimating mean ICP (range of 1.3 mmHg to 24.8 mmHg) on the pediatric and adult data, respectively. These results are comparable to previous results and within the clinically relevant range. Additionally, the accuracy and precision in estimating the pulse pressure of ICP on a beat-by-beat basis were found to be 1.3 mmHg and 2.9 mmHg respectively.
Conclusion
These contributions take a step towards realizing the goal of implementing a real-time noninvasive ICP estimation modality in a clinical setting, to enable accurate clinical-decision making while overcoming the drawbacks of the invasive ICP modalities.
Index Terms: Intracranial pressure, arterial blood pressure, cerebral blood flow velocity, brain injury, model-based signal processing
I. INTRODUCTION
INJURIES to and disorders of the brain – such as traumatic brain injury (TBI), hemorrhagic stroke, hydrocephalus, or brain tumor – are responsible for a significant fraction of the total hospital visits in the United States each year [1]–[6]. These conditions have in common that one of the intracranial compartments (brain tissue, cerebrospinal fluid (CSF), or blood) expands at the expense of the volumes occupied by the other two, owing to the volume constraint imposed by the rigid skull and relatively inelastic dura mater [7]. This restriction in volume implies that uncompensated shifts and expansions in compartmental volumes lead to an increase in the compartment pressure [8], [9]. Hence, the diagnosis, monitoring and treatment of patients with the aforementioned conditions often rely on the measurement and tracking of intracranial pressure (ICP), as elevations in ICP are correlated with poor outcome in brain injury patients. Such elevations need to be detected and managed expeditiously as they can result in poor perfusion of the brain tissue and may lead to brain herniation [10], [11].
Normal mean ICP values range from 5 to 15 mmHg, and in standard clinical practice, ICP is monitored invasively by placing a fluid filled catheter into the ventricular CSF space and, by convention, levelling the pressure transducer to the Foramen of Monro [12], [13]. Alternatively, a pressure-sensitive probe can be placed into the brain tissue to measure tissue pressure. Both approaches are used for decision making in current clinical practice [14].
The invasiveness of the ICP measurement and the need for neurosurgical expertise to place such a catheter have motivated a variety of engineering approaches to make this important cranial vital sign available noninvasively [15], [16]. A particular class of approaches to continuous ICP estimation relies on waveform measurements of cerebral blood flow velocity (CBFV), recorded noninvasively using transcranial Doppler (TCD) ultrasonography, and radial arterial blood pressure (ABP), measured invasively through indwelling catheters [17]–[20]. While these methods use invasively measured ABP, the invasiveness of placing a radial artery line and the associated risk for tissue damage and infection are considerably lower than those associated with placing a ventricular catheter for ICP measurement. Hence, the usage of the term ”noninvasive” for ICP estimation based on simultaneously acquired (noninvasive) CBFV measurements and (invasive) ABP measurements has become established in the field.
In the past, most approaches that infer ICP from CBFV and ABP waveform recordings have largely focused on learning-based or data-driven methods [19], [21]. More recently, model-based methods have been developed that leverage our mechanistic understanding of the underlying physiology to estimate ICP in a model-based manner [22]–[30]. These model-based methods analyze the ABP and CBFV waveform measurements in the context of mechanistic models of the relevant cerebrospinal physiology. While such noninvasive ICP estimation has traditionally focused on estimating the mean ICP value, it has been suggested that the ICP pulse pressure or waveform morphology carry important diagnostic and prognostic information [31]–[33], and hence ICP pulse pressure or full waveform estimation has recently become the focus of attention as well [27], [30].
Building on prior work [24], [26], we propose a frequency-domain approach to model-based ICP estimation that seeks to overcome the need for careful time alignment. Additionally, our approach estimates beat-by-beat ICP pulsatility, along with mean ICP. Here, we first describe the model of the cerebral vasculature and review past efforts at model-based estimation of ICP. Then, we describe the implementation of our algorithm in detail, followed by a description of the clinical dataset used for validating our method. Finally, we present our estimation results and discuss the accuracy and precision of our algorithm when compared to the gold-standard ICP measured invasively.
II. METHODOLOGY
A. Model of craniospinal physiology
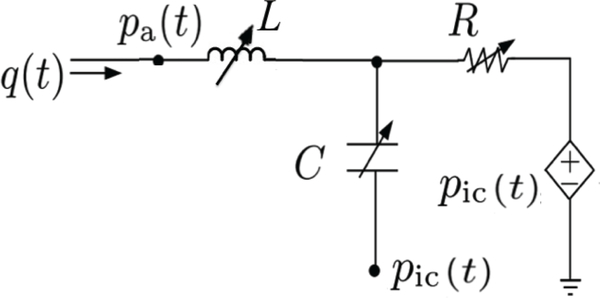
Building on prior work by Kashif et al. [23], [24], [34], Noraky [26] proposed the second-order circuit model depicted in Figure 1, to represent a major cerebral vascular territory, and its interplay with ICP. This model is based on a simplified compartmental view of blood flow through the brain, in which pa(t) represents the ABP waveform at the inlet of a major cerebral vascular territory such as the middle cerebral artery (MCA), q(t) represents the volumetric cerebral blood flow (CBF) into the vascular territory, and pic(t) represents the ICP waveform. The inductor L models the inertia of blood, and the capacitance C represents the lumped compliance of the arterial vessel walls and surrounding brain tissue. The terminal pressure in the capacitive branch of the circuit is ICP as the pressure external to the vessel is ICP. The resistor R models the resistance to blood flow through the vascular territory, between the upstream arteries and downstream veins. Since ICP is typically larger than the cerebral venous pressure and since veins typically cannot sustain a negative transmural pressure, ICP is established as the effective downstream pressure [24]. This phenomenon is known as flow limitation and is seen in other physiological systems in which the pressure outside a collapsible structure exceeds the inside pressure. It is also commonly referred to as the Starling resistor effect [35]. Hence the blood flow through the cerebrovascular system is driven by the difference of ABP and ICP, denoted as the cerebral perfusion pressure (CPP), which we will also denote as x(t).
Fig. 1:
Schematic representation of the second-order circuit model [26].
| (1) |
B. Model-based ICP estimation
Kashif et al. [24] developed a model-based approach to estimate ICP noninvasively using a time-domain algorithm that utilizes a peripherally measured ABP waveform, rather than the cerebral ABP, and a CBFV waveform, instead of the volumetric CBF waveform, as inputs. The primary limitation of this time-domain algorithm was the need to accurately estimate the inherent and unknown phase lag that exists between the cerebral ABP and CBFV signals, and to adjust the timing of the peripherally measured ABP waveform to approximate this phase lag. Kashif at al. adjusted the timing of the ABP recording post-hoc based on physiological considerations and the correlation between heart rates computed from the ABP and CBFV waveforms. The resultant ICP estimates were very sensitive to this this adjustment, which motivated our approach of estimating ICP in the frequency domain using the second-order model of the cerebral vasculature shown in Figure 1 and described by the second-order equation
| (2) |
which is obtained by applying Kirchhoff’s current law and using the constitutive relationships for the inductor L, capacitor C, and resistor R.
A major advantage of the model-based ICP estimation approach by Kashif is the invariance of the resulting ICP estimates to constant scaling (or linear transformation) of the CBF waveform. To the extent that the CBFV waveform is related to the volumetric blood flow (through scaling by the vessel’s cross-sectional area), this invariance allows for the substitution of CBF by CBFV as one of the input waveforms [24]. As with the Kashif model, Eqn. 2 is also invariant under linear transformations of q(t), as can be verified by replacing q(t) by , for any non-zero scaling parameter β, to obtain
| (3) |
The linear scaling of q(t) results in the equation retaining its form with R, C and L being replaced by , and , respectively. To the extent that the model is a realistic – albeit highly aggregate – representation of the relevant cerebrospinal physiology, this scaling invariance has a major advantage as it allows for the replacement of the volumetric CBF, which cannot be measured continuously in real-time, with a scaled version, without affecting the ICP estimates. Hence, CBF can be replaced by CBFV, if the two are related by a scaling factor accounting for the effective cross-sectional area of the vessel and possibly the Doppler angle. CBFV is routinely measured in patients by TCD ultrasonography and hence can serve as an input to our algorithm. For notational simplicity, q(t) will be used to denote CBFV, while R, C and L will denote the scaled versions of the original parameters. Hence, Equation 4 now represents the relationship between ABP (pa(t)), CBFV (q(t)) and CPP (x(t)). To address the need for careful time alignment, we transform Equation 2 in its frequency-domain form
| (4) |
where Q(jω) and X(jω) are the Fourier transforms of q(t) and x(t), respectively, and jω is the complex frequency [36].
The use of power spectra in the frequency domain eliminates the need for careful estimation of the phase offset between the ABP and CBFV waveforms. Eqn. 4 can be solved using a constrained least-squares optimization at appropriately chosen frequencies ω0, ω1, …. ωk. However any such least-squares formulation would require the prior knowledge of the unknown CPP spectrum, as |X(jω)|2 depends on knowledge of the ICP waveform. Hence, a valid algorithmic approximation of the CPP spectrum must be made in order to solve the least-squares optimization and ultimately estimate mean ICP.
C. Spectral algorithm
An approximation to |X(jω)|2 can be obtained by observing the relationship between the measured ABP and ICP waveforms. This approximation is motivated by the recognition that the systolic upstroke of the ICP wavelet is driven by the ABP wavelet impinging on the intracranial tissue compartments [37], [38] and hence is often referred to as the ”percussion” wave of the ICP waveform.
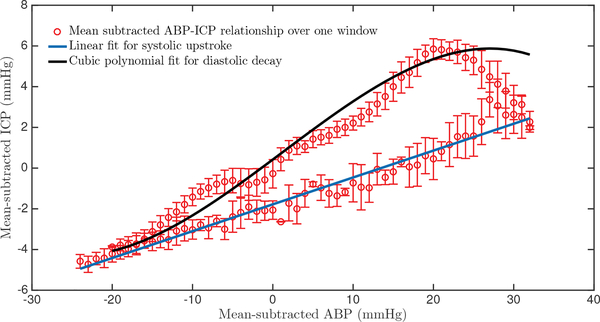
The mean-subtracted ABP and ICP waveform relationship largely conforms to a characteristic shape over each beat, as shown in Figure 2, where the ABP-ICP dynamics were obtained over one 60-beat data window. The relationship exhibits two clear phases: one representing the systolic upstroke (from the onset of a beat to the systolic peak) and the other corresponding to the diastolic decay. We leverage this relationship to reconstruct the mean-subtracted ICP waveform from the mean-subtracted ABP waveform.
Fig. 2:
Representative example of the relationship between mean-subtracted ABP and mean-subtracted ICP over the duration of a 60-beat estimation window. There are two clear phases: a systolic upstroke (blue line) and a diastolic decay (black cubic polynomial). The error bars represent the standard deviation of error at each mean-subtracted ABP sample.
The upstroke of the reconstructed mean-subtracted ICP waveform, , is modeled as a linear function of the mean-subtracted ABP waveform, ,
| (5) |
with associated fitting parameters αu and βu. The diastolic portion of the reconstructed mean-subtracted ICP waveform, , is modeled as a third-order polynomial according to
| (6) |
with fitting parameters , , and βd.
The fitting parameters of these relationships were determined in a training step, for which we allowed ourselves access to two patient records, which constituted less than 2% in total duration of our dataset. We were completely blinded to the remainder of the ICP data.
Henceforth, will denote the mean-subtracted pressure waveforms, while p(t) will represent the entire pressure waveform including the DC component.
The reconstructed mean-subtracted ICP wavelet, , is obtained for each beat by linking and . Thus, the reconstructed mean-subtracted CPP, , is obtained over each window by subtracting the mean-subtracted ABP and reconstructed mean-subtracted ICP
| (7) |
It is important to emphasize that the relationship seen in Figure 2 and the reconstruction of CPP are with respect to the mean-subtracted waveforms and the ultimate aim is twofold, namely to estimate the mean ICP over each estimation window, and to estimate the ICP pulse pressure on a beat-by-beat basis.
We follow the approach by Kashif et al. and perform the estimation of mean ICP over estimation windows of 60 beats in duration. Within each window, the values of the circuit parameters (R, L and C) are assumed to be constant. Also, the ICP is assumed to be constant at its mean level over each estimation window, resulting in a single noninvasive mean ICP estimate every 60 beats. The and q(t) signals for each estimation window are further divided into two non-overlapping subwindows, each 30 beats in duration. The power spectral densities and |Q(jω)|2 are then computed over each sub-window, using a Hamming-window based averaged periodogram method with 50% overlap.
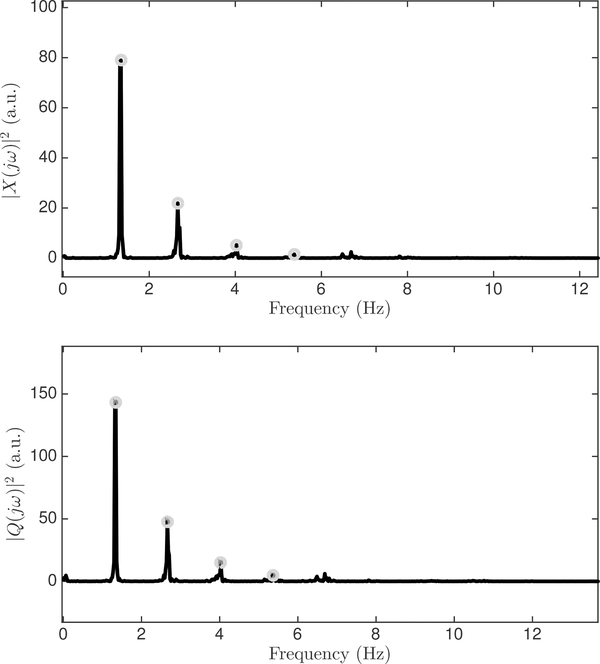
We identify, in a fully automated manner, the dominant peaks ωi in the CBFV and CPP spectra for the fundamental (i = 1) and the first three harmonics (i = 2, 3, 4) in each subwindow, by estimating the heart rate from the ABP as the fundamental frequency ω0, and scanning around integral multiples of ω0 for spectral peaks (Figure 3). Thus, the frequency of each dominant peak is determined as
| (8) |
where ω0 is the fundamental frequency and ϵk is a correction over the scanning range to locate the spectral peak.
Fig. 3:
Example of power spectra of mean-subtracted ABP and CBFV waveforms as computed by the average periodogram method. The first four harmonic peaks are identified in each spectrum.
This process gives a total of eight spectral peaks for power spectral densities of and |Q(jω)|2 in each window: the dominant peaks near the fundamental and three harmonics for each of two subwindows per signal. A constrained least-squares optimization is formulated using the harmonic frequencies and their corresponding peak amplitudes. Note that the DC component has not been used in the least squares formulation.
| (9) |
The resulting optimization problem is implemented as formulated in Equation 9 using the auxilliary variables v1 = 1/R2, v2 = C2, , and v4 = L2C2 and subject to the constraints v1 > 0, v2 > 0, , v4 > 0.
The parameter estimates , and for each window can be obtained from the solutions of the least-squares optimized parameters , and according to
| (10) |
| (11) |
| (12) |
Finally, the noninvasive estimate of mean ICP is computed for each estimation window as
| (13) |
where and denote the window-averaged ABP and CBFV, respectively.
The reconstructed ICP waveform can be obtained over each window by adding the estimated mean ICP to the previously reconstructed mean-subtracted ICP.
| (14) |
In addition to the window-by-window mean ICP estimates, we also compute the pulse pressure of the reconstructed ICP waveform, , as the difference between the maximum and minimum values of over each beat. Since the peak of also corresponds to the point where and are concatenated, there is a potential for artifacts at this point. Hence, the peak and trough of are selected as the mean of three neighboring samples, after excluding spike-like artifacts. Thus, we obtain for every beat, and mean ICP for each 60-beat estimation window.
D. Signal preprocessing
The estimation algorithm described above requires highquality ABP and CBFV waveform recordings to generate estimates of ICP. The radial ABP signal was comparatively free of noise, but was still subject to occasional corruption due to clogging or flushing of the catheter, and intermittent movement artifact. The CBFV waveform was more prone to noise and artifacts, due to its high sensitivity to relative motion of the TCD transducer and the patient. The CBFV signal also consisted of stretches of unusable data during periods in which the ultrasonographer searched for an acoustic window to obtain a continuous, strong acoustic signal from the MCA. Since our algorithm relies on the spectral information of the waveform recordings, the ICP estimates can be severely affected by poor signal quality and intermittent artifact.
To guard against inclusion of stretches of data with unphysiological signatures or excessive noise, we have previously developed an automated signal waveform pre-processing pipeline, consisting of ABP and CBFV signal quality assessment, waveform synchronization, and beat-onset alignment [28]. Additionally, the mean ABP was adjusted to account for the fact that the model requires measurements at the level of the MCA but clinically, the ABP waveform is commonly calibrated to the level of the heart [28]. During each recording session, we therefore measured the vertical heights of the ABP and ICP transducers and calculated the hydrostatic pressure difference to be expected due to the difference in vertical locations of the pressure measurements. We subtracted this hydrostatic pressure from the ABP waveform to approximate the mean pressure at the MCA [28].
E. Error metrics
The estimation results are quantified in terms of the mean estimation error (bias or accuracy), the standard deviation of the error (SDE or precision), and the root mean squared error (RMSE) of the ICP estimates with respect to the mean of the invasively measured ICP.
| (15) |
| (16) |
| (17) |
where is the mean measured ICP, and nICPi is the mean ICP estimate, both for the ith 60-beat estimation window. Additionally, we compute the accuracy and precision errors for the estimated beat-by-beat ICP pulse pressure.
III. CLINICAL DATASET
The algorithm was tested on two clinical datasets, one comprising data from thirteen (primarily) pediatric patients, and the other from five adults. The training described in Section II-C was performed on less than 2% of the pediatric data; no training was performed on the adult dataset.
A. Pediatric population
The pediatric patient dataset has been previously reported and was collected at Boston Children’s Hospital [28]. Briefly, a custom data-acquisition system was deployed in the hospital’s Medical and Surgical Intensive Care Unit for collection of high fidelity waveform recordings and ancillary demographic and clinical information and meta data related to the data-acquisition process. Data collection was approved by the Institutional Review Boards at Boston Children’s Hospital and MIT, and informed consent or – when appropriate – assent were obtained from the patient or their legally authorized representative. Pediatric patients in whom invasive ICP monitoring was indicated as part of routine clinical care were eligible for enrollment [28].
Using the Spencer ST3 TCD ultrasound device (Spencer Technologies, Seattle, WA), CBFV waveforms were recorded by trained members of the study team, and whenever possible waveform measurements were made from both the right and left MCA. The ICP and ABP waveforms were recorded using the Philips MP-90 bedside monitor (Philips Healthcare, Andover, MA). The ICP waveform was measured invasively either by an external ventricular drain (EVD) or a parenchymal probe, and the ABP waveform was recorded invasively from a radial arterial line, placed according to local standard of care procedures. All waveforms were streamed digitally, nominally at 125 samples/s, to a Component Neuromonitoring System (Moberg Research, Ambler, PA), without interruption to the standard clinical protocol of monitoring or care. Ancillary data (hematocrit, heights of pressure transducers, demographic information) were also recorded at the bedside.
A total of 41 studies from thirteen patients (nine males, four females), recorded between February 2015 and June 2017, were used for validation of our noninvasive ICP estimation algorithm. The dataset consists of a diverse population of patients, with ages ranging from 2 to 25 years (median of 11 years) and presenting with various conditions requiring invasive ICP as part of standard practice of care, including TBI, hemorrhagic strokes, hydrocephalus, and metabolic abnormalities. All patients were carefully monitored and managed. From the pediatric dataset, the preprocessing pipeline identified a total of around six hours and 40 minutes of good quality data segments, across the thirteen patients, for validation of our algorithm.
B. Adult population
The adult dataset was also recorded on a custom data-acquisition system deployed in the neuro and trauma ICUs at Boston Medical Center (BMC) [39] to collect high fidelity waveforms and ancillary data from adult patients admitted with a variety of neurological and neurosurgical conditions. The data collection was approved by the Institutional Review Boards at BMC and MIT, and informed consent was obtained from the patients or their legally authorized representative. The CBFV waveform was recorded during dedicated bedside recording sessions using either the DWL Doppler BoxX (Compumedics, Singen, Germany) or the Philips CX-50 ultrasound system (Philips Healthcare, Andover, MA). All patients had a radial arterial line for invasive ABP measurement and either an external ventricular drain or parenchymal probe for invasive measurement of ICP as standard of care, all placed according to standard local care guidelines. The ABP and ICP waveforms and vital signs were streamed to our system from the GE Solar 8000i patient monitors through a GE TramRac 4A. We additionally collected the same ancillary information (hematocrit, vertical heights of pressure transducers, demographic information) as in the pediatric population.
After passing the data through the previously described signal preprocessing pipeline [28], a total of one hour and 48 minutes of high quality data were selected from sixteen studies recorded on five patients (4 male, 1 female). These studies were recorded between February and September 2016. The patients ranged in age from 20 to 74 years (median of 47 years) and were hospitalized for severe TBI (3 patients), brain tumor (1 patient), and acute hydrocephalus (1 patient).
IV. RESULTS
A. Mean ICP estimation
The spectral estimation algorithm described in the previous section was validated on the two clinical datasets detailed above. The pediatric dataset yielded 514 60-beat estimation windows of sufficiently high data quality from thirteen patients. Only three of these segments (less than 2% of the pediatric dataset) were chosen to serve as the training set for determining the generalized fitting parameters, αu and βu for the upstroke, and , , and βd, for the downstroke. The validation of the algorithm was performed on the rest of the pediatric dataset and the entire adult dataset, and the estimation algorithm was run on the remaining data segments without any modifications. Overall, the mean measured ICP ranged from 1.3 to 24.8 mmHg, with a mean and median of 11.2 mmHg and 10.3 mmHg, respectively.
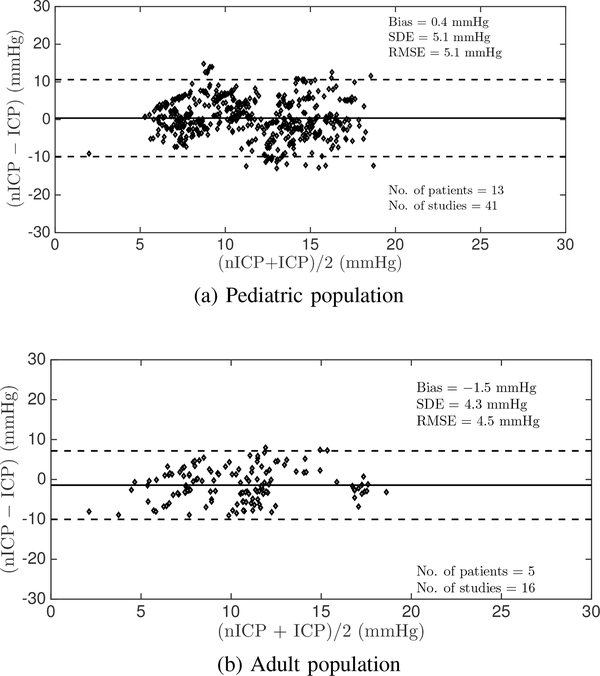
On the pediatric dataset, the algorithm achieved an overall estimation accuracy of 0.4 mmHg, a SDE of 5.1 mmHg, and a RMSE of 5.1 mmHg in estimating mean ICP. The window-by-window estimation results are summarized in the Bland-Altman plot [40] shown in Figure 4a. These summary results are essentially in agreement with those obtained on the same datasets using the Kashif algorithm, as implemented by Fanelli, requiring careful time alignment between the ABP and CBFV waveform recordings [28]. In contrast, the Noraky algorithm [25] achieved a bias of 5.4 mmHg, an SDE of 11.2 mmHg, and a RMSE of 12.5 mmHg on the same dataset, which are clinically unacceptable.
Fig. 4:
Bland-Altman plot comparing estimated and mean measured ICP on a window-by-window basis in the pediatric and adult datasets.
The adult dataset yielded one hour and 48 minutes of high fidelity data from five patients, resulting in 138 60-beat estimation windows. This population served as a completely independent validation dataset, as no previous training was performed on the adult data, and the equipment and study staff was completely different from those of the pediatric study. Our algorithm achieved an accuracy of −1.5 mmHg, a SDE of 4.3 mmHg and a RMSE of 4.5 mmHg in estimating mean ICP on this adult dataset, as summarized in the Bland-Altman plot in Figure 4b. To put these validation results into context, when we separately derived the fitting parameters of our spectral estimation approach from all available adult data and then performed the nICP estimation on the adult data we obtained a bias of −0.9 mmHg, a SDE of 3.6 mmHg, and a RMSE of 3.7 mmHg. This approach essentially amounts to a training performance as we derive the fitting parameters and the estimation performance on the same set of (adult) data. It is therefore an upper limit on the quality of results that can be expected. This exercise demonstrates that the estimation performance obtained on the adult data when the fitting parameters are trained on a small subset of the pediatric data is very close to and – for all clinical purposes – essentially the same as when the method is trained on all adult data.
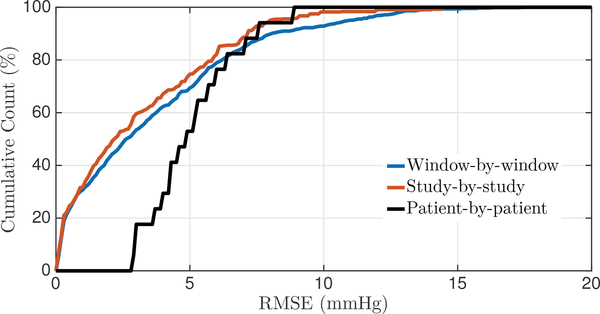
When pooling both the pediatric and adult data and evaluating the performance of the spectral estimation approach on the combined dataset, we obtain an overall accuracy of 0.1 mmHg, a SDE of 5.1 mmHg, and an RMSE of 5.1 mmHg. To further summarize the overall performance of mean ICP, we generated the cumulative distribution functions of the RMSE for the window-by-window, study-by-study, and patient-by-patient analysis across both datasets (Fig. 5). Around 80% of our window-by-window mean ICP estimates fall within a RMSE of 6 mmHg.
Fig. 5:
Cumulative distribution functions for the nICP RMSE on both datasets together. The analysis is carried out on a window-by-window, study-by-study, and patient-by-patient basis.
B. Robustness of the mean ICP estimates
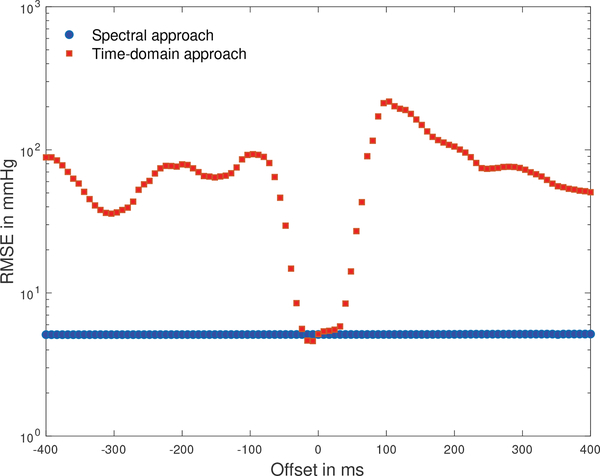
The time offset between a CBFV wavelet recorded at the middle cerebral artery and the corresponding ABP wavelet recorded peripherally depends on physiological factors and internal processing delays of the recording devices [28]. Estimation algorithms that process these signals in the time domain therefore need to estimate a physiologically plausible time offset and adjust the relative timing of these waveforms for each recording [24], [26], [28]. To evaluate the sensitivity of the ICP estimates to temporal misalignment of the CBFV and ABP waveforms, we shifted these waveforms out of phase, one sampling interval at a time, and computed the RMSE between the nICP estimate and mean measured ICP for the spectral estimation approach and the time-domain estimation approach on the pediatric dataset.
The RMSE of the spectral approach remains entirely unaffected by the waveform misalignment, while the time-domain approach only produces credible estimation results for a narrow range of offsets of only about 8 sampling intervals, or 64 ms (Fig. 6). Applying the Kashif algorithm to the pediatric dataset without conducting the beat-onset adjustment outlined by Fanelli [28] resulted in a bias of −4.2 mmHg, a SDE or 70.2 mmHg and a RMSE or 70.4 mmHg, demonstrating the sensitivity of the time-domain approach to estimating a physiologically plausible offset between the two waveforms, while the spectral approach is insensitive waveform misalignment as long as the two waveforms are not shifted by more than an entire beat.
Fig. 6:
RMSE between nICP estimates and mean measured ICP as a function of timing offset between ABP and CBFV waveforms. The zero offset relates to the beat-onset alignment described by Fanelli and co-workers [28].
To evaluate the sensitivity of our nICP estimates to the identification of the peaks in the CPP and CBFV spectra we computed the nICP estimates on the basis of the spectral amplitudes associated with the frequency bins to the right or left (selected at random) of the frequencies corresponding to each of the spectral peaks. This analysis resulted in a bias of 1.2 mmHg and RMSE of 6.7 mmHg, indicating that slight errors in identifying the dominant spectral peaks can decrease the performance appreciably.
C. ICP pulse pressure estimation
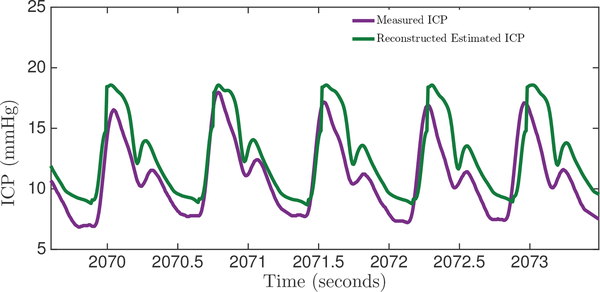
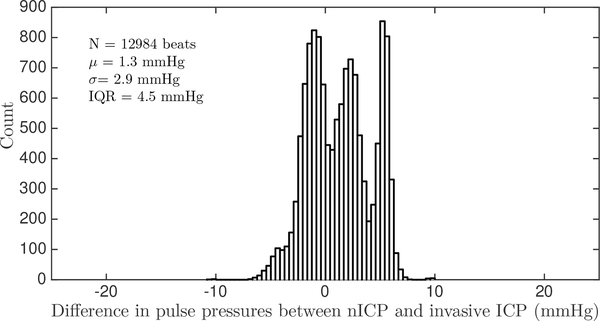
Our spectral algorithm was also used to reconstruct the ICP waveform from the ABP waveform, based on the fitting parameters obtained from the training data. For every cardiac cycle, a mean-subtracted ICP waveform was reconstructed. An example of the reconstructed ICP waveform and the corresponding reference clinical ICP is shown in Figure 7. The pulse pressures, and PPic[n] of the reconstructed and measured ICP waveforms, respectively, were calculated for every beat and compared. This analysis was performed on a total of 12984 beats from eight patients from both datasets, with a range of pulse pressures from 3 mmHg to 18 mmHg. Some of the data windows from both datasets were rejected because the ICP exhibited non-physiological pulsatility, as could arise due to opening of the EVD to drain CSF. Our reconstructed ICP pulse pressure estimates had a bias of 1.3 mmHg, SDE of 2.9 mmHg and a RMSE of 3.2 mmHg. Sixty six pecent of all ICP pulse pressure estimates fall within ±3 mmHg, and 87% of estimates fall within ±5 mmHg of the measured ICP pulse pressure. The full distribution of errors in estimating pulse pressure on a beat-by-beat basis is shown in Figure 8.
Fig. 7:
Comparison between the algorithmic reconstruction of the ICP waveform from ABP and the clinically obtained gold-standard ICP measurements.
Fig. 8:
Distribution of ICP pulse pressure estimation errors.
V. DISCUSSION
Noninvasive assessment of brain health remains one of the pressing open challenges in clinical neuroscience. To address this need, a series of model-based approaches to noninvasive and continuous ICP estimation have recently been proposed based on the analysis of time-locked measurements of CBFV and (peripheral) ABP waveform measurements [23]–[30]. Some of these approaches rely on reduced-order models of the cerebrospinal physiology [23]–[26], [28]–[30] while others represent the relevant anatomy and physiological relationships in more detail [27]. The majority of prior work has approached the estimation problem in the time domain, which requires consideration of how to align the waveform measurements and thereby overcome temporal offsets inherent in measuring physiological waveforms with different medical devices and at different anatomical locations. In pre-processing steps Kashif [24] and Fanelli [28] aligned the waveforms to approximate the phase relationship that can plausibly be expected to exist between CBFV and the ABP waveforms measured simultaneously at the MCA. Imaduddin [30] made the offset an explicit modeling parameter and later marginalized a likelihood function over all plausible offsets. Our work here was directly motivated by the recognition that solving the estimation in the frequency domain should be immune to misalignment of the ABP and CBFV waveform recordings. While we demonstrated that this is indeed the case, the approach required estimation of the CPP power spectrum and hence necessitated a heuristic estimation of the ICP pulsatility. We based our estimation on the fact that the initial upstroke of the ICP wavelet (the percussion wave) is driven primarily by the systolic upstroke of the ABP waveform [37], [38]. While the ICP waveform morphology also depends on the biophysical properties of the cerebrospinal fluid space and surrounding brain tissue, the assumption that the ICP pulsations are largely driven by the ABP pulsation allowed us to make the spectral estimation problem tractable.
The resulting estimation accuracy and precision of our spectral estimation algorithm are highly encouraging, as an overall accuracy of 0.1 mmHg, a SDE of 5.1 mmHg, and a RMSE of 5.1 mmHg in estimating the mean ICP are well within the errors reported when comparing the currently used invasive ICP measurement modalities [16], [41], [42]. Lescot et al. [42], for instance, compared the Pressio and Codman intraparenchymal sensors to ventricular ICP measurements in thirty patients. They reported measurement accuracies of −0.6 and 0.3 mmHg between intraparenchymal and ventricular measurements with the Pressio and Codman devices, respectively, with 95% limits of agreement (bias ± 1.96 SD) of (−8.1 mmHg, 6.9 mmHg), and (−6.7 mmHg, 7.1 mmHg), respectively. Brean et al. [43] compared simultaneous ventricular and intraparenchymal (Codman) ICP measurements in one patient undergoing treatment for subarachnoid hemorrhage. They reported a measurement bias of 0.7 mmHg with a standard deviation of 6.8 mmHg across 218,589 comparisons. In a recent meta-analysis of invasive ICP measurement approaches, Zacchetti et al. [41] reported a mean error between invasive measurements of 1.5 mmHg with an associated 95% confidence limit of 0.7 to 2.3 mmHg. Some of these discrepancies between different modalities might be due to possible natural or pathologydependent pressure gradients within the CSF space (as demonstrated by Eide [31]), to hydrostatic differences between the location of the EVD and parenchymal transducers or due to sensor inaccuracies. These reasons for different readings notwithstanding, the parenchymal and EVD measurements are both standards-of-care in many neurosurgical and neurocritical settings [14]. Hence, it is highly encouraging that our results are comparable to the currently accepted invasive clinical standards of ICP monitoring.
The accuracy and precision achieved by our spectral estimation approach are also in line with those reported by Fanelli et al. [28] and Imaduddin et al. [30] on the same pediatric dataset. Hence, despite our having based our estimation of the ICP pulsatility on the ABP pulsatility, our algorithm performed in a manner entirely comparable to some of the previous estimation strategies, using similar model-based approaches.
The implementation of our approach requires one training step to obtain the fitting parameters in order to reconstruct the estimated ICP waveform. Here, this training was performed on a small fraction (less than 2%) of the pediatric dataset. The remaining pediatric population was diverse, representing a wide range of age, body size, and neurological and neurosurgical conditions. Moreover, we did not retrain the model on the adult data, which was collected in a different hospital, involving different bedside monitoring devices, and different study staff. Our algorithm still achieved very encouraging results on this (albeit small) hold-out validation dataset, thus suggesting that the relationship between mean-subtracted ICP and mean-subtracted ABP has a sufficient degree of robustness to be valid on the data collected to date.
Our algorithm also has the advantage over other model-based noninvasive ICP estimation methods [24], [26], [28], of estimating the pulse pressure by reconstructing the ICP wavelet from each beat of the ABP signal. While the estimate of mean ICP obtained is clinically acceptable and sufficient for clinical monitoring, an estimate of the ICP pulse pressure is thought to provide valuable additional information. The pulsatility of the ICP waveform could be a useful indicator of intracranial compliance [44], and variations in pulsatility have been linked to intracranial hypertension, or hydrocephalus [31]–[33]. Compared to other noninvasive ICP estimation techniques that result only in an estimate of the mean ICP, our frequency-domain algorithm has the added benefit of estimating the pulsatility as well.
Our estimation approach and associated validation strategy have some limitations that have to be further explored. First, while we were able to validate our estimation approach in the clinically important ICP transition range between 15 to 25 mmHg, we were not able to evaluate the approach in the pathological ICP range of 25 to 40 mmHg, as patients in neuro-ICUs are constantly monitored and care is taken to ensure that their ICP is kept within acceptable limits. As a result, we were unable to validate our algorithm on ICP measurements above 25 mmHg or with significant trends in ICP. The data also exhibited low variability in the ICP pulse pressures, making it difficult to definitively evaluate the accuracy of our pulsatility estimation. Since the estimation of ICP pulsatility was not the focus of our data collection effort, we did not flush the ICP catheters to minimize damping of the ICP waveform morphology. Hence, some of the discrepancy seen here between the estimated and measured ICP pulse pressure may, in part, be due to such damping, which should be ruled out in future data collection efforts. On the technical side, one of the major practical limitations is the use of radial ABP as a surrogate for the MCA ABP. While we do apply a hydrostatic correction to account for differences in mean pressure, it is expected that the two waveforms are morphologically different. Any potential morphological variations would affect the spectral estimation which relies on the frequency characteristics of the ABP and CBFV waveform recordings.Also, we have based our nICP estimates on the analysis of four spectral peaks, even though some spectra show additional spectral peaks. Inclusion of additional spectral peaks, when they can be reliably detected, may improve the estimation performance. Finally, our spectral estimation approach relies on the estimation of the ICP pulsatility from the ABP pulsatility. A mechanistic understanding of how the ICP waveform relates to the ABP waveform and the biophysical properties of the intracranial compartments would allow us to improve upon our method, though development of such a detailed understanding currently remains an open challenge in clinical neuroscience.
VI. CONCLUSION
ICP is an important neurological vital sign in clinical decision-making. There is a pressing need to expand the pool of patients who could benefit from this vital sign by developing an accurate, robust noninvasive ICP measurement modality to supplement or replace the existing invasive modalities. Here, we attempted to tackle this crucial problem by developing a spectral approach to noninvasive ICP estimation. We validated our algorithm on two different clinical datasets comprising thirteen pediatric and five adult patients, with a variety of neurological disorders, and obtained an accuracy and precision of 0.4 mmHg and 5.1 mmHg on the pediatric dataset and −1.5 mmHg, 4.3 mmHg on the adult data. These results take a step forward towards the implementation of a safe and robust noninvasive ICP estimation technique, within clinically acceptable accuracy and precision ranges.
ACKNOWLEDGMENT
The research was supported in part by Maxim Integrated Products, the National Institute of Neurological Disorders and Stroke grant R21 NS084264, Philips Healthcare, and a Grass Instruments Graduate Fellowship from the Department of Electrical Engineering and Computer Science at MIT.
Contributor Information
Rohan Jaishankar, Institute for Medical Engineering and Science, the Research Laboratory of Electronics, and the Department of Electrical Engineering and Computer Science, Massachusetts Institute of Technology, Cambridge, MA, 02139 USA..
Andrea Fanelli, Institute for Medical Engineering and Science and the Research Laboratory of Electronics, Massachusetts Institute of Technology, Cambridge, MA, 02139 USA.
Aristotelis Filippidis, Department of Neurosurgery, Boston Medical Center, Boston, MA 02118 USA.
Thai Vu, Department of Neurosurgery, Boston Medical Center, Boston, MA 02118 USA.
James Holsapple, Department of Neurosurgery, Boston Medical Center, Boston, MA 02118 USA.
Thomas Heldt, Institute for Medical Engineering and Science, the Research Laboratory of Electronics, and the Department of Electrical Engineering and Computer Science, Massachusetts Institute of Technology, Cambridge, MA, 02139 USA.
REFERENCES
- [1].Gooch CL, Pracht E, and Borenstein A, “The burden of neurological disease in the United States: A summary report and call to action.” Annals of Neurology, vol. 81, pp. 479–484, 2017. [DOI] [PubMed] [Google Scholar]
- [2].Faul M, Xu L, Wald M, and Coronado V, “Traumatic brain injury in the United States: Emergency department visits, hospitalizations and deaths 2002–2006.” Atlanta (GA): Centers for Disease Control and Prevention, National Center for Injury Prevention and Control, 2010. [Google Scholar]
- [3].Taylor CA, Bell J, Breiding M, and Xu L, “Traumatic brain injury–related emergency department visits, hospitalizations, and deaths — United States, 2007 and 2013.” MMWR Surveillance Summary, vol. 66, pp. 1–16, 2017. [DOI] [PMC free article] [PubMed] [Google Scholar]
- [4].Benjamin EJ et al. , “Heart disease and stroke statistics - 2018 update: A report from the American Heart Association.” Circulation, vol. 137, pp. 67–492, 2018. [DOI] [PubMed] [Google Scholar]
- [5].American Brain Tumor Association. [Online]. Available: http://www.abta.org/about-us/news/brain-tumor-statistics/
- [6].Hydrocephalus Association facts. [Online]. Available: http://www.hydroassoc.org/about-us/newsroom/facts-and-stats-2/
- [7].Moringlane RB, Keric N, Freimann F, Mielke D, Burger R, Duncker D, Rohde V, and Eckardstein K, “Efficacy and safety of durotomy after decompressive hemicraniectomy in traumatic brain injury,” Neurosurgical Review, vol. 40, pp. 655–661, 2017. [DOI] [PubMed] [Google Scholar]
- [8].Langfitt TW, Weinstein J, and Kassell N, “Cerebral vasomotor paralysis produced by intracranial hypertension.” Neurology, vol. 15, pp. 622–641, 1965. [DOI] [PubMed] [Google Scholar]
- [9].Bruce D, “Cerebrospinal fluid pressure and brain metabolism.” in Neurobiology of Cerebrospinal Fluid, Wood JH, Ed., 1980, vol. 1, pp. 351–357. [Google Scholar]
- [10].Carney N, Totten A, O’Reilly C, Ullman J, Hawryluk G, Bell M, Bratton S, Chesnut R, Harris O, Kissoon N, Rubiano A, Shutter L, Tasker RC, Vavilala M, Wilberger J, Wright DW, and Ghajar J, “Guidelines for the management of severe traumatic brain injury, fourth edition.” Neurosurgery, vol. 80, pp. 6–15, 2017. [DOI] [PubMed] [Google Scholar]
- [11].Kochanek P, Tasker R, Carney N, Totten A, Adelson P, Selden N, Davis-O’Reilly C, Hart E, Bell M, Bratton S, Grant G, Kissoon N, Reuter-Rice K, Vavilala M, and Wainwright M, “Guidelines for the management of pediatric severe traumatic brain injury, third edition: Update of the brain trauma foundation guidelines,” Pediatric Critical Care Medicine, vol. 20 (3S Suppl 1), pp. S1–S82, 2019. [DOI] [PubMed] [Google Scholar]
- [12].Steiner LA and Andrews PJD, “Monitoring the injured brain: ICP and CBF,” British Journal of Anesthesia, vol. 97, pp. 26–38, 2006. [DOI] [PubMed] [Google Scholar]
- [13].Heldt T, Zoerle T, Teichmann D, and Stocchetti N, “Intracranial pressure and intracranial elastance monitoring in neurocritical care.” Annual Reviews in Biomedical Engineering, vol. 21, pp. 1–27, 2019. [DOI] [PubMed] [Google Scholar]
- [14].Cnossen M, Huijben J, van der Jagt M, Volovici V, van Essen T, Polinder S, Nelson D, Ercole A, Stocchetti N, Citerio G, Peul W,Maas A, Menon D, Steyerberg E, and Lingsma H, “Variation in monitoring and treatment policies for intracranial hypertension in traumatic brain injury: a survey in 66 neurotrauma centers participating in the CENTER-TBI study.” Critical Care Medicine, vol. 21, p. 233, 2017. [DOI] [PMC free article] [PubMed] [Google Scholar]
- [15].Popovic D, Khoo M, and Lee S, “Noninvasive monitoring of intracranial pressure.” Recent Patents in Biomedical Engineering, vol. 2, pp. 165–179, 2009. [Google Scholar]
- [16].Zhang X, Medow J, Iskandar B, Wang F, Shokoueinejad M, Koueik J, and Webster J, “Invasive and noninvasive means of measuring intracranial pressure: a review.” Physiological Measurement, vol. 38, pp. 143–182, 2017. [DOI] [PubMed] [Google Scholar]
- [17].Schmidt B, Klingelhöfer J, Schwarze J, Sander D, and Wittich I, “Noninvasive prediction of intracranial pressure curves using transcranial doppler ultrasonography and blood pressure curves.” Stroke, vol. 28, pp. 2465–2472, 1997. [DOI] [PubMed] [Google Scholar]
- [18].Schmidt B, Czosnyka M, Schwarze J, Sander D, Gerstner W, Lumenta C, Pickard J, and Klingelhöfer J, “Cerebral vasodilatation causing acute intracranial hypertension: A method for noninvasive assessment. ”Journal of Cerebral Blood Flow and Metabolism, vol. 19, pp. 990–996, 1999. [DOI] [PubMed] [Google Scholar]
- [19].Xu P, Kasprowicz M, Bergsneider M, and Hu X, “Improved noninvasive intracranial pressure assessment with nonlinear kernel regression.” IEEE Transactions on Information Technology in Biomedicine, vol. 14, pp. 971–978, 2010. [DOI] [PMC free article] [PubMed] [Google Scholar]
- [20].Chacon M, Pardo C, Puppo C, Curilem M, and Landerretche J, “Noninvasive intracranial pressure estimation using support vector machine,” in Proceedings of the IEEE Engineering in Medicine and Biology Society 2010, 2010, pp. 996–999. [DOI] [PubMed] [Google Scholar]
- [21].Hu X, Nenov V, Bergsneider M, and Martin N, “A data mining framework of noninvasive intracranial pressure assessment.” Biomedical Signal Processing and Control, vol. 1, pp. 64–77, 2006. [Google Scholar]
- [22].Hu X, Nenov V, Bergsneider M, Glenn T, Vespa P, and Martin N, “Estimation of hidden state variables of the intracranial system using constrained nonlinear kalman filters,” IEEE Transactions on Biomedical Engineering, vol. 54, pp. 597–610, 2007. [DOI] [PubMed] [Google Scholar]
- [23].Kashif FM, Heldt T, and Verghese G, “Model-based estimation of intracranial pressure and cerebrovascular autoregulation.” Computing in Cardiology, vol. 35, pp. 369–372, 2008. [Google Scholar]
- [24].Kashif F, Verghese G, Novak V, Czosnyka M, and Heldt T, “Model-based noninvasive estimation of intracranial pressure from cerebral blood flow velocity and arterial pressure.” Science Translational Medicine, vol. 4, pp. 129–144, 2012. [DOI] [PMC free article] [PubMed] [Google Scholar]
- [25].Noraky J, “A spectral approach to noninvasive model-based estimation of intracranial pressure,” M. Eng. thesis, Massachusetts Institute of Technology, 2014. [Google Scholar]
- [26].Noraky J, Verghese G, Searls D, Lioutas V, Sonni S, Thomas A, and Heldt T, “Noninvasive intracranial pressure determination in patients with subarachnoid hemorrhage.” Acta Neurochirurgica Supplement, vol. 122, pp. 65–68, 2016. [DOI] [PubMed] [Google Scholar]
- [27].Wang J, Hu X, and Shadden S, “Data-augmented modeling of intracranial pressure.” Annals of Biomedical Engineering, vol. 47, pp. 714–730, 2019. [DOI] [PMC free article] [PubMed] [Google Scholar]
- [28].Fanelli A, Vonberg F, LaRovere K, Walsh B, Smith E, Robinson S, Tasker R, and Heldt T, “Fully automated, real-time, calibration-free, noninvasive intracranial pressure estimation.” Journal of Neurosurgery Pediatrics, 2019, in print. [DOI] [PubMed] [Google Scholar]
- [29].Park C, Ryu S, Jeong B, Lee S, Hong C, Kim Y, and Lee B, “Real-time noninvasive intracranial state estimation using unscented kalman filter,” IEEE Transactions on Neural Systems and Rehabilitation Engineering, vol. 27, no. 9, pp. 1931–1938, 2019. [DOI] [PubMed] [Google Scholar]
- [30].Imaduddin S, Fanelli A, Vonberg F, Tasker R, and Heldt T, “Pseudobayesian approach to model-based noninvasive intracranial pressure estimation and tracking,” IEEE Transactions on Biomedical Engineering, 2019, in press. [DOI] [PubMed] [Google Scholar]
- [31].Eide PK, “Demonstration of uneven distribution of intracranial pulsatility in hydrocephalus patients.” Journal of Neurosurgery, vol. 109, pp. 912–917, 2008. [DOI] [PubMed] [Google Scholar]
- [32].Cardoso E, Rowan J, and Galbraith S, “Analysis of the cerebrospinal fluid pulse wave in intracranial pressure.” Journal of Neurosurgery, vol. 59, pp. 817–821, 1983. [DOI] [PubMed] [Google Scholar]
- [33].Avezaat CJ, van Eijndhoven J, and Wyper D, “Cerebrospinal fluid pulse pressure and intracranial volume-pressure relationships.” Journal of Neurology, Neurosurgery and Psychiatry, vol. 42, pp. 687–700, 1979. [DOI] [PMC free article] [PubMed] [Google Scholar]
- [34].Kashif F, Heldt T, and Verghese G, “Systems, devices and methods for noninvasive or minimally-invasive estimation of intracranial pressure and cerebrovascular autoregulation,” U.S. Patent 8366627B2, February 05, 2013.
- [35].Holt JP, “The collapse factor in the measurement of venous pressure: The flow of fluid through collapsible tubes.” American Journal of Physiology, vol. 134, pp. 292–299, 1941. [Google Scholar]
- [36].Oppenheim A, Willsky A, and Nawab S, Signals and Systems, 2nd ed. Upper Saddle River, New Jersey: Prentice Hall, 1997. [Google Scholar]
- [37].Jr EB., “Choroid plexus and arterial pulsation of cerebrospinal fluid,” A.M.A Archives of Neurology and Psychiatry, vol. 73, pp. 165–172, 1955. [DOI] [PubMed] [Google Scholar]
- [38].Adolph R, Fukusumi H, and Fowler N, “Origin of cerebrospinal fluid pulsations,” American Journal of Physiology, vol. 212, pp. 840–846, 1967. [DOI] [PubMed] [Google Scholar]
- [39].Fanelli A, Jaishankar R, Filippidis A, Holsapple J, and Heldt T, “A waveform archiving system for the ge solar 8000i bedside monitor.” Acta Neurochirurgica Supplement, vol. 126, pp. 173–177, 2018. [DOI] [PubMed] [Google Scholar]
- [40].Bland JM and Altman DG, “Statistical methods for assessing agreement between two methods of clinical measurement.” Lancet, vol. 1, pp. 307–310, 1986. [PubMed] [Google Scholar]
- [41].Zacchetti L, Magnoni S, Corte FD, Zanier E, and Stocchetti N, “Accuracy of intracranial pressure monitoring: systematic review and meta-analysis.” Critical Care, vol. 19, p. 420, 2015. [DOI] [PMC free article] [PubMed] [Google Scholar]
- [42].Lescot T, Reina V, Manach YL, Boroli F, Chauvet D, Boch A, and Puybasset L, “In vivo accuracy of two intraparenchymal intracranial pressure monitors.” Intensive Care Medicine, vol. 37, pp. 875–879, 2011. [DOI] [PubMed] [Google Scholar]
- [43].Brean A, Eide P, and Stubhaug A, “Comparison of intracranial pressure measured simultaneously within the brain parenchyma and cerebral ventricles.” Journal of Clinical Monitoring and Computing, vol. 20, pp. 411–414, 2006. [DOI] [PubMed] [Google Scholar]
- [44].Hawthorne C and Piper I, “Monitoring of intracranial pressure in patients with traumatic brain injury.” Frontiers in Neurology, vol. 5, p. 121, 2014. [DOI] [PMC free article] [PubMed] [Google Scholar]


