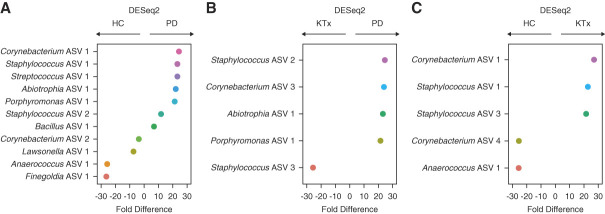
Figure 5.
Differential abundance analyses among the cohort at the ASV level. Differential abundance analyses were performed on the anterior nasal microbiota between the groups using DESeq2 with Benjamini–Hochberg adjustment for multiple hypothesis testing. On the y axis is the individual ASV with genus shown, and on the x axis is the fold difference in abundance. The fold difference directionality is represented above the graph. (A) Differential abundance analyses between the HC group and the PD group. (B) Differential abundance analyses between the KTx group and the PD group. (C) Differential abundance analyses between the HC group and the KTx group. ASV, amplicon sequence variant; HC, healthy control; KTx, kidney transplant; PD, peritoneal dialysis.

