

Abstract
Acetate metabolism is an important metabolic pathway in many cancers and is controlled by acetyl-CoA synthetase 2 (ACSS2), an enzyme that catalyzes the conversion of acetate to acetyl-CoA. While the metabolic role of ACSS2 in cancer is well described, the consequences of blocking tumour acetate metabolism on the tumour microenvironment and anti-tumour immunity are unknown. We demonstrate that blocking ACSS2 switches cancer cells from acetate consumers to producers of acetate thereby freeing acetate for tumour-infiltrating lymphocytes to use as a fuel source. We show that acetate supplementation metabolically bolsters T-cell effector functions and proliferation. Targeting ACSS2 with CRISPR-Cas9 guides or a small molecule inhibitor promotes an anti-tumour immune response and enhances the efficacy of chemotherapy in preclinical breast cancer models. We propose a paradigm for targeting acetate metabolism in cancer in which inhibition of ACSS2 dually acts to impair tumour cell metabolism and potentiate anti-tumour immunity.
Keywords: breast cancer, acetate, ACSS2, tumour immunity, metabo-immunomodulator
INTRODUCTION
Triple-negative breast cancer (TNBC) often presents as high-grade and has the poorest survival rate among the different subtypes of breast cancer. TNBC is a heterogenous disease typically diagnosed immunohistochemically by the absence of estrogen receptor (ER), progesterone receptor (PR), and human epidermal growth factor receptor 2 (HER2) expression. The lack of growth factor receptor expression has hampered the development of targeted therapies for the treatment of TNBC and therefore chemotherapy remains the standard of care 1. Immunotherapy was first approved in 2019 for metastatic TNBC patients with PD-L1 positive tumours, and there are currently numerous clinical trials investigating the efficacy of immunotherapy in TNBC 2–8. Given the success of immunotherapies in the clinic, it would be beneficial to gain a more thorough understanding of the tumour-immune axis in TNBC to better inform immunotherapeutic and combinatorial treatment modalities.
There are three acyl-CoA synthetase short-chain family members (ACSS) that convert short-chain fatty acids to short-chain acyl-CoA’s in mammalian cells. ACSS’s mainly differ in their subcellular localization and substrate selectivity. Acetyl-CoA synthetase 1 (ACSS1) and ACSS3 are found in the mitochondria 9, 10. We previously showed that ACSS1 has a high specific activity for both acetate and propionate, while ACSS3 greatly prefers propionate and has almost no activity towards acetate 11. ACSS2 is a nucleo-cytosolic enzyme that strongly prefers acetate 11, 12. Given that acetyl-CoA does not freely cross the mitochondrial membrane, ACSS1 and ACSS2 control distinct subcellular pools of acetate-derived acetyl-CoA. Acetyl-CoA is a versatile metabolite that is oxidized in the tricarboxylic acid (TCA) cycle or used for fatty acid biosynthesis and protein (histone) acetylation 13. Many cancer cells with expression of ACSS2 can use acetate as an alternative source of carbon and energy, competing in significance with glucose 14–16. Production of acetyl-CoA from acetate by ACSS2 is a common metabolic adaptation in many cancers, including breast, prostate, glioblastoma, melanoma, fibrosarcoma, multiple myeloma, and hepatocellular carcinoma 11, 15, 17–23. Moreover, ACSS2 expression has been shown to be higher in breast cancer, ovarian cancer, brain cancer, and prostate cancer compared to normal adjacent tissue 15, 17, 21. 11C-acetate positron emission tomography imaging has shown that many tumours consume higher amounts of acetate compared to the surrounding normal tissue 24–26. ACSS1 and ACSS2 have been shown to be upregulated by 4-hydroxytamoxifen treatment and long-term estrogen deprivation suggesting that acetate metabolism may be activated in ER+ breast cancer with acquired resistance to selective estrogen receptor modulator or in TNBC 27.
Many recent studies suggest that metabolic inhibitors can also act as immunomodulators 28–33. This class of metabolic immunomodulators dually act by impairing tumour metabolism while also modulating immune cell function in the tumour microenvironment. We previously characterized a potent, specific ACSS2 inhibitor called VY-3-135 that causes significant reductions in tumour growth in immune-deficient mice, suggesting a cancer cell intrinsic role for acetate metabolism in supporting tumour growth 11. With an ACSS2 inhibitor now in first-in-human clinical trials (NCT04990739) for cancer treatment, gaining a better understanding of the metabolic consequences of blocking tumour acetate metabolism on cancer cells and the tumour microenvironment will help guide the use of ACSS2 inhibitors in the clinic.
To the best of our knowledge, no studies have examined the effects of targeting ACSS2 on the tumour microenvironment and anti-tumour immunity. Using syngeneic allografts of breast cancer, we show that knockout of ACSS2 or pharmacological inhibition of ACSS2 causes significantly stronger tumour growth inhibition in immune-competent mice than immune-deficient mice. Single-cell RNA sequencing of ACSS2 inhibitor-treated tumours showed no significant changes in gene expression within the tumour cells. It did indicate upregulation of markers of T-cell activation and antigen presentation by dendritic cells. We further show that blocking ACSS2 switches cancer cells from acetate consumers to acetate producers. The consequent rise in acetate availability would allow T-cells and natural killer cells to take up and oxidize acetate through ACSS1. Indeed, acetate supplementation improved CD8+ T-cell proliferation and (poly)functionality. We propose that targeting tumour acetate metabolism with ACSS2 inhibitors acts as a metabo-immunomodulator in breast cancer by intrinsically impeding tumour cell metabolism while also extrinsically enhancing the ability of tumour-infiltrating leukocytes to eliminate breast tumour cells.
RESULTS
Targeting ACSS2 inhibits tumour growth better in immune-competent mice.
We previously showed that knockout of Acss2 or treatment with an ACSS2 inhibitor, called VY-3-135, inhibits Brpkp110 mouse breast tumour growth in NSG mice 11. To test the effectiveness of ACSS2 inhibition in immune-competent models, we measured tumor growth across four mouse breast cancer models (A7C11, T11, T12, Brpkp110) treated with VY-3-135 and injected into immune-competent mice versus immune-deficient mice (Fig. 1a). In all four models, VY-3-135 treatment caused stronger breast tumour growth inhibition in immune-competent mice compared to immune-deficient mice (Fig. 1b–h). The presence of VY-3-135 in the tumours was confirmed by LC-MS based metabolomics (Extended Data Fig. 1a). In vivo on-target activity of VY-3-135 was confirmed by 13C2-acetate stable isotope tracing (Extended Data Fig. 1a). Importantly, there was no change in the proportion of citrate labeled by acetate indicating that VY-3-135 does not affect the activity of ACSS1 (Extended Data Fig. 1a).
Figure 1. Inhibition of ACSS2 triggers stronger tumour growth inhibition in immune-competent mice compared to immune-deficient mice.
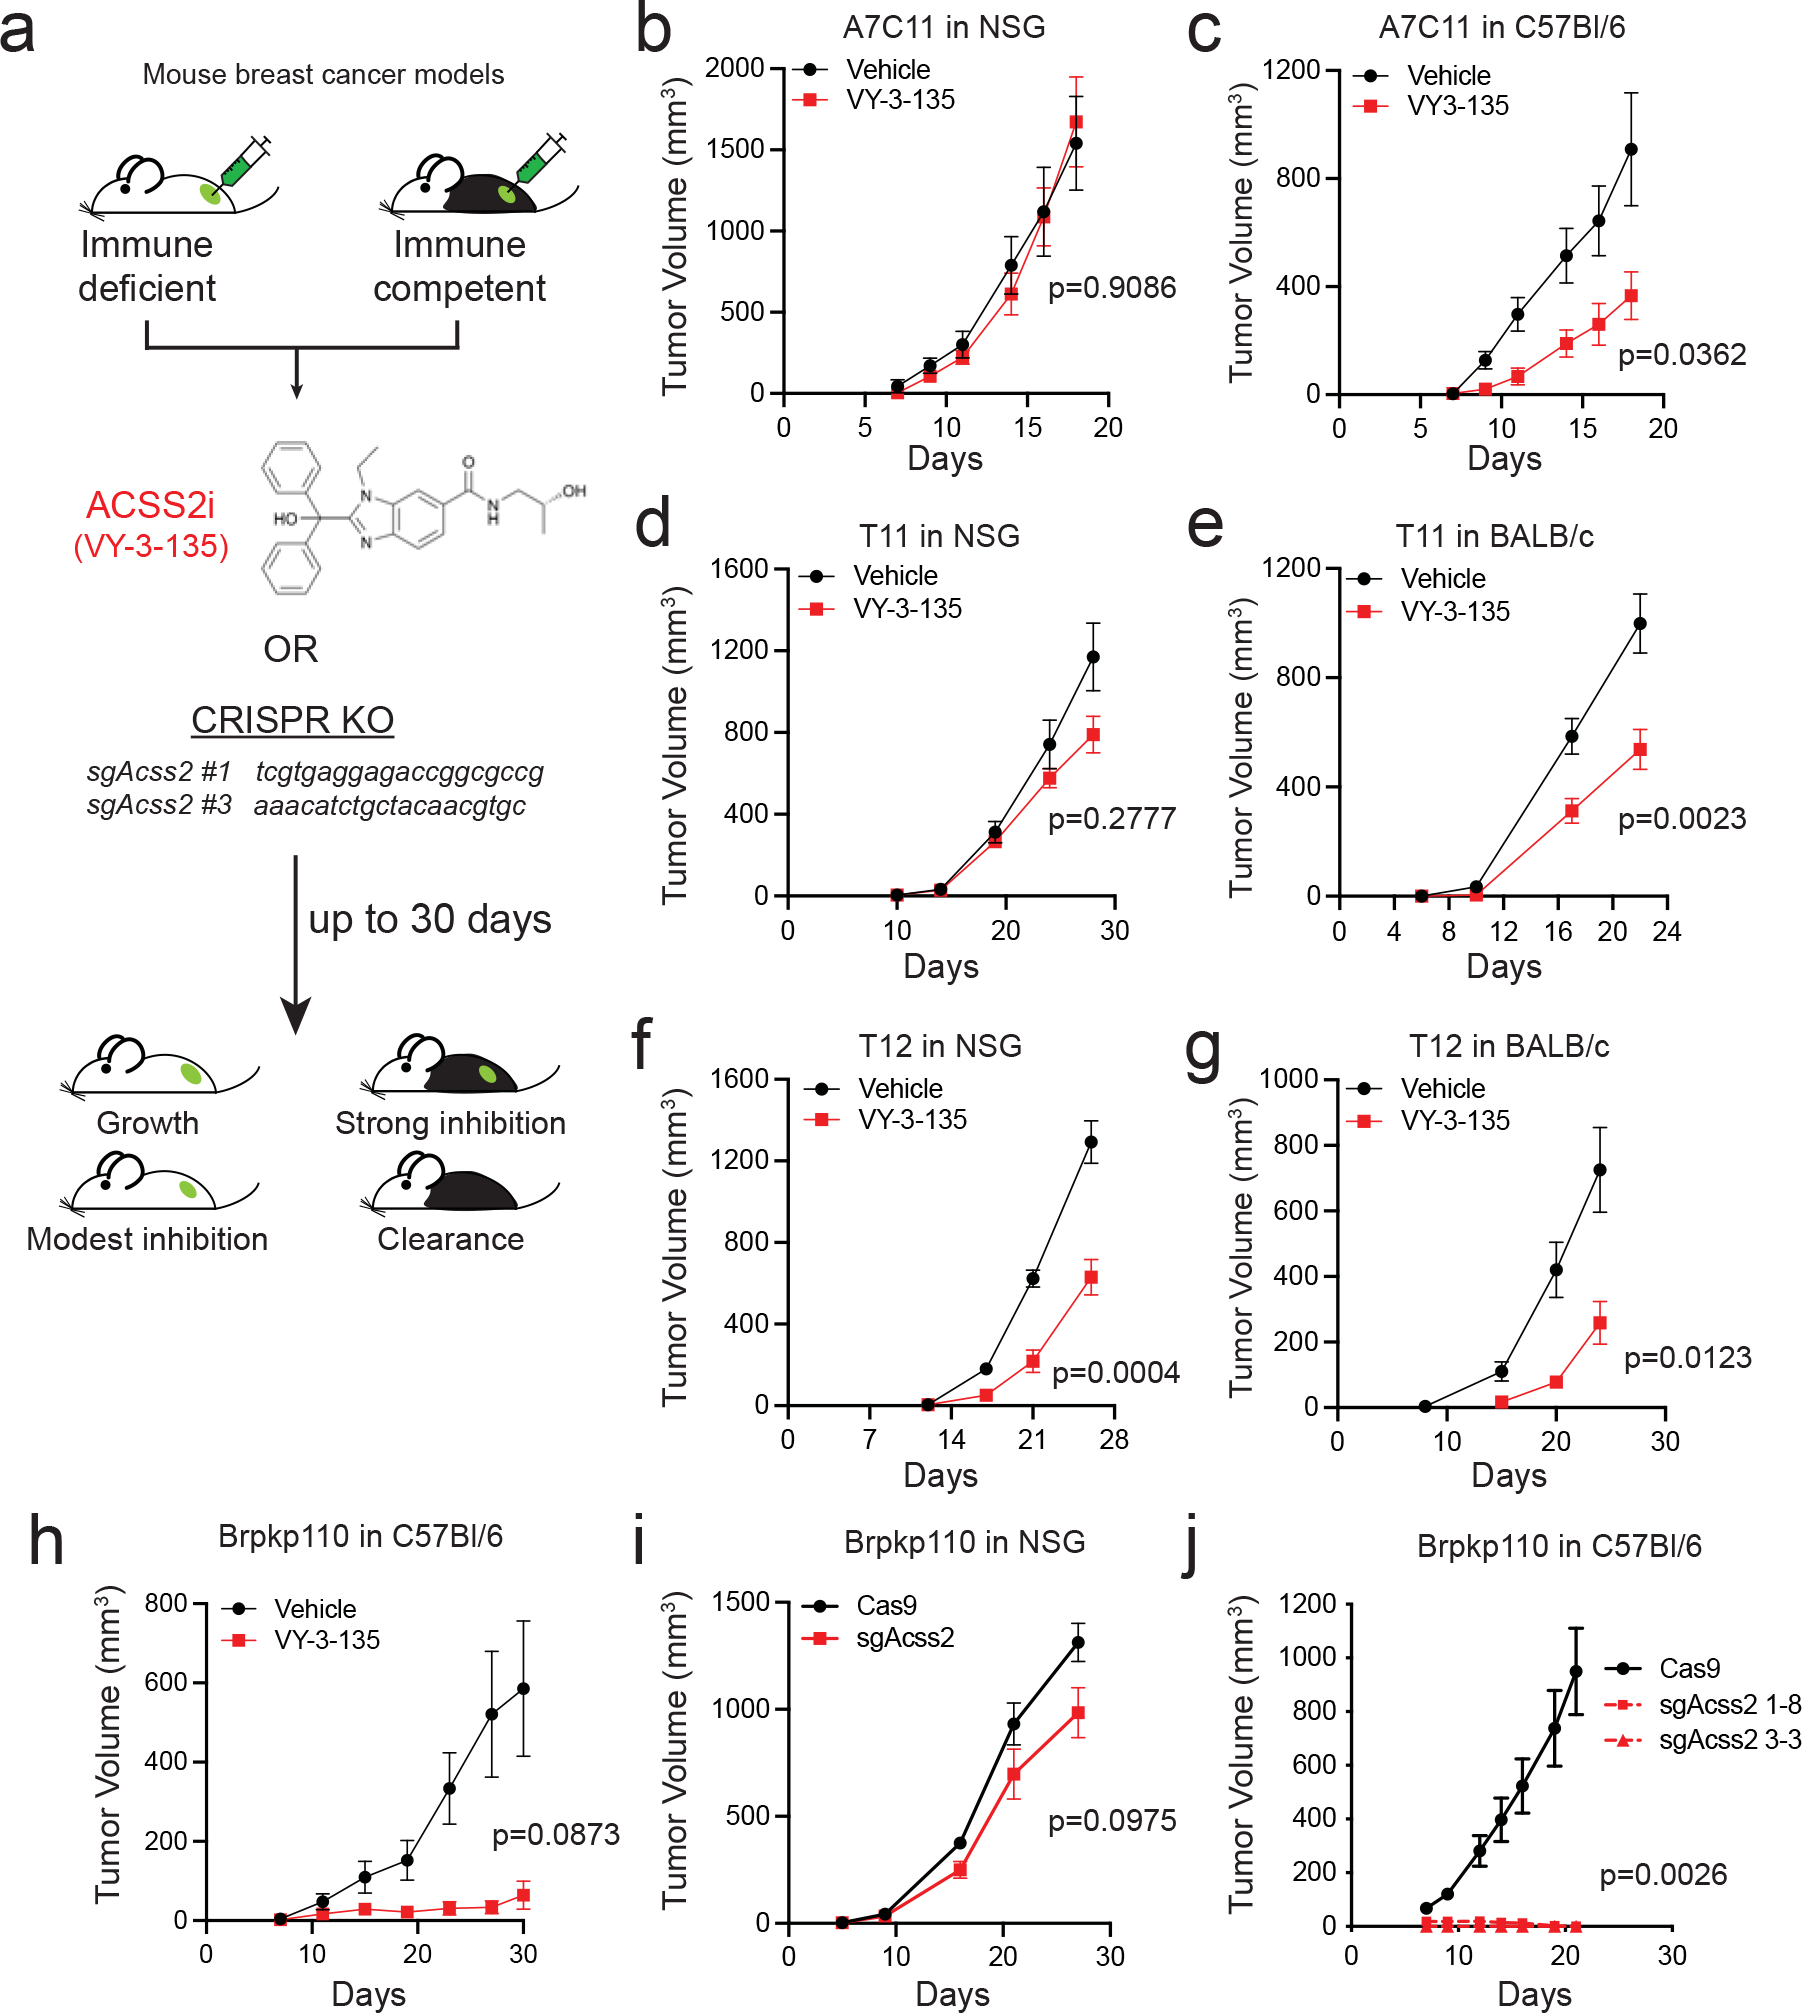
a, Diagram outlining the approach to testing inhibition of ACSS2 in immune-competent and immune-deficient tumour-bearing mice. VY-3-135 = ACSS2 inhibitor. sgAcss2 = single guide RNA targeting Acss2. NSG = NOD.Cg-Prkdcscid Il2rgtm1Wjl/SzJ. b-g, Allograft tumour growth in NSG, C57Bl/6, or BABL/c mice treated with VY-3-135. n = 8 mice per group. Adjusted p values are displayed on the graph and were generated using multiple two-sided Welch t-test. Values represent the mean tumour volume ± standard error of the means (SEM). h, Orthotopic allograft tumour growth of Brpkp110 cells in C57Bl/6 mice treated with VY-3-135. Adjusted p value is displayed on the graph generated using multiple two-sided Welch t-test. Values represent the mean tumour volume ± SEM. n = 5 mice per group. i and j, Orthotopic allograft tumour growth of Cas9 (WT) or two different sgAcss2 (Acss2-KO) Brpkp110 cell lines in NSG or C57Bl/6. Adjusted p values are displayed on the graph and were generated using multiple unpaired two-sided Welch t-test. Values represent the mean tumour volume ± SEM. NSG, n = 10 mice per group. C57Bl/6, n = 7 mice per group for Cas9 and n = 5 mice per group for each Acss2-KO.
We generated Acss2-knockout (Acss2-KO) mouse breast cancer cell lines using a CRISPR/Cas9 approach and followed tumor growth in immune-deficient versus immune-competent mice to determine the effects of tumour-specific loss of ACSS2 (Fig. 1a). Acss2-KO cell lines recapitulated the effects of VY-3-135, where depleting ACSS2 resulted in much stronger tumour growth inhibition in immune-competent mice (Fig. 1i–j and Extended Data Figure 1b–f). In many instances, loss of ACSS2 led to complete clearance of tumours in immune-competent mice and significant improvements in overall survival (Fig. 1j and Extended Data Fig. 1b–k).
We also dosed tumour-bearing mice for four weeks with VY-3-135 and then stopped dosing and monitored up to 120 days. We found significant improvement of survival in the inhibitor treated groups, with some VY-3-135 treated mice having undetectable tumours by the end of the study (Extended Data Fig. 1i). Re-expression of sgRNA-resistant mouse ACSS2 in Acss2-KO cells (sgAcss2 rev) rescued tumour formation in immune-competent mice (Extended Data Fig. 1g,j–k). Altogether, the VY-3-135 and Acss2-KO tumour studies demonstrated that targeting tumour acetate metabolism is more efficacious when the tumour-bearing host is immune-competent.
T-cell or NK-cell depletion restores Acss2-KO tumour growth
The findings in immune-competent versus immune-deficient hosts led us to examine whether host immunity may be controlling Acss2-KO tumour growth. We grew WT versus Acss2-KO tumours as syngeneic allografts in immune-competent mice treated with immune cell-specific depletion antibodies. Acss2-KO tumour growth significantly increased in mice depleted of CD4+, CD8+, or both CD4+ and CD8+ T-cells (Fig. 2a–d and Extended Data Fig. 2a). The rescue of Acss2-KO tumour growth was also seen in Rag2-KO mice, which lack mature T and B-cells (Extended Data Fig. 2b). We further found that depletion of natural killer (NK) cells allowed Acss2-KO tumours to grow (Fig. 2e–f and Extended Data Fig. 2c–d). Overall, loss of ACSS2 expression in mouse breast tumours promoted an anti-tumour immune response that involved T-cells and NK-cells.
Figure 2. T-cells and NK-cells are necessary for suppression of Acss2-KO tumour growth.

a, Syngeneic allograft tumour growth of WT versus Acss2-KO Brpkp110 tumours in C57Bl/6 mice depleted of both CD4+ and CD8+ T-cells or treated with an isotype control IgG antibody. Values represent the mean tumour volume ± SEM. P values generated using two-way ANOVA with Dunnett’s multiple comparisons test comparing all groups to Cas9 + IgG. n = 10 mice per group. b,c, Syngeneic allograft tumour growth of Brpkp110 WT or Acss2-KO cells grown in C57Bl/6 mice individually depleted of CD4+ (b) or CD8+ (c) T-cells or treated with isotype control IgG. n = 5 mice per group. Values represent the mean tumour volume ± SEM. P values generated using two-way ANOVA with Dunnett’s multiple comparisons test against Cas9 + IgG. n = 5 mice per group. d, Syngeneic allograft tumour growth of A7C11 WT or Acss2-KO tumours in C57Bl/6 mice depleted of both CD4+ and CD8+ T-cells or treated with an isotype control IgG antibody. Values represent the mean tumour volume ± SEM. P values generated using two-way ANOVA with Dunnett’s multiple comparisons test against Cas9 + IgG. n = 5 mice per group. e, Syngeneic allograft tumour growth of Brpkp110 WT or Acss2-KO tumours in C57Bl/6 mice depleted of NK-cells or treated with an isotype control IgG antibody. Values represent the mean tumour volume ± SEM. P values generated using two-way ANOVA with Dunnett’s multiple comparisons test against Cas9 + IgG. n = 8 mice per group. f, Final tumour weights from data in (e). Values represent the mean tumour volume ± SEM. P values generated using two-way ANOVA with Dunnett’s multiple comparisons test against Cas9 + IgG. n = 8 tumors for all groups, except Cas9 + αNK n = 6 tumors. g, Schematic detailing tumour rechallenge experiments. h,i, Syngeneic allograft tumour growth of WT Brpkp110 or T11 cells in C57Bl/6 or BALB/c mice that had previously cleared Acss2-KO tumours or age-matched unchallenged mice. Values represent the mean tumour volume ± SEM. P values generated using two-sided Fisher’s exact test. n = 5 Brpkp110 re-challenge mice, n = 4 Brpkp110 naïve mice. T11 tumors n = 8 mice.
We next sought to determine if immune cell-mediated control of Acss2-KO tumours would lead to memory responses capable of preventing the growth of tumours with wild type ACSS2 expression (Fig. 2g). Acss2-KO breast cancer cells were injected into immune-competent syngeneic mice. After 30 days Acss2-KO tumours were not palpable. We then injected Acss2 WT breast cancer cells into the opposite side of the mouse and continued to follow tumour growth for 30 days. All naïve mice injected with Acss2 WT-cells effectively established tumours within weeks (Fig. 2h–i). However, all mice previously exposed to Acss2-KO tumours prevented the growth of WT breast tumours (Fig. 2h–i). Together these data demonstrate that targeting ACSS2 within a tumour cell leads to enhanced clearance by host immunity with formation of memory capable of controlling the growth of future insults by WT breast tumours.
ACSS2 is not necessary for the anti-tumor immune response.
Since ACSS2 inhibitors block ACSS2 throughout the mouse, we wanted to test if systemic loss of ACSS2 would affect tumour control by the immune system. We obtained an Acss2 whole body knockout (Acss2−/−) mouse that harbors a single nucleotide insertion in exon 3 (Fig. 3a–d). Tumour-bearing Acss2−/− mice remained capable of clearing Acss2-KO tumours (Fig. 3e). We also tested this concept using bone marrow (BM) chimaeras, where WT or Acss2−/− donor BM was introduced into C57Bl/6 mice conditioned with busulfan. Mice with donor BM from Acss2−/− mice controlled tumour growth as well as mice that had received BM from a WT mouse (Fig. 3f–g). Overall, these studies highlight that systemic inhibition of ACSS2 in immune-competent mice by VY-3-135 or genetic knockout of Acss2 does not impair the ability of mice to clear Acss2-KO tumours.
Figure 3. ACSS2 is dispensable in T-cells for anti-tumour immune responses.
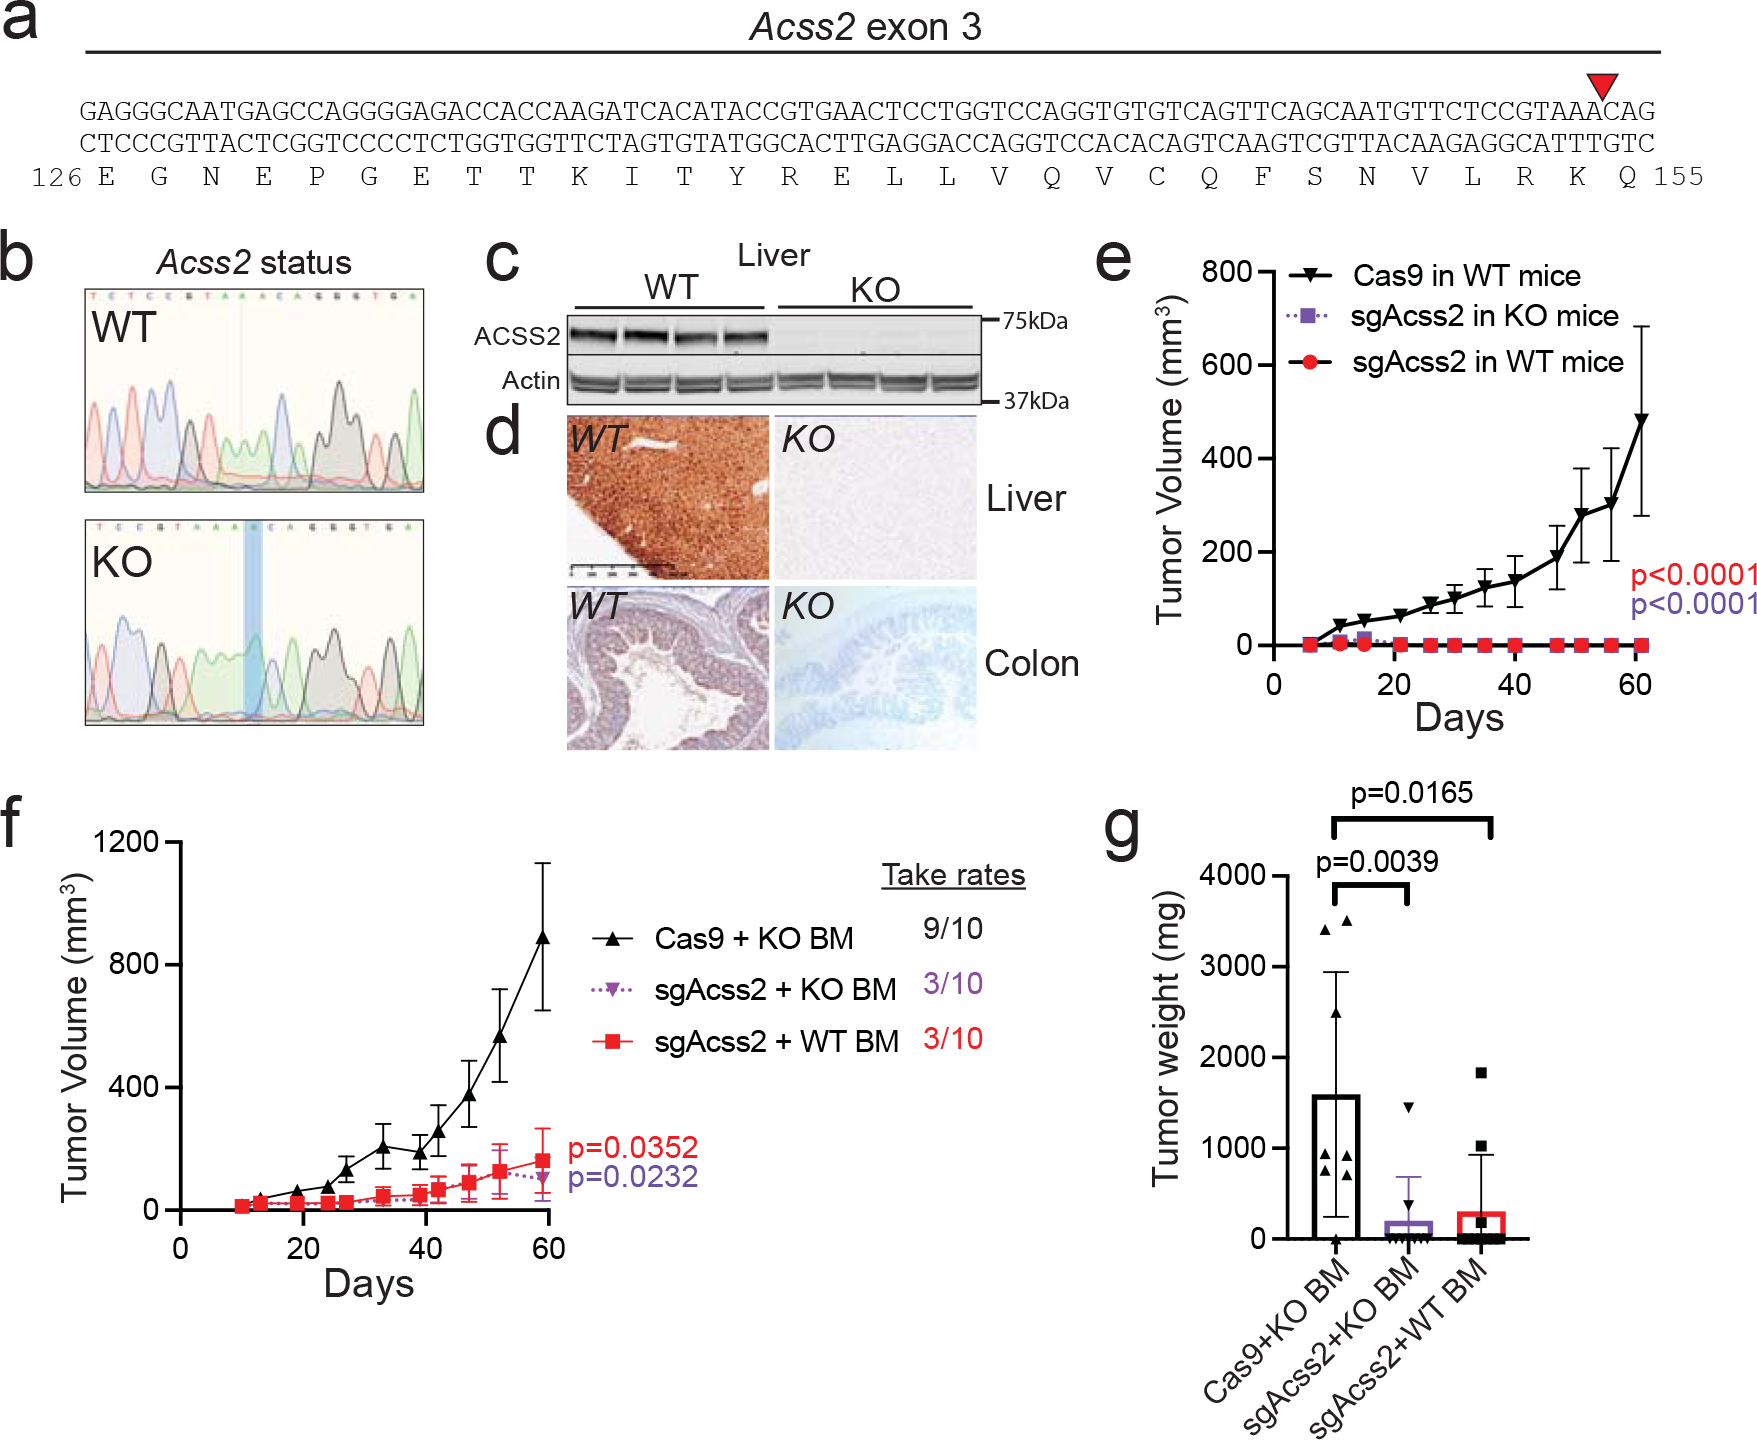
a, Acss2−/− mice possess a one base pair insertion into exon 3 at the indicated (red triangle) position causing a frameshift mutation. b, Representative sequences from WT and KO mice showing the adenine base pair insertion. c, ACSS2 protein expression in liver lysates from WT versus Acss2-KO mice. n = 4 mice per group. d, Immunohistochemistry staining for ACSS2 in WT and Acss2-KO mouse liver and colon. e, sgAcss2 tumours are unable to grow in Acss2-KO mice. Values represent the mean tumour volume ± SEM. P values generated using two-way ANOVA with Dunnett’s multiple comparisons test against Cas9 in WT mice. Cas9 and sgAcss2 in WT n = 8 mice, sgAcss2 in KO n = 5 mice. f, Tumour growth studies in chimaera mice reconstituted with WT or Acss2-KO mouse bone marrow. Values represent the mean tumour volume ± SEM. P values generated using two-way ANOVA with Dunnett’s multiple comparisons test against Cas9 + KO BM. n = 10 mice per group. g, Final tumour weights from the mice in panel f. P values generated using two-tailed Mann-Whitney U test. Values represent the mean tumour volume ± SEM. n = 8 tumors Cas9 + KO BM, n = 9 tumors sgAcss2 + KO BM, n = 10 tumors sgAcss2 WT BM. Western blotting results were independently validated twice. Immunohistochemistry images are representative of an image from five independent tissue samples.
ACSS2 inhibitor treatment activates immune cells.
We next investigated if there were gene expression changes within the tumours that might lead to an enhanced immune response. We performed QuantSeq 3′ mRNA-sequencing on bulk breast tumour tissue from vehicle versus VY-3-135 (ACSS2i; 15 days) treated NSG and C57Bl/6 mice. We noted upregulation of genes (163 genes; >1.3-fold change, FDR<5%) associated with antigen presentation and immune cell migration, differentiation, and activation which likely reflects neutrophil and monocyte infiltration into tumours in NSG mice. Indeed, the most highly enriched gene was Ly6c2 (+6.88), a marker for monocytes (Extended Data Fig. 3a).
Gene expression analysis of breast tumours treated with VY-3-135 for five days in immune-competent mice identified 64 genes in common between the models, including multiple MHC class I genes, Ccl5, Cxcl10, and other genes associated with myeloid cell activation (430 genes; >1.2-fold change, FDR<5%) (Extended Data Fig. 3a–c). In contrast to tumours from immune-deficient mice, tumours from immune-competent mice additionally contained markers of T-cell activation (Prf1, Gzma, Gzmb, Cd2, Il2ra, Sell). Gene set enrichment analyses (GSEA) predicted significant increases (FDR<5%, Z score>2) in pathways associated with immune cell movement and infiltration (Extended Data Fig. 3d–e). Interestingly, most pathways altered by VY-3-135 treatment were associated with enhanced immune infiltration and activation and interferon signalling (Extended Data Fig. 3d–e). Interferon-γ (IFNG) was predicted to be the most highly activated transcriptional regulator in the tumours following ACSS2 inhibition in immune-competent mice (Extended Data Fig. 3f–g).
ACSS2 inhibitors do not affect tumor gene expression
We used single cell RNA sequencing (scRNAseq) to distinguish gene expression differences among cell types within the tumor. Seurat clustering identified five groups: two tumour cell clusters (0 and 1) and three immune cell clusters (2, 3, and 4) (Fig. 4a). Surprisingly, very few genes in the tumor cells were differentially regulated after seven days of VY-3-135 treatment (11 up, 0 down, FC>1.2, FDR<5%) (Fig. 4b). Cluster 1 had higher expression of proliferation markers (Fig. 4c–f). However, there was no difference in the ratio of proliferating versus non-proliferating tumour cells. We therefore tested if VY-3-135 treatment might synergize with anti-proliferative chemotherapeutic agents. Combinatorial treatment of breast tumours with palbociclib, doxorubicin, or paclitaxel further enhanced tumour growth inhibition compared to monotherapy, suggesting ACSS2 inhibitors act as immunomodulators that can enhance the effects of chemotherapies (Fig. 4g–i).
Figure 4. Inhibition of ACSS2 synergizes with chemotherapy in breast tumours.

a, Seurat clustering of cell populations within Brpkp110 tumours highlighting the tumour cell clusters 0 and 1. b, All upregulated genes in Brpkp110 tumour cells treated with VY-3-135 versus vehicle. c, Heatmapping of the relative gene expression of proliferation markers across cell populations. d, Heat map illustrating top 10 gene markers for each tumour cell population from panel a. e, Average and percent expression of proliferative markers in cluster 0 versus cluster 1. f, GSEA of different functions between tumour cell cluster 0 and cluster 1. g-i, Syngeneic allograft tumour growth of Brpkp110 cells in C57Bl/6 mice treated with vehicle, palbociclib, doxorubicin, VY-3-135, paclitaxel, and combinations thereof starting at day 10 post injection. Values represent the mean tumour volume ± SEM. P values generated using 2-way ANOVA and Dunnett’s multiple comparisons test compared to vehicle. n = 10 vehicle mice, n = 8 mice in all other groups.
Single cell RNA sequencing of ACSS2 inhibitor treated tumours
Gene expression changes in tumour-infiltrating immune cells were much more extensive compared to tumour cells (Fig. 5a–c). Clusters 2, 3, and 4 showed significant upregulation of many chemokine and cytokine genes associated with immune cell recruitment and activation (Ccl4, Ccl5, Ccl6, Ccl12, Il1b, Ly6c2, Cxcl10) and cytotoxicity (Gzmb, C1q, Lyz2) (Fig. 5b–c). Further clustering identified subpopulations of tumour-associated monocytes and macrophages (TAMs; subcluster 0), dendritic cells (DCs; subcluster 1), granulocytes (subcluster 2), mature DCs (subcluster 3), and mast-cells (subcluster 4) (Extended Data Fig. 4a–c). Of these, TAMs and DCs exhibited the greatest number of differentially regulated genes upon VY-3-135 treatment. The TAMs from VY-3-135 treated tumours had higher expression of chemokines (Ccl4, Ccl7, and Ccl12) and many surface markers, receptors, and adhesion molecules (Ly6c2, Ly6a, Fcrls, Fcgr1, Cx3cr1, Ccr5, Cd72) (Extended Data Fig. 4d). GSEA predicted significant activation of functions and regulators associated with leukopoiesis and recruitment and chemotaxis of antigen-presenting cells (Extended Data Fig. 4e). DCs in subcluster 1 displayed the highest number of upregulated genes (1199 genes, FC>1.2, FDR<5%) in VY-3-135 treated tumours. DCs from VY-3-135 treated tumours had higher expression of Fcer1g, Il1b, Cxcl2, Cxcl16, Irf7, Lyz2, and multiple complement proteins (C1q) (Extended Data Fig. 4f). GSEA predicted activation of phagocytosis and cell engulfment in addition to cell movement and proliferation, which were likely driven by TNF and IFNγ signalling in the tumour microenvironment (Extended Data Fig. 4g).
Figure 5. Single cell RNA sequencing identifies enhanced activation of tumour-infiltrating T-cells upon ACSS2 inhibition.
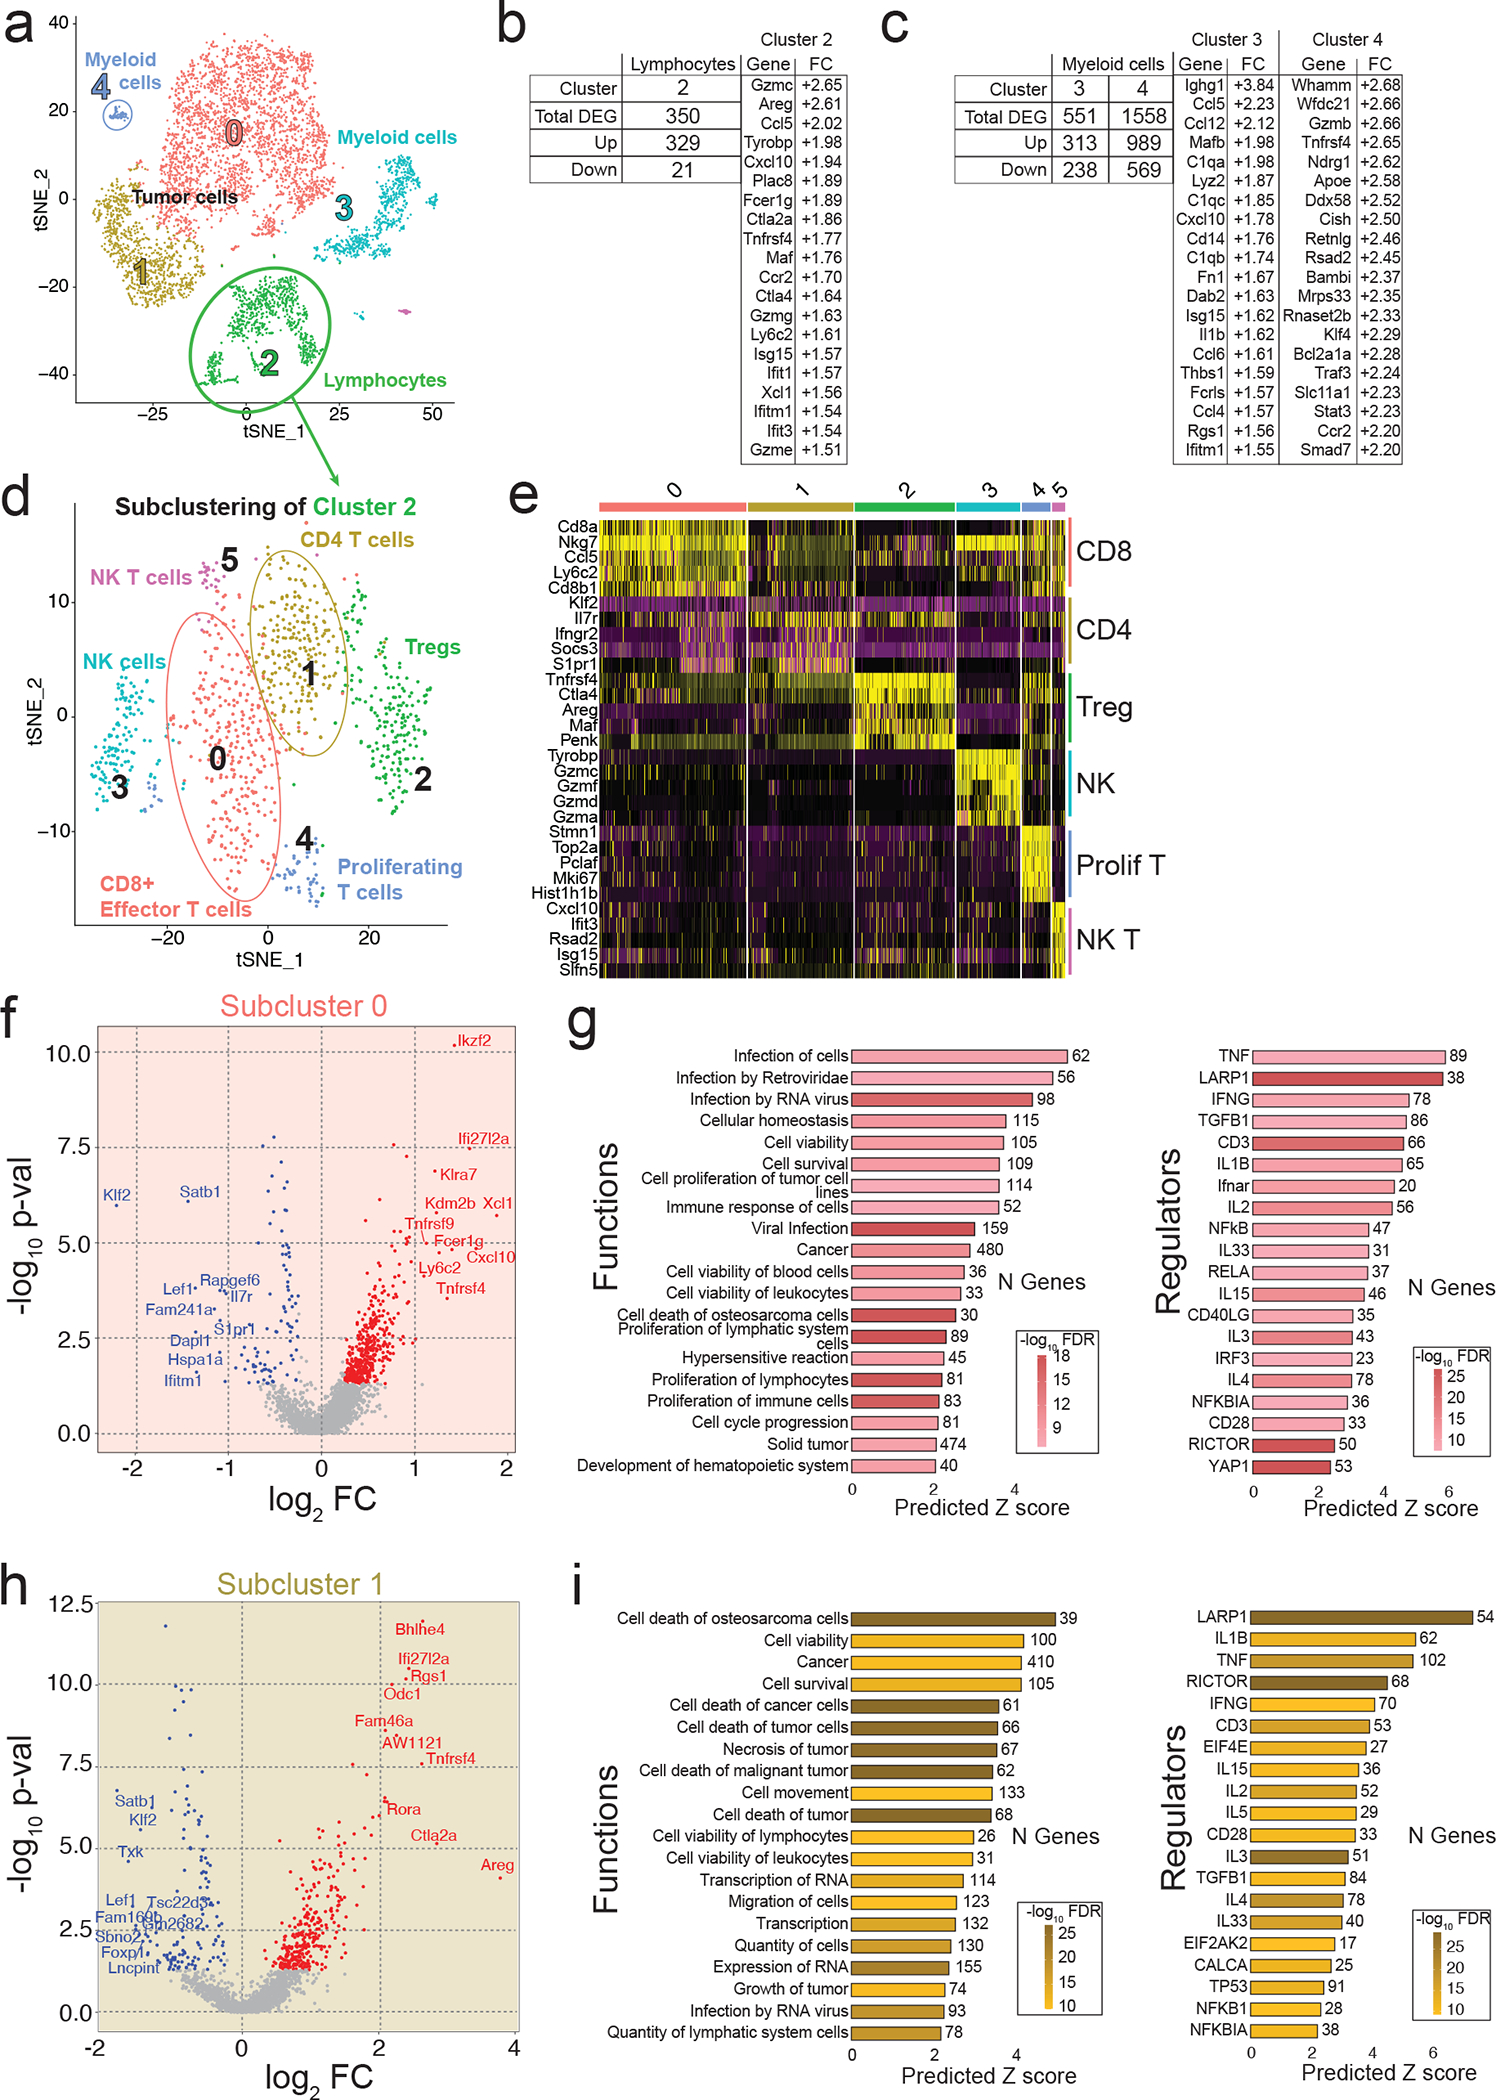
a, Seurat clustering of cell populations within Brpkp110 tumours highlighting lymphocyte cluster 2. b,c, Upregulated genes in lymphocytes (b) and myeloid cells (c) from Brpkp110 tumours treated with VY-3-135 for seven days. d, Seurat plot of cell populations following subclustering of lymphocytes from cluster 2. e, Heat map illustrating gene expression of the top five most highly expressed gene markers within each lymphocyte subcluster. f, Volcano plot illustrating DEGs in VY-3-135 treated tumours of subcluster 0. P values were generated with a non-parametric Wilcoxon rank sum test. g, IPA of the top 20 functions and regulators in subcluster 0 that were significantly activated by VY-3-135 treatment. h, Volcano plot illustrating DEGs in subcluster 1 in VY-3-135 treated tumours. P values were generated with a non-parametric Wilcoxon rank sum test. i, GSEA of the top 20 functions and regulators in subcluster 1 that were significantly activated in ACSS2 inhibitor treated tumours. Heat mapping on bar plots represents -log10 FDR values. The number next to the bar displays the number (N) of genes within that regulator or function gene set that were altered. The x-axis is the predicted Z score based on the gene expression differences.
We further subclustered tumour-infiltrating lymphocytes into six populations: CD8+ T-cells (cluster 0), CD4+ T-cells (cluster 1), Tregs (cluster 2), NK-cells (cluster 3), proliferating T-cells (cluster 4), and NKT-cells (cluster 5) (Fig. 5d–e and Extended Data Fig. 5a–c). CD8+ and CD4+ T-cells were the most functionally activated and possessed the largest number of differentially regulated genes in response to VY-3-135, while NK-cells had high expression of GzmB (Extended Data Fig. 5a–c). CD8+ T-cells showed strong suppression of Satb1, Lef1, Il7r, Tcf7, and Klf2, suggesting differentiation from a naïve to active state (Fig. 5f). Cxcl10 (+3.68) and Xcl1 (+3.16) were the two most highly enriched genes in CD8+ T-cells from VY-3-135 treated tumours (Fig. 5f). We also observed upregulation of memory marker Ly6c2 (+2.40) on CD8+ T-cells (Fig. 5f).
In the CD4+ T-cells (subcluster 1) from VY-3-135 treated tumours, we saw enrichment of multiple markers of activated T helper cells, such as Ctla2a (+7.22), Bhlhe40 (+6.25), and Rora (+4.36) (Fig. 5h) 34. CD4+ T-cells also showed upregulation of Tnfrsf4 (+6.19), a receptor that promotes expression of apoptosis inhibitor BCL-xL (Bcl2l1, +2.11), thereby promoting cell survival (Fig. 5h) 35. GSEA predicted enhanced immune response, proliferation and viability driven by TNFα, IFNγ, and interleukin signalling (Fig. 5g,i). Thus, scRNA-seq analysis largely mimicked that of the bulk tumour RNA-seq where VY-3-135 promotes a local inflammatory response and activation of both innate and adaptive immune cells, but further highlighted antigen-presenting cells, T-cells, and NK-cells as the likely effectors of tumour control.
Immunophenotyping of tumor-infiltrating leukocytes.
Given that loss of ACSS2 potentiates anti-tumor immunity, we investigated if ACSS2 expression correlates with infiltration and/or activation of immune cells in breast cancer. Analysis of scRNAseq data from 26 primary, pre-treatment breast tumors showed that other than a modest negative correlation with neutrophils, ACSS2 expression does not significantly correlate with gene signatures associated with lymphocyte infiltration or activation (Supplementary Table 1) 36. Based on our scRNAseq analysis, the most ubiquitously upregulated gene across all cell types was Ccl5, which was enriched in cancer cells (+1.97), lymphocytes (+2.20) and myeloid cells (+2.23) from VY-3-135 treated tumours (Fig. 4b, Fig. 5b–c). We confirmed this upregulation in VY-3-135 treated Brpkp110 tumours by ELISA (Fig. 6a). We also investigated METABRIC37 and TCGA38 breast cancer gene expression databases for correlation between ACSS2 and CCL5 in TNBC patient survival. We find that while low ACSS2 coupled with high CCL5, which would mimic VY-3-135 treated tumours, predicts better survival in TNBC patients (p=0.002; HR=1.86) from the METABRIC database, the same was not true for TCGA breast cancer patients (p=0.82; HR=1.14) (Fig. 6b). The reason for this discrepancy is currently unclear and further work will be needed to clarify the relationship between ACSS2 and CCL5 in anti-tumour immunity.
Figure 6. Phenotypic marker analysis of tumour-infiltrating leukocytes and splenocytes from VY-3-135 treated tumours.
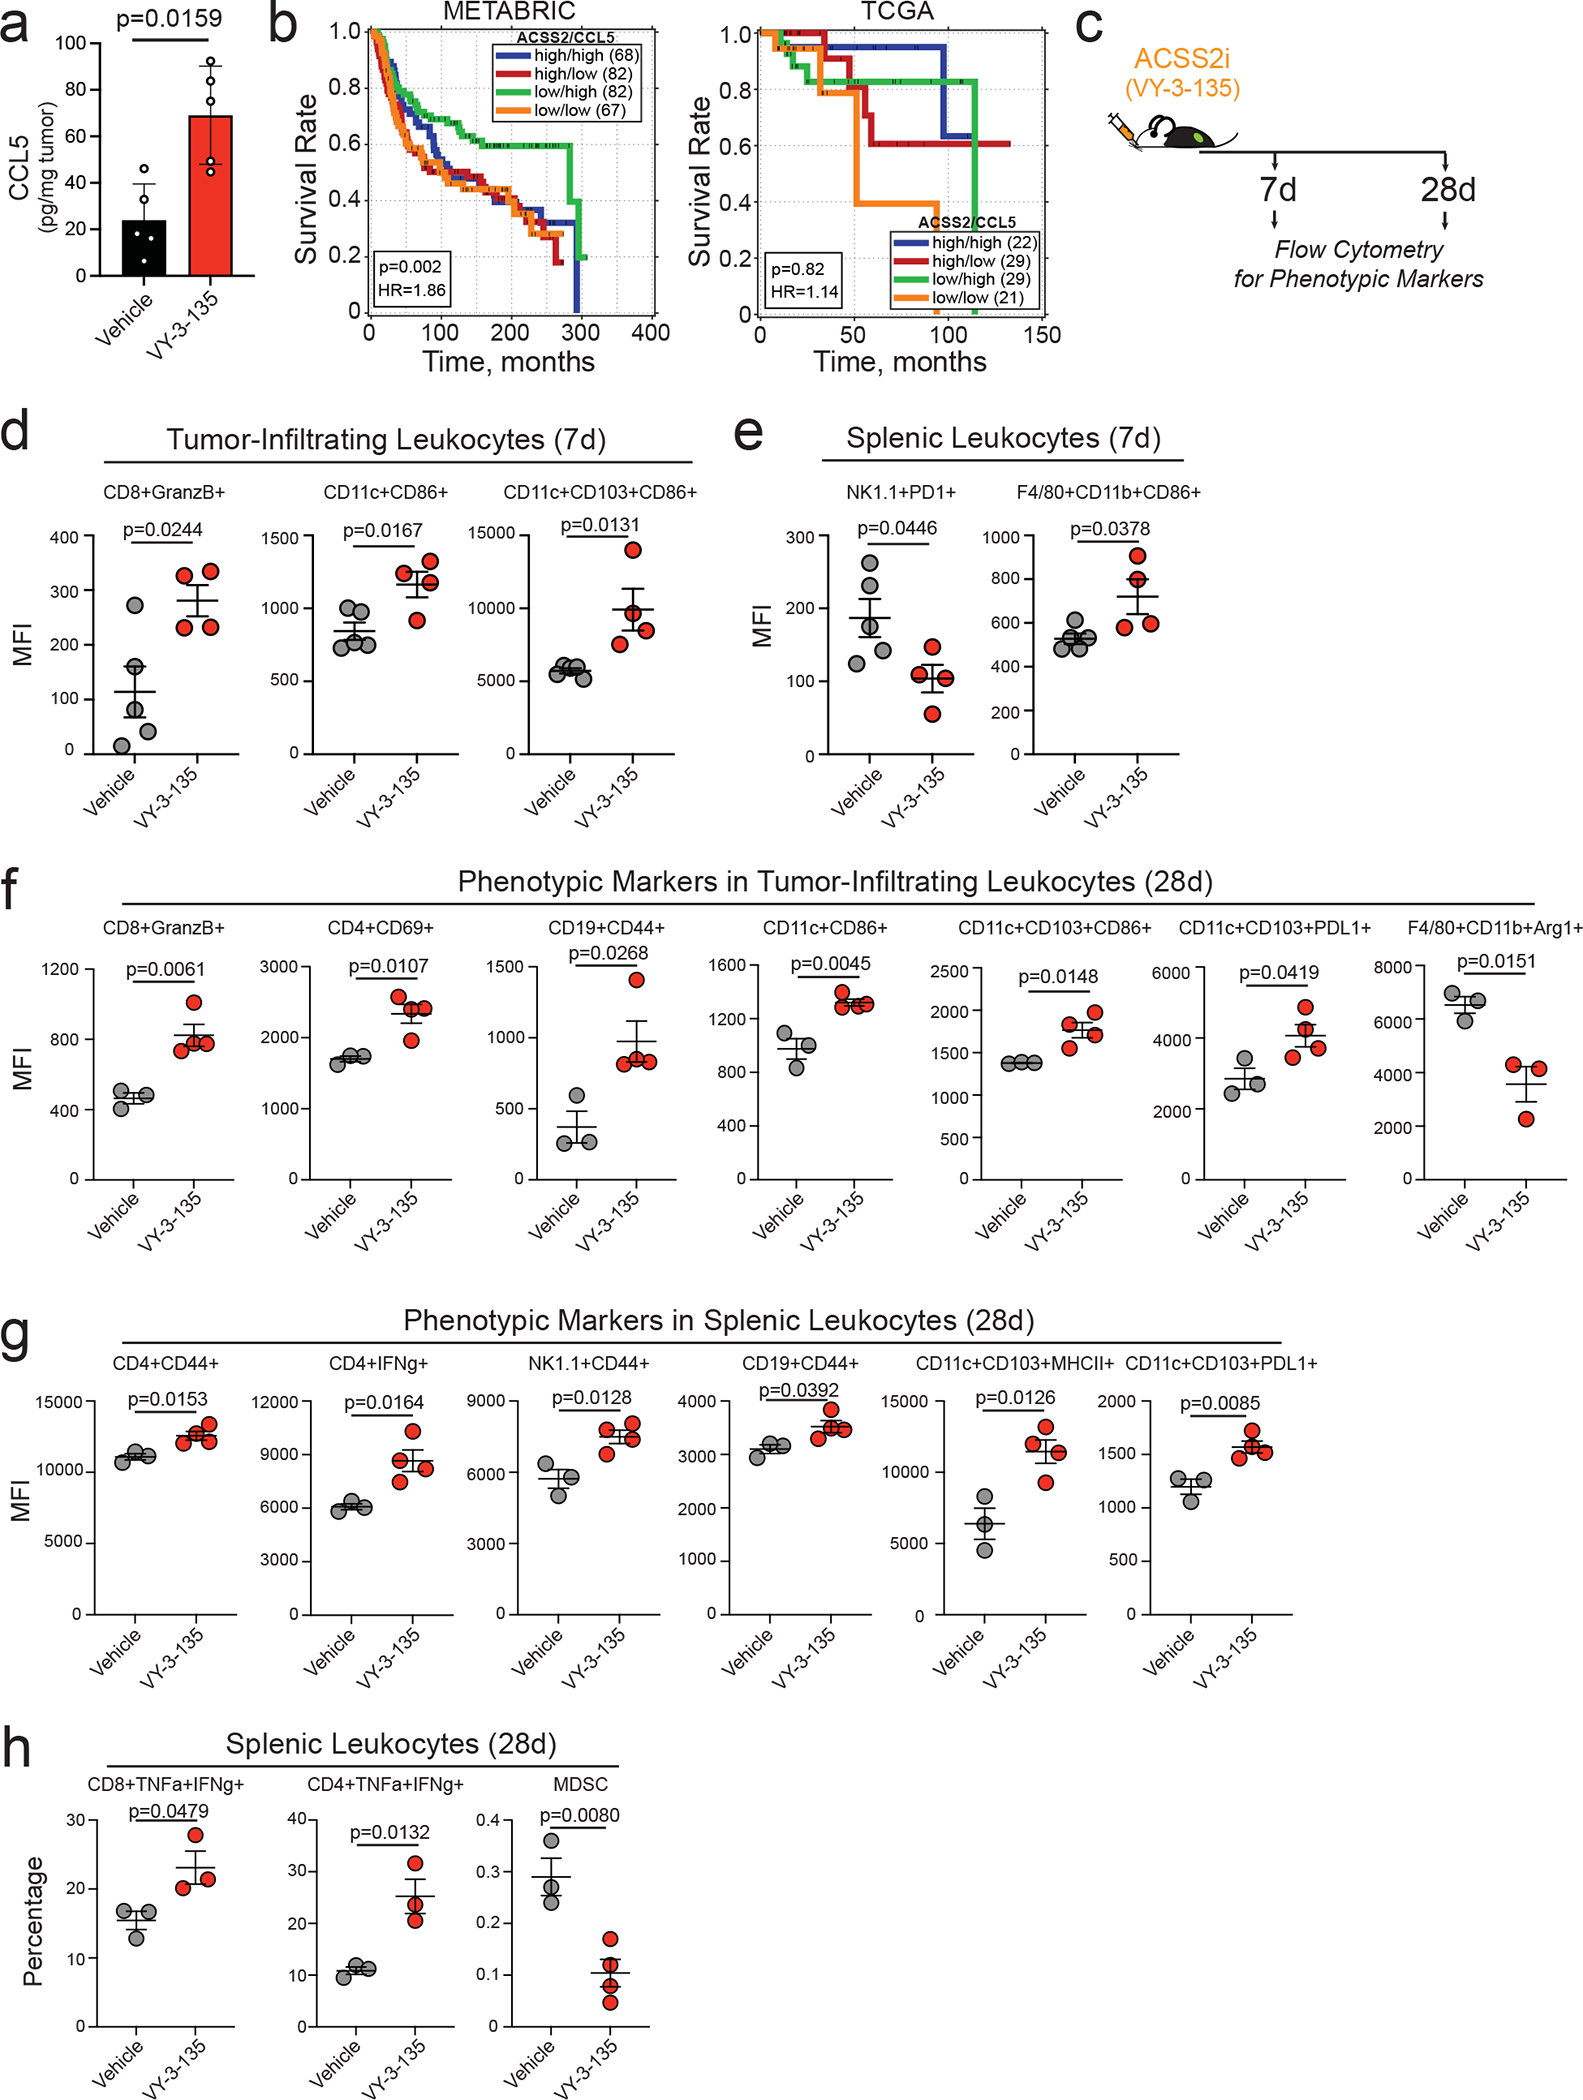
a, CCL5 protein expression in Brpkp110 tumours treated with VY-3-135. Bars represent the mean tumour volume ± S.D. P values generated using two-tailed Mann-Whitney U test. n = 5 tumor lysates. b, Correlation of ACSS2 and CCL5 expression in TNBC patient survival. Data obtained from METABRIC and TCGA databases. P values generated by a logrank test. c, Schematic of VY-3-135 treatment of tumour-bearing mice for flow cytometry analysis. d-h, Flow cytometry analysis of phenotypic markers on tumour-infiltrating leukocytes and splenic leukocytes from Brpkp110 tumour-bearing mice treated with VY-3-135 for 7 days and 28 days. P values were generated using a two-sided t test. Values represent the mean fluorescence intensity (MFI) ± SEM. Panels d-e n = 5 vehicle mice, n = 4 VY-3-135 mice; Panels f-h n = 3 vehicle mice, n = 4 VY-3-135 mice.
We next performed immunophenotyping of tumour-infiltrating and splenic leukocytes from mice treated with VY-3-135 for 7 days and 28 days (Fig. 6c). 7 days of VY-3-135 treatment showed activation of CD8+ T-cells (GranzB+) and DC (CD86+ and CD103+CD86+) (Fig. 6d). Analysis of spleens from seven-day treated tumour-bearing mice showed decreased expression of PD1 in NK-cells, while macrophages had increased expression of CD86 (Fig. 6e). The immunophenotypic changes found at 28 days further expanded the number of immune cell subsets affected by VY-3-135 treatment with activation of CD8+, CD4+, B-cells, and DCs in the tumour, but also a decrease in immunosuppressive Arg1+ TAMs (Fig. 6f). Splenic CD4+ T-cells, NK-cells, and B-cells from VY-3-135 treated mice had higher expression of CD44 (Fig. 6g). We additionally observed higher percentages of TNFα and IFNγ double positive CD8+ T-cells and CD4+ T-cells in spleens from VY-3-135 treated mice (Fig. 6h). Interestingly, we noted a marked decrease in the percent of myeloid-derived suppressor cells (MDSC) in the spleen (Fig. 6h). In sum, the immunophenotyping and scRNAseq data strongly suggest that ACSS2 inhibitors potentiate a large-scale anti-tumour immune response with activation of numerous immune cell subtypes.
T-cells and NK-cells readily oxidize acetate
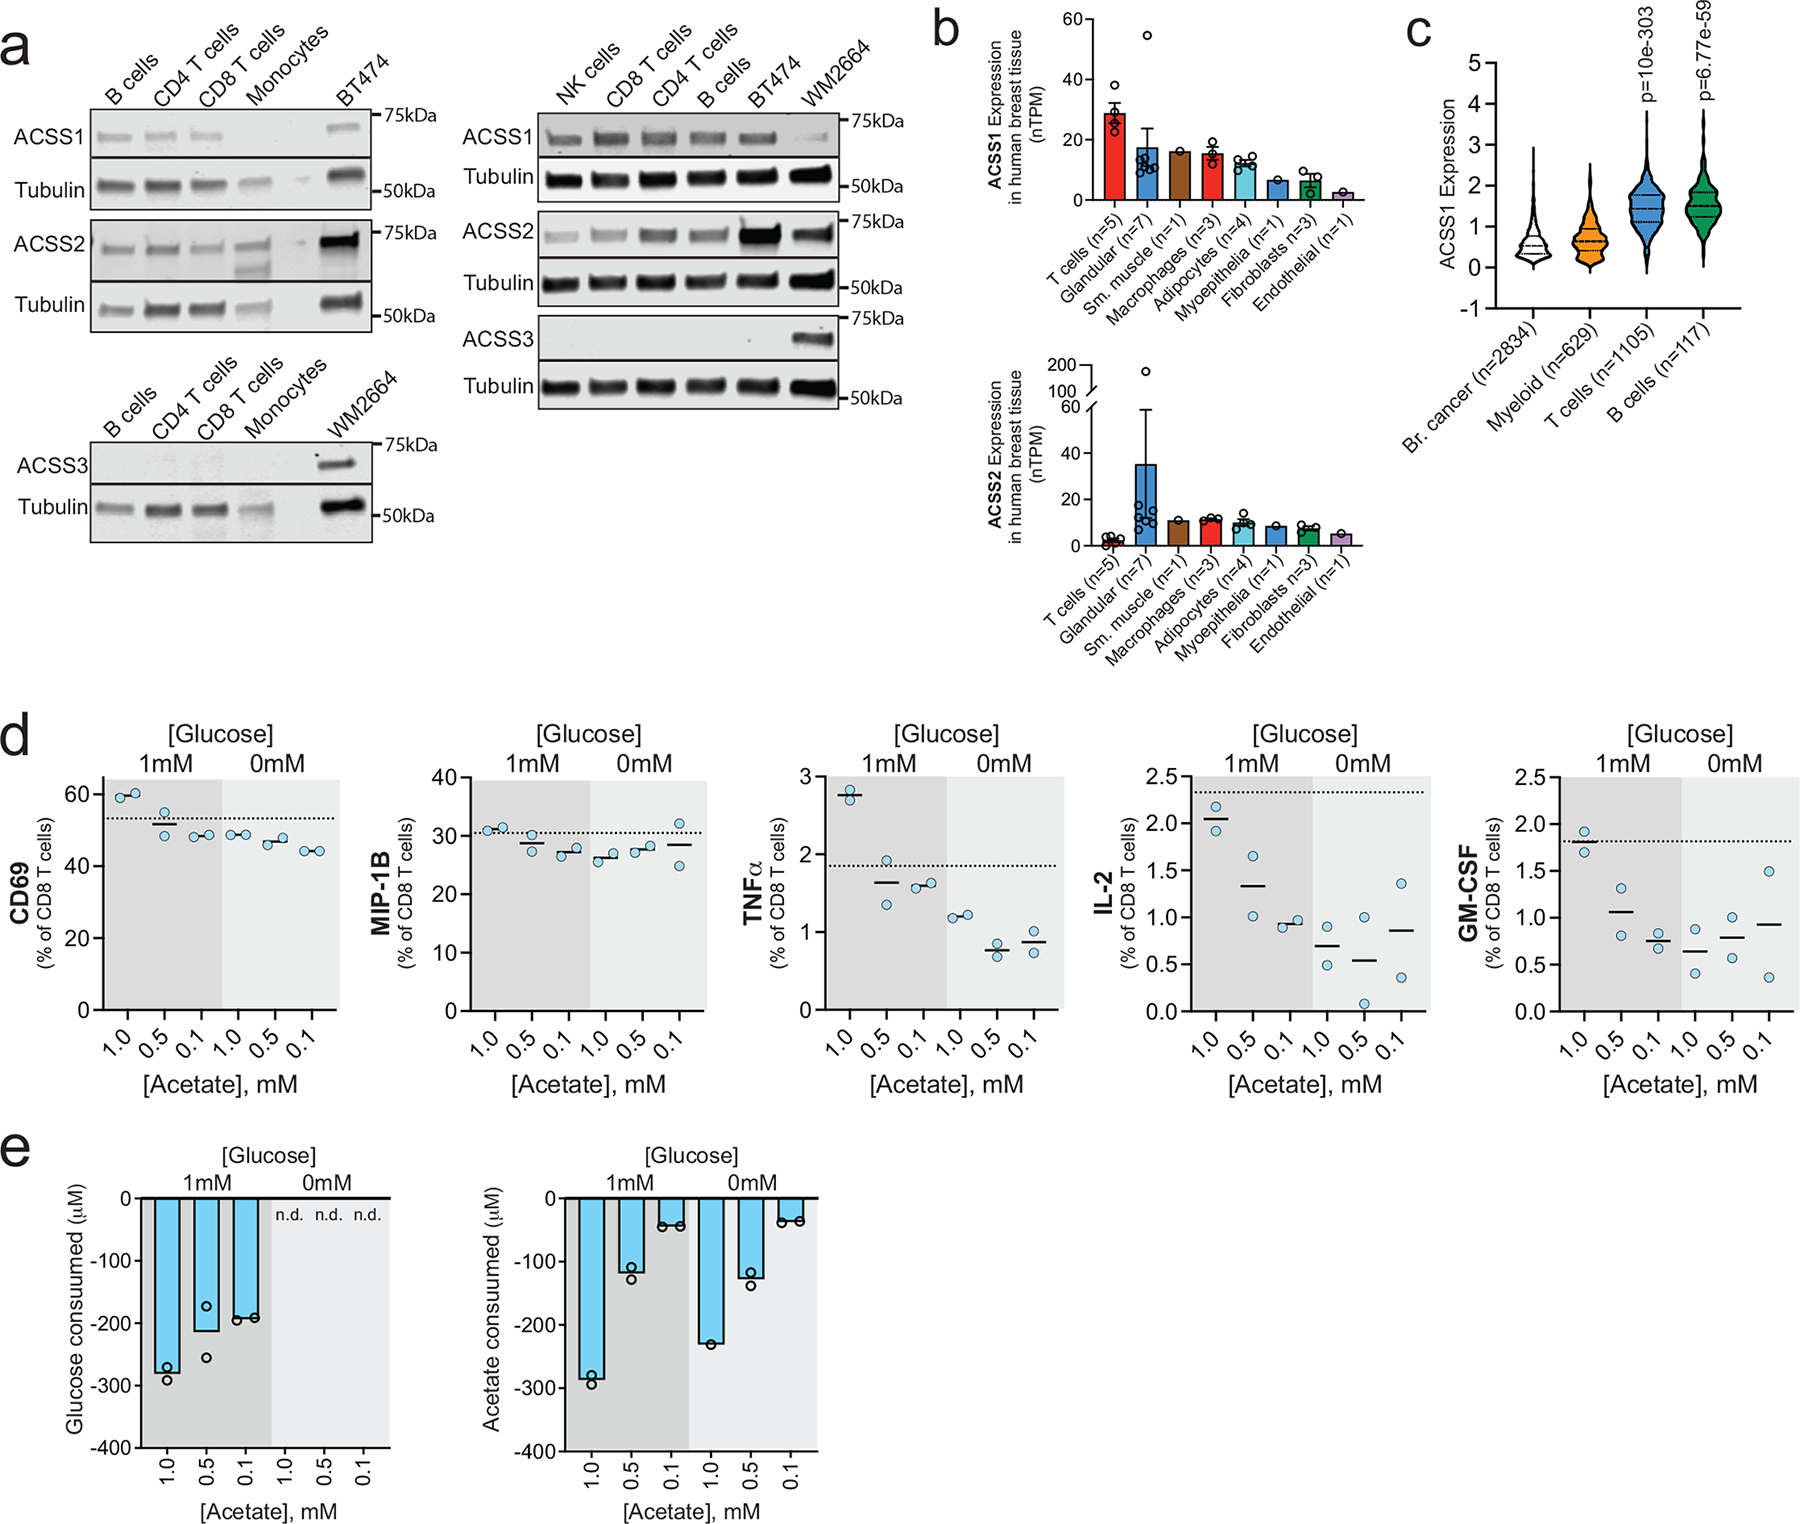
Acss2-KO or VY-3-135 inhibition of ACSS2 switched breast cancer cells from being acetate consumers to acetate producers (Fig. 7a). A recent study also showed that knockdown of ACSS2 or an ACSS2 inhibitor switches kidney cancer cells from acetate consumers to acetate producers 39. Based on these findings, we predicted that inhibition of tumour acetate metabolism might cause breast cancer cells to release acetate and that immune cells could then exploit it as a fuel source. Peripheral blood mononuclear cells (PBMC) have relatively higher expression of ACSS1 and lower expression of ACSS2 compared to hepatocytes (Fig. 7b). Furthermore, ACSS1 mRNA expression in purified mouse splenic CD8+ and CD4+ T-cells was substantially higher than bone marrow-derived macrophages (BMDM) as well as M1 and M2 macrophages (Extended Data Fig. 6a–c).
Figure 7. CD8+ T-cells and NK-cells readily oxidize acetate in a time and concentration dependent manner.
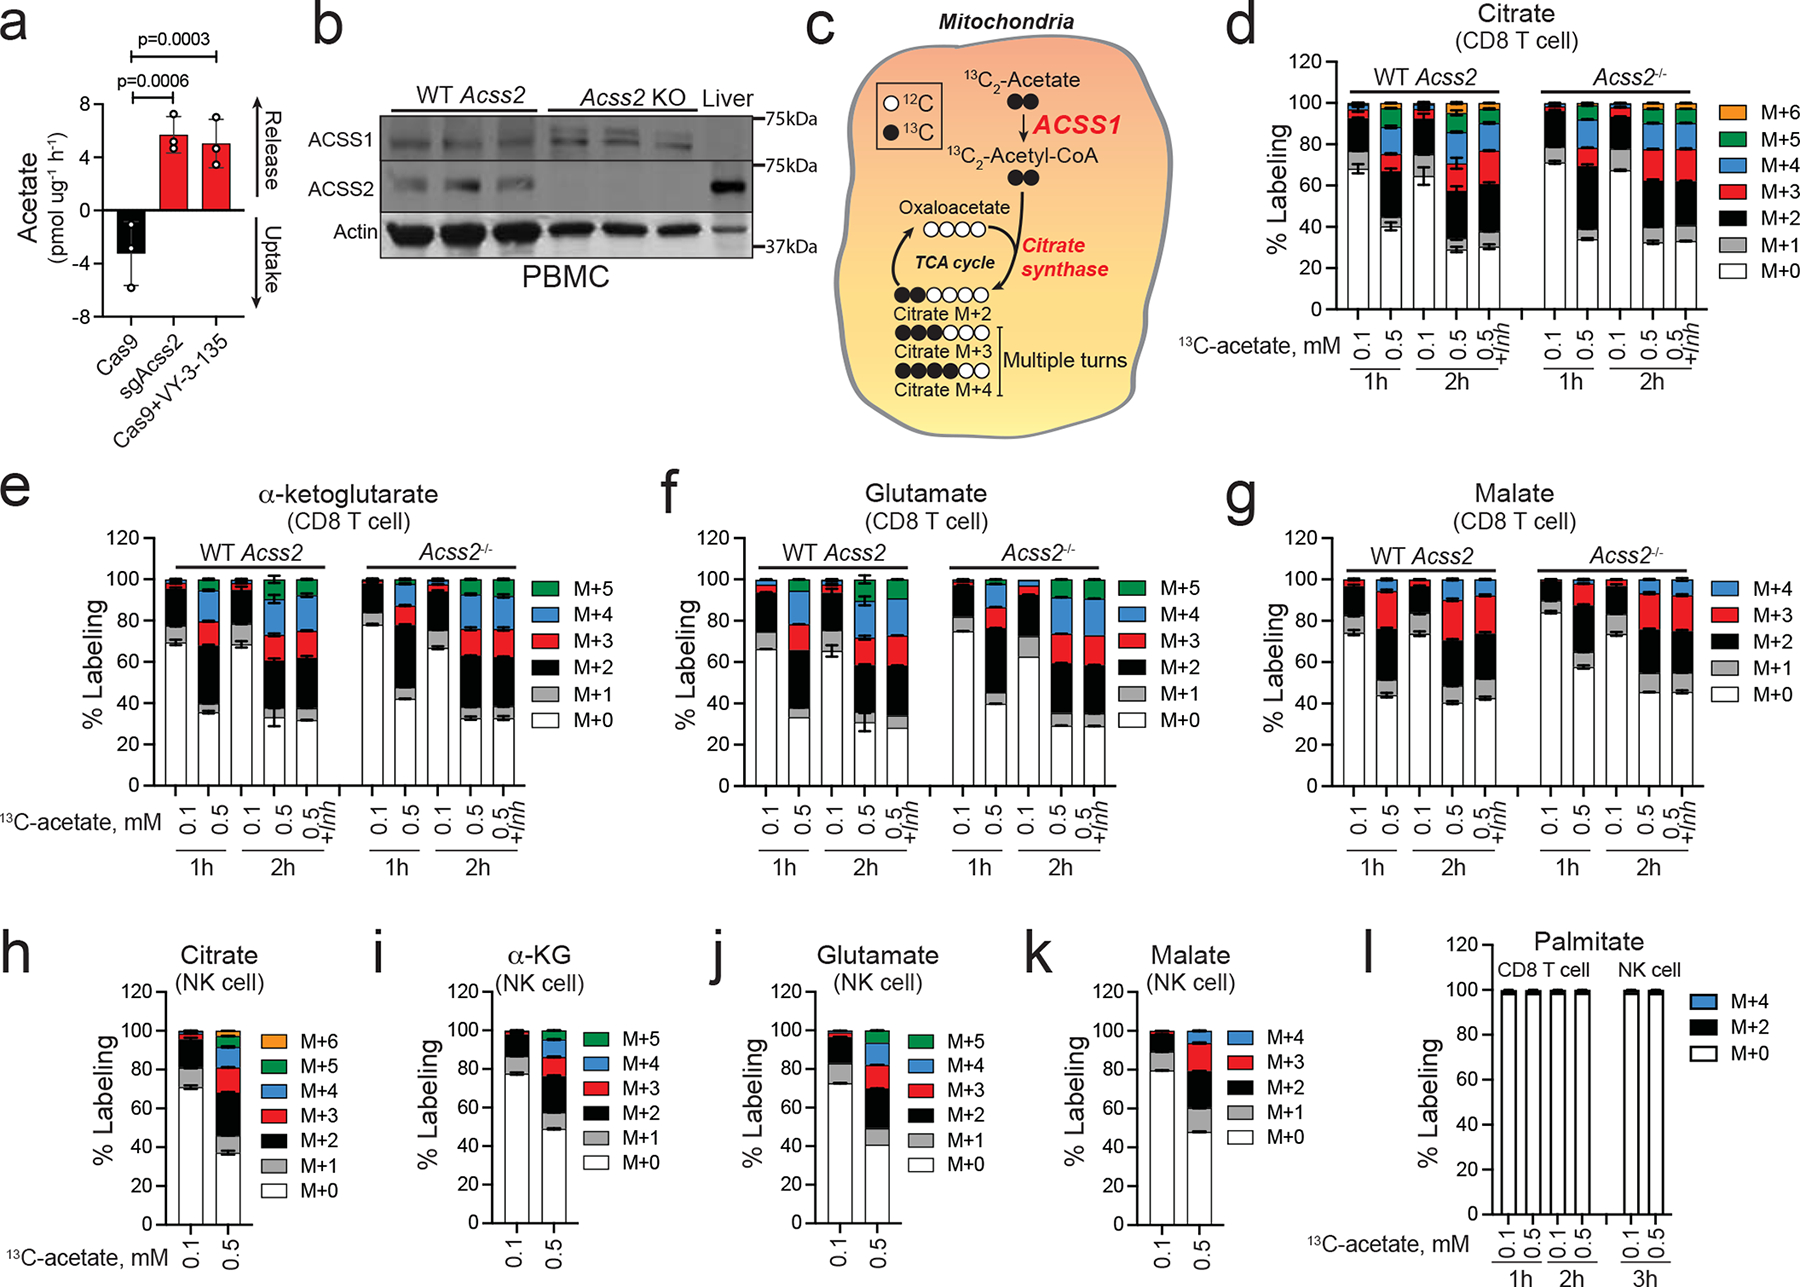
a, Acetate uptake and release from Cas9 and sgAcss2 Brpkp110 cells and Cas9 Brpkp110 treated with VY-3-135. n = 3 culture medium extracts. P values generated using two-way ANOVA Dunnett’s multiple comparisons test comparing all groups to Cas9. Values represent net acetate exchange ± SEM. b, Immunoblot for ACSS1 and ACSS2 expression in peripheral blood mononuclear cells (PBMC). Mouse liver lysates were used as a loading control for high ACSS2 low ACSS1 expression. n = 3 independent mice per group. c, Diagram displaying ACSS1-dependent 13C2-acetate stable isotope tracing into citrate and expected isotoplogue labelling patterns. d-g, Stable isotope tracing of 0.1 versus 0.5 mM 13C2-acetate into CD8+ T-cells from wild type (WT) versus Acss2-KO mice. Values represent the mass isotopologue distribution ± SEM for 13C2-acetate in metabolites at 1h and 2h after exposure. Where indicated, samples were treated with VY-3-135 (+Inh). n = 3 independent CD8+ T-cell cultures. CD8+ T-cells incubated for 2h at 100μM and 500μM n = 6 independent CD8+ T-cell cultures. h-k, Stable isotope tracing of 0.1 versus 0.5 mM 13C2-acetate into NK-cells from C57Bl/6 mice. Mass isotopologue distribution patterns ± SEM by 13C2-acetate in metabolites at 3h after exposure. n = 3 independent NK-cell cultures. l, Percent labelling of palmitate by 0.1 versus 0.5 mM 13C2-acetate into splenic CD8+ T-cells and NK cells. Values represent the mass isotopologue distribution ± SEM. n = 3 independent CD8+ T-cell and NK cell cultures.
To investigate the ability of T-cells to oxidize acetate, we performed an ex vivo stable isotope tracer study into mouse splenic CD8+ T-cells isolated from wild type and Acss2−/− mice that were exposed to physiologically relevant concentrations of 13C2-acetate (Fig. 7c). CD8+ T-cells readily oxidize acetate in a time and concentration dependent manner with 0.5 mM 13C2-acetate labelling ~70% of the citrate pool within two hours (Fig. 7d). α-ketoglutarate, glutamate, and malate also showed substantial 13C2-acetate labelling (Fig. 7e–g). Neither knockout of Acss2 nor VY-3-135 affected citrate labelling by 13C2-acetate (Fig. 7d–g). These findings show that ACSS2 expression and activity do not influence citrate synthesis in CD8+ T-cells and suggests that VY-3-135 does not inhibit ACSS1. Similar 13C2-acetate labelling patterns were produced in mouse splenic NK-cells (Fig. 7h–k). In addition, CD8+ T-cells oxidize acetate more efficiently than BMDM, M1 macrophages, or M2 macrophages, which paralleled their level of ACSS1 expression (Extended Data Fig. 6c–d). Importantly, we did not observe any carbon-13 labelling of palmitate, as evidenced by a lack of isotopologues ≥ M+4, suggesting that ACSS2-driven fatty acid synthesis is a not active in CD8+ T-cells or NK cells (Fig. 7l). Altogether, the stable isotope tracer studies suggest that blocking tumour acetate metabolism with an ACSS2 inhibitor could potentially metabolically bolster T-cells by freeing up acetate as an alternative nutrient source.
Acetate improves T-cell proliferation and functionality.
We compared ACSS1, ACSS2, and ACSS3 protein expression in human CD8+ T-cells, CD4+ T-cells, NK-cells, B-cells, and monocytes to BT474 breast cancer cells (ACSS1 and ACSS2 positive) and WM2664 melanoma cells (ACSS3 positive). Lymphocytes in general had much higher expression of ACSS1 compared to monocytes (Extended Data Fig. 7a). ACSS2 expression was comparable across cell types, while ACSS3 was not expressed at appreciable levels in any of the immune cells (Extended Data Fig. 7a). We also examined two different scRNAseq datasets that analysed gene expression in normal human breast tissue and from 26 primary breast tumors 36, 40, 41. Again, T-cells had the highest expression of ACSS1 compared to matched primary human breast cancer cells and all other cell types in normal human breast tissue (Extended Data Fig. 7b–c). Interestingly, ACSS1 expression significantly correlated with multiple gene signatures associated with lymphocyte infiltration and activation (Supplementary Table 1). We reason that the correlation between ACSS1 and immune cells is not due to ACSS1 expression in the tumor cells, but rather ACSS1 expression in tumor-infiltrating lymphocytes themselves.
We next tested if acetate supplementation improves CD8+ T-cell proliferation and function. In standard culture medium containing 10 mM glucose, acetate did not affect the proliferation of human CD8+ T-cells (Fig. 8a). In contrast, increasing acetate from 0.1 to 0.5 mM improved proliferation of CD8+ T-cells in the presence of low glucose (1 mM) (Fig. 8b).
Figure 8. Acetate improves human CD8+ T-cell proliferation and functionality when glucose is limited.
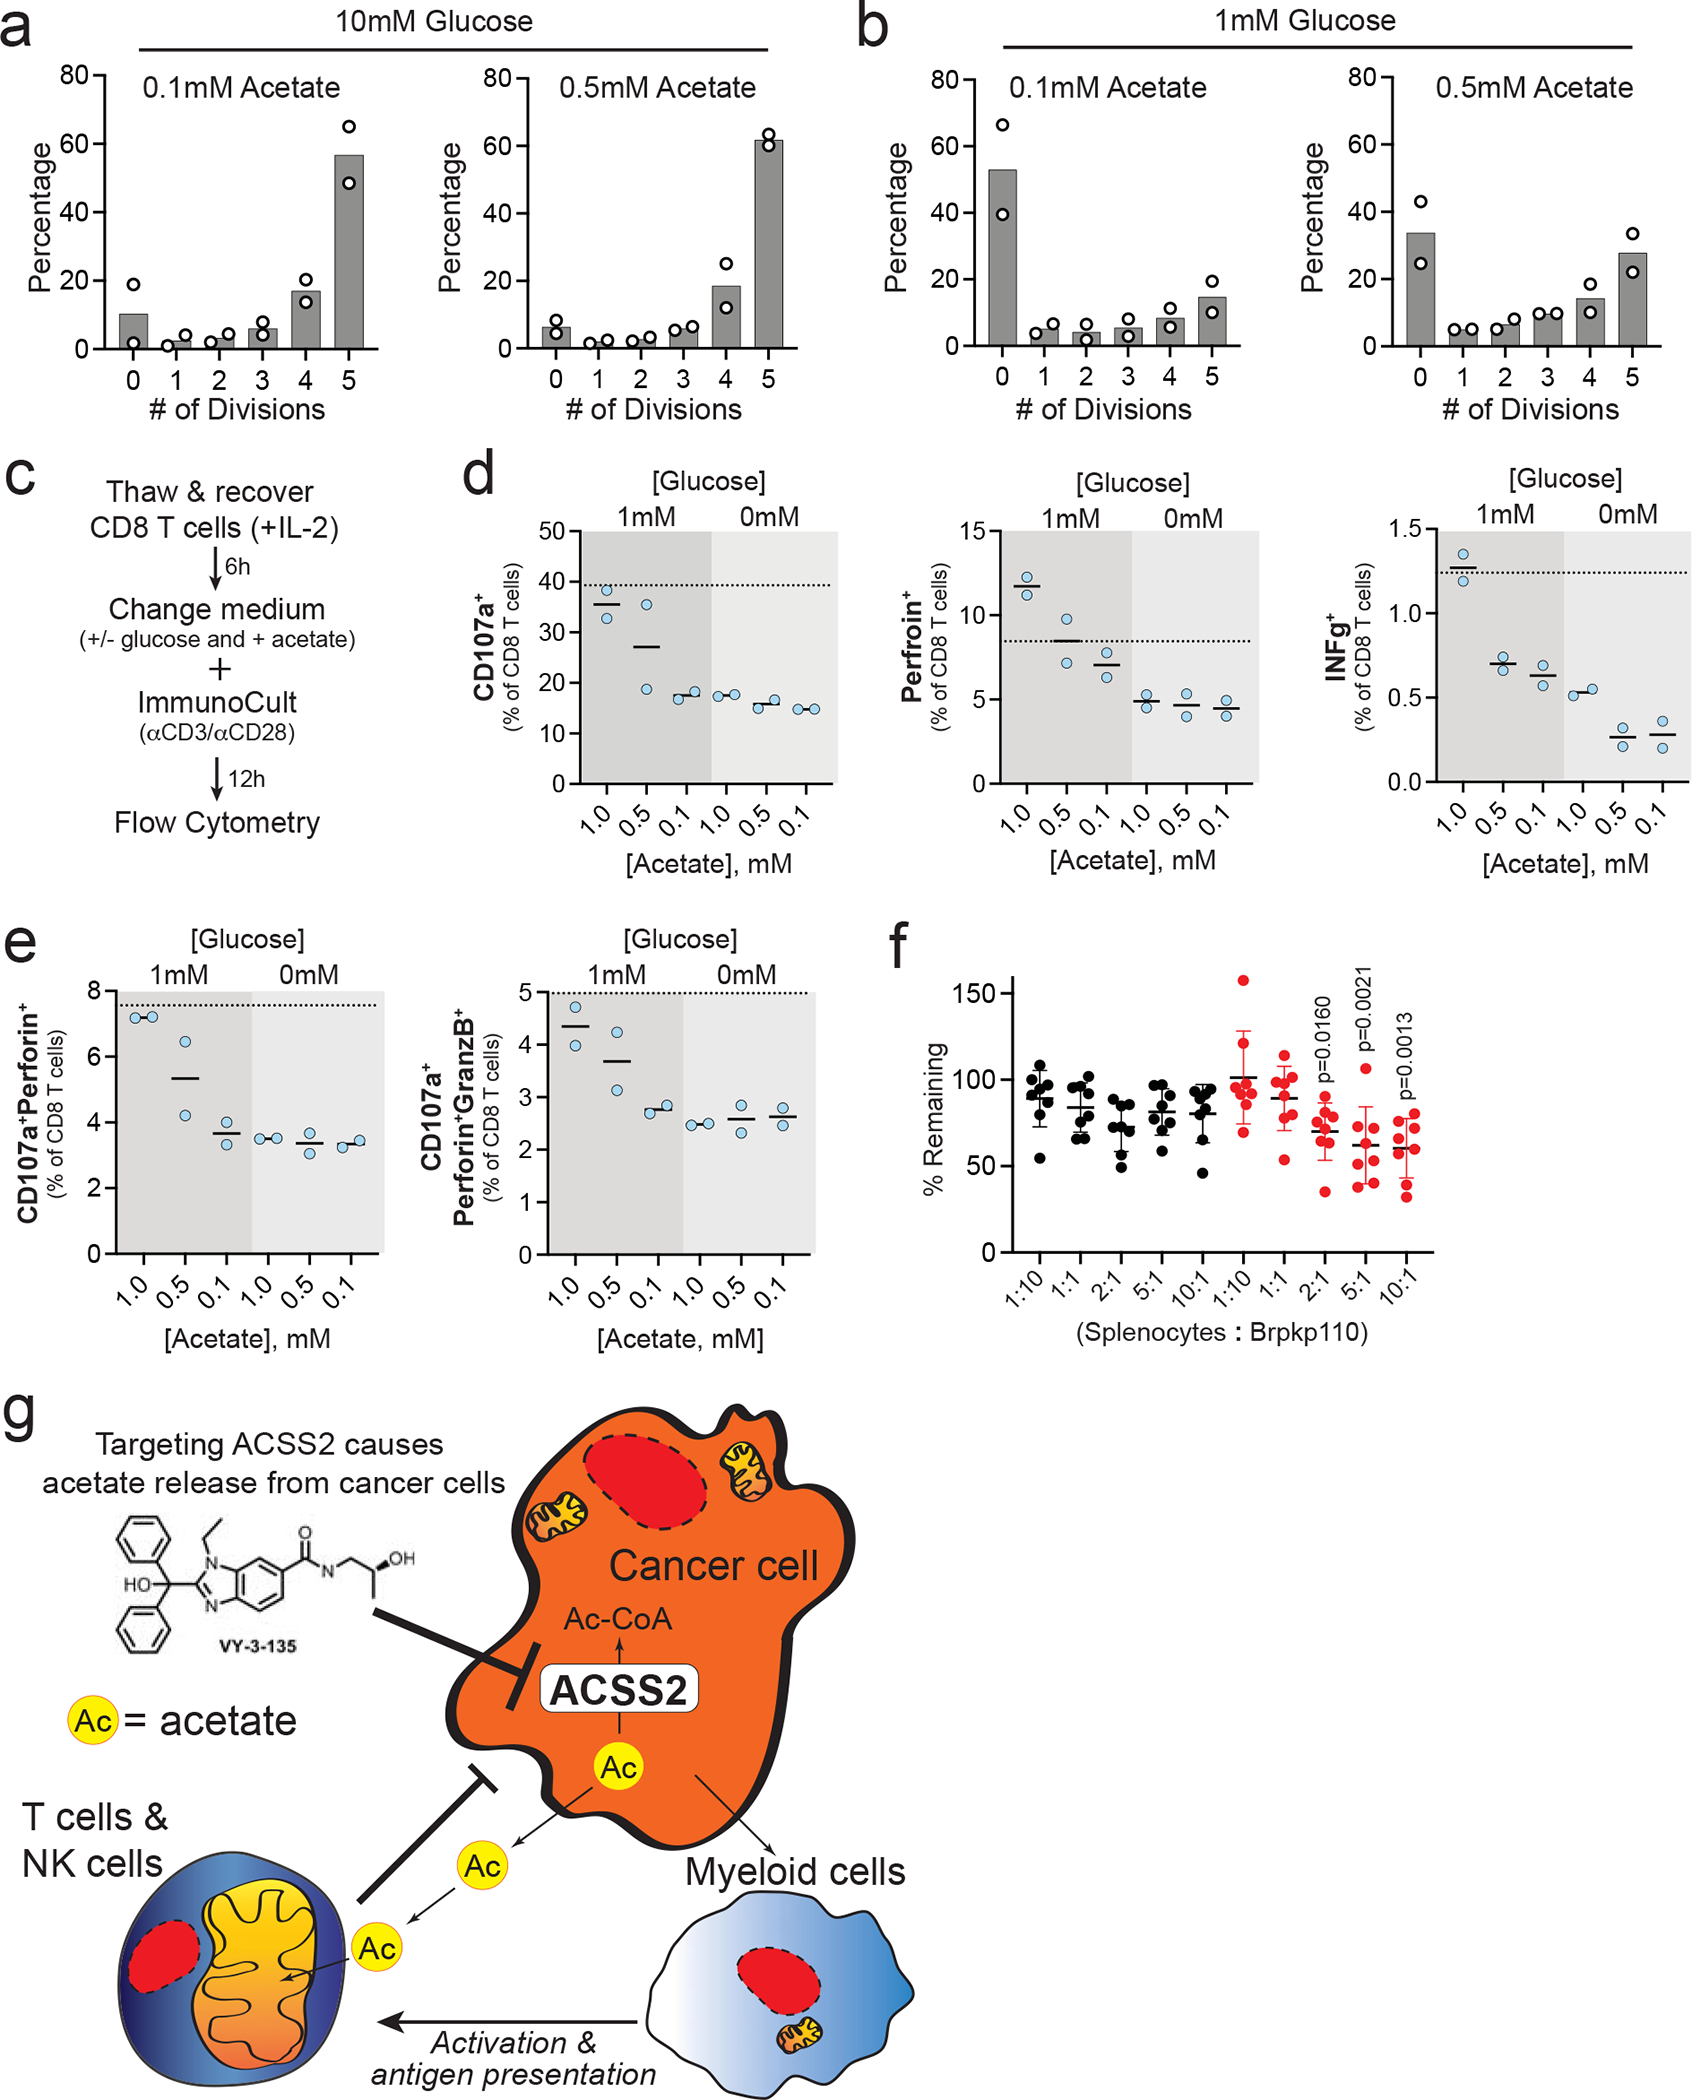
a,b, CD8+ T-cell proliferation in the presence of high (10 mM) and low (1 mM) glucose and high (0.5 mM) and low (0.1 mM) acetate. n = 2 CD8+ T-cell cultures. c, Work flow for analysis of polyfunctionality in human CD8+ T-cells. d, Expression of degranulation and activation markers on CD8+ T-cells after stimulation in the presence of increasing concentrations of acetate and two different concentrations of glucose. Dotted line represents expression levels in standard culture medium with 10 mM glucose and 0.1 mM acetate. n = 2 CD8+ T-cell cultures. Values are plotted as percent of total CD8+ T-cells. e, Percent of CD8+ T-cells displaying polyfunctionality after stimulation in different concentrations of acetate and glucose. n = 2 CD8+ T-cell cultures. Values are plotted as percent of total CD8+ T-cells. f, Splenocyte cytotoxicity assay displaying the mean percent of Brpkp110 cells remaining after 3 days of co-culture with total splenocytes at the indicated ratios. Black circles represent WT (Cas9) Brpkp110 cells and red circles represent Acss2-KO (sgAcss2) Brpkp110. n = 8 co-cultures of cells. Data are presented as a mean ± SD. P values generated using one-way ANOVA and Dunnett’s multiple comparisons test compared to 1:10 splenocyte:Brpkp110 ratio. g, Schematic cartoon illustrating how targeting acetate metabolism promotes an anti-tumour immune response.
We also tested the ability of acetate to improve T-cell function at different glucose concentrations (Fig. 8c). Lack of glucose (0 mM) impaired expression of degranulation and cytotoxicity markers in T-cells, suggesting that some level of glucose is necessary for T-cell activation in response to CD3/CD28 stimulation (Fig. 8d–e and Extended Data 7d). In contrast, acetate improved human CD8+ T-cell function (Fig. 8d) and polyfunctionality (Fig. 8e) in a concentration-dependent manner in the presence of 1 mM glucose. Importantly, neither glucose nor acetate was depleted from the medium in the overnight cultures (Extended Data Fig. 7e). These results suggest that acetate can metabolically bolster CD8+ T-cell metabolism and, by extension, CD3/CD28-stimulated degranulation and effector functions when glucose availability is low.
We tested the ability of total mouse splenocytes to target and eliminate mouse breast cancer cells in co-culture. While splenocytes modestly decreased WT breast cancer cell survival, Acss2-KO breast cancer cells were much more sensitive to co-culture with splenocytes with cytotoxic effects starting at a 2:1 splenocyte to cancer cell ratio (Fig. 8f).
Since ACSS2 expression directly correlates with acetate consumption in cancer cells it is possible that targeting ACSS2 within a tumour leads to decreased acetate uptake by tumour cells, thereby increasing the local availability of acetate within the tumour microenvironment. Likewise, blocking ACSS2 prevents cancer cells from recapturing acetate released by deacetylation and pyruvate decarboxylation reactions 14, 39. Acetate may then be more readily available and consumed by immune cells in the tumour microenvironment, such as T-cells and NK-cells (Fig. 8g). We predict this is made possible by the relatively high expression of ACSS1 in lymphocytes which helps fuel their anti-tumour immune responses. It is likely that myeloid cells in the tumour microenvironment also contribute to the anti-tumour immune response, particularly DCs. The low expression of ACSS1 in monocytes and macrophages suggests innate immune cells might recognize and react to changes in acetate metabolism through mechanisms independent of ACSS1. Further studies are warranted to better understand the impact of tumour acetate metabolism on innate immunity and to evaluate the influence of ACSS1-mediated acetate metabolism on T cell and NK cell function.
DISCUSSION
The cell intrinsic, pro-tumour roles of ACSS2 in supporting acetyl-CoA metabolism have been well documented, where depletion or loss of ACSS2 effectively inhibits tumour growth in immune-deficient models 11, 15, 17–19, 22, 23, 39. However, none of these studies examined the extrinsic impact of blocking tumour acetate metabolism on tumour-infiltrating leukocytes. We show that CRISPR deletion or pharmacological inhibition of ACSS2 in syngeneic immune-competent models of breast cancer significantly potentiates anti-tumour immunity and highlights the ability of ACSS2 inhibitors as metabolic immunomodulator therapies that dually target tumour metabolism while also promoting anti-tumour immunity.
The concept of nutrient exchange between tumour cells and stromal cells is well-studied 42, 43. The so-called reverse Warburg effect was first described in breast cancer where cancer-associated fibroblasts secrete lactate and pyruvate which are then consumed by cancer cells 44. More recently, local fibroblasts were shown to supply lipids and alanine to pancreatic ductal adenocarcinoma cells 45, 46. Acetate is constantly generated in cells by deacetylation and pyruvate decarboxylation reactions and without ACSS2 to recapture that released acetate, it is then secreted as a waste product 13, 14, 47, 48. We previously showed that uptake of acetate by cancer cells is largely dictated by ACSS2 expression, such that high ACSS2 expressing cells tend to consume acetate, while low expressors tend to produce acetate 14. We propose that inhibition of ACSS2 prevents consumption of acetate by the tumour and switches cancer cells from acetate consumers to acetate producers. The ensuing increase in availability of acetate created by decreased tumour consumption combined with increased release from ACSS2-inhibited tumour cells generates a readily available alternative nutrient source for tumour-resident lymphocytes capable of exploiting acetate as a fuel source (i.e., immune cells with high ACSS1 expression). In this manner, acetate could metabolically bolster anti-tumour immunity. However, further analyses are needed to verify the role of acetate and ACSS1 in anti-tumor lymphocyte functions.
While ACSS1 expression correlated with immune cell infiltration and activation in breast cancer, ACSS2 expression did not. However, a limitation of our current study is the lack of clinical validation of expression of ACSS1 and ACSS2 with immune cell infiltration and activation markers by immunohistochemistry or multiplex immunofluorescent staining in breast cancer patient samples.
Future studies should examine whether targeting acetate metabolism can be used in combination with other metabolic therapies. For instance, it was shown that blocking glutamine metabolism with 6-diazo-5-oxo-l-norleucine (DON) decreased ACSS2 expression in tumours cells and increased ACSS1 expression in T-cells, suggesting acetate oxidation in effector T-cells is part of the mechanism by which DON elicits better anti-tumour immune responses 29. It has also been shown that acetate can directly interact with and activate glutaminase thereby promoting glutaminolysis 49. There appears to be an emerging link between acetate metabolism and glutamine metabolism in cancer that remains to be characterized.
The main source of acetate production in the human body is the gut microbiome which produces millimolar concentrations of acetate in the lumen of the large intestine 13. It therefore stands to reason that the immune system might recognize acute increases in acetate as a sign of bacterial infection. Acetate does enhance innate immune responses by acting on both innate-like lymphocytes and neutrophils in models of C. difficile infection 50. Furthermore, it has been shown that at sites of L. monocytogenes infection local concentrations of acetate exceed 5 mM and under these conditions effector T-cells will preferentially use acetate over glucose for production of acetyl-CoA 51. They also showed that Ly6C surface expression increased in a time- and dose-dependent manner on OT-I memory T-cells chronically exposed to acetate 51. Ly6C is also a marker of central memory T-cells and is important for their homing function 52. Our scRNAseq analysis showed increased Ly6C2 expression in CD8+ T-cells suggesting that blocking acetate metabolism may also be playing a role in memory T-cells. In addition, histone acetylation plays a key role in memory CD8+ T cell responses 53. Under glucose-restricted conditions, acetate promotes histone acetylation and IFNγ production in CD8+ tumour-infiltrating T-cells in an acetyl-CoA synthetase dependent manner 54. Furthermore, acetate supplementation or enforced expression of ACSS1 enhances the functionality of T-cells adoptively transferred into B16 melanoma tumour-bearing mice 55. Our current findings suggest that acetate is used by CD8+ T-cells and NK-cells when glucose availability is low or competition between cancer cells and stromal cells for nutrients is challenging, such as often occurs in the harsh tumour microenvironment 56, 57. Tumour cells have been shown to suppress T-cell function by competing for glucose, even in the presence of robust tumour antigens, indicating that metabolic competition can dampen T-cell driven anti-tumour immunity and promote cancer progression 58. Blocking tumour acetate metabolism by targeting ACSS2 may help alleviate this competition, not only by preventing cancer cells from using acetate but also making acetate more available to immune cells. We propose that this nutrient exchange is made possible due to the differential expression of ACSS1 and ACSS2 in lymphocytes versus breast cancer cells.
The crosstalk between NK-cells and T-cells in the setting of cancer is complex 59. It is known that NK-cells are able to enhance T-cell effector functions and work with T-cells to effectively regulate anti-tumour immunity 60. NK-cells can drive tumour inflammation through crosstalk with conventional type 1 DC to recruit and present tumour antigens to CD8+ T-cells in lymph nodes that then induce anti-tumour immunity and tumour regression 61–63. It has been proposed that chemokines CCL5 and XCL1, both of which were highly upregulated in ACSS2 inhibitor-treated tumors, can be secreted by NK-cells to promote cDC1 recruitment and immune control of tumors 62. Interestingly, it is exactly these three cell types (i.e., CD8+ T-cells, NK-cells, and CD103+ DC) that consistently displayed markers for activation upon ACSS2 inhibition.
Our findings offer a different perspective on acetate metabolism in cancer and highlight a role for ACSS2 in this process as a regulator of host immune responses to cancer. As first-in-human clinical trials with ACSS2 inhibitors for cancer treatment are currently underway (NCT04990739), we propose that small molecule inhibitors of ACSS2 hold excellent promise as metabolic immunomodulators that could potentially enhance the effectiveness of standard-of-care chemotherapy or potentially be applied in situations where tumours are refractory or have acquired resistance to other immunotherapies.
Online Methods:
Ethics statement
All animal experiments were approved by the Institutional Animal Care and Use Committee (IACUC) at the Wistar Institute and were performed in an Association for the Assessment and Accreditation of Laboratory Animal Care (AAALAC) accredited facility.
Statistics & Reproducibility
No statistical method was used to predetermine sample size. No data were excluded from the analyses. For mouse studies, the investigators were not blinded to allocation during experiments and outcome assessment. Data met the assumptions of the statistical tests used.
Reagents, cell lines and cell culture
Brpkp110 and A7C11 cells were derived at the Wistar Institute, as previously described in 64–67, from C57Bl/6 mice with loss of p53 and activating mutations in Kras (A7C11) and myristoylated-Pik3ca (Brpkp110). T11 and T12 TNBC cells were gifted from Dr. Jeffrey M. Rosen (Baylor College of Medicine) and were derived from p53 null BALB/c mice (T11 and T12 68–70). T11 also contain a Kras (G12V) mutation 71. 4T1 TNBC were gifted from Dr. Dmitry Gabrilovich (Wistar Institute) and originally obtained from Dr. S. Ostrand-Rosenberg (University of Maryland, Baltimore, MD). BT474 cells were obtained from ATCC (HTB-20). WM2664 were derived at the Wistar Institute by Dr. Meenhard Herlyn’s laboratory. None of the cell lines used are listed in the known misidentified cell lines maintained by the International Cell Line Authentication Committee. The identity of all cell lines is routinely confirmed by STR profiling done at ATCC, and we never use any lines for more than six months after thawing. All cells teted negative for Mycoplasma by using a PCR Mycoplasma Detection Kit from Applied Biological Materials (Cat# G238). All cancer cells were cultured in 1X DMEM/F-12 50/50 supplemented (Life Technologies) with 10% fetal bovine serum (FBS) (Life Technologies) and 1X penicillin-streptomycin. T cells were cultured in RPMI 1640 (VWR) with 10% FBS. VY-3-135 was synthesized by the Wistar Molecular Screening Facility.
Lentiviral transduction
CRISPR-Cas9 pools of Brpkp110, A7C11, 4T1 and T11 cells were generated using single guide RNAs against exon 1 or 3 (sgAcss2 #1 tcgtgaggagaccggcgccg; sgAcss2 #3 aaacatctgctacaacgtgc) in mouse Acss2. Cas9 and guide RNAs were introduced into cells by lentiviral infection. Briefly, HEK293T-cells were transfected (Lipofectamine 2000) with psPAX2, pVSV-G, and pLentiCRISPRV2-blast containing a single guide RNA cloned into the BsmBI site (GE Healthcare). Transduced pools of cells were selected using blasticidin S. Following selection, single cells were sorted into 96 well plates and individual Cas9 (WT) or sgACSS2 (Acss2-KO) (e.g., sgAcss2 1–3 indicates guide RNA targeting exon 1 clone #3) cell lines were screened for ACSS2 expression. WT and KO clones displayed similar proliferation rates and morphology. To generate single guide resistant Acss2 the gateway cloning system was used to generate pLenti CMV (Addgene #17454) containing Flag-tagged mouse Acss2 (SinoBiological #MG53064-NF). Site directed mutagenesis was then performed to mutate the +4 and +7 of the sgAcss2 seed sequences in exons 1 and 3 of Acss2 72. Lentiviral transduction of WT and Acss2-KO cell lines was then performed as described above with pools selected with hygromycin.
Western blotting
Cells were lysed in 1X Laemmli buffer (BioRad) supplemented with 10% beta-mercaptoethanol. Lysates were heated at 95°C for 5 minutes and resolved using Mini-PROTEAN precast polyacrylamide gels (BioRad) and blotted onto nitrocellulose membranes using Trans-Blot SD Semi-Dry Transfer Cell (BioRad). Blots were blocked using 5% milk in Tris-buffered saline solution with Tween-20 (TBST) for 1 hour at room temperature. Blots were incubated with primary antibodies overnight at 4°C. Primary antibodies were diluted in 1% BSA and 0.05% sodium azide in TBST. Antibodies were purchased from the following vendors: Cell Signalling (ACSS2 #3658); ProteinTech (ACTB #60008; ACSS1 #17138; TUBA1B #66031); Sigma-Aldrich (ACSS3 #HPA047956). Secondary antibodies were purchased from Li-Cor Biosciences (goat anti-mouse #926–32210 and donkey anti-rabbit #926–68073) in TBST. Incubation with the secondary antibody occurred at room temperature for 1 hour. Blots were imaged using a Li-Cor Odyssey infrared imager.
Acss2−/− mice
Acss2−/− mice were the kind gift of Dr. Douglas Strathdee (Cancer Research UK The Beatson Institute). To generate Acss2-KO mice, a CRISPR/Cas9 targeting sequence to exon 3 of the Acss2 gene was created. Knockout clones were generated using embryonic stem cells from 129P2 mice. The Acss2−/− mouse contains a 1bp insertion that causes a frameshift in exon 3 and a premature stop codon in exon 4. Acss2−/− mice on a mixed 129P2 and C57Bl/6 background were crossed for an additional 8 generations onto the C57BL/6J background and are ~99% congenic by SNP analysis. Acss2−/− mice are identified by PCR amplification and Sanger sequencing of exon 3. All mice were maintained in ventilated cages at 22–23°C with 40–60% humidity on 12 hour light/dark cycle. Mice had unrestricted access to water and chow (LabDiet Pico-Vac Mouse Diet 20 Irradiated; 5062-RHI-W 18).
Tumour studies
5×10⁵ A7C11 cells, 5×10⁵ Brpkp110 cells, 2.5×10⁴ T11 cells, 2.5×10⁴ T12 cells, and 5×10⁵ 4T1 cells in 100 μl PBS:Matrigel (growth factor reduced Corning Cat# 356231) were injected into 6–12 week old female NSG mice (Wistar Institute), BALB/c mice (Charles River Laboratories), C57Bl/6 mice (Charles River Laboratories), C57Bl/6 Rag2−/− (courtesy of Glenn F. Rall at Fox Chase Cancer Center). Brpkp110 tumours in Figure 1 were injected orthotopically into the mammary fat pad. For all other tumour studies, cancer cells were injected into the subcutaneous flank of the mice. According to the institutional guideline, any mouse whose tumor volume measured ≥ 2 cm3 was immediately euthanized that day.
For drug studies, mice were randomized and treated daily by intraperitoneal (IP) injections or oral gavage with vehicle (10% DMSO, 20% solutol, 70% water containing 0.5% Tween20) or 100 mg/kg VY-3-135 starting on the day following tumour injection or as indicated in the figure or its legend. For multi-drug studies VY-3-135 was administered daily by oral gavage at 100mg/kg, doxorubicin (VWR #103801) was IP injected once weekly (5mg/kg), Palbociclib (VWR #76203) was administered daily by oral gavage (100mg/kg) and paclitaxel (ThermoFisher Scientific #62734.ME) was administered once per week by IP injection (40mg/kg).
For T-cell depletion studies mice were injected IP with 200 μg of anti-CD8 (BioXCell BE0061) and/or anti-CD4 (BioxCell BP0003–1) three days prior to tumour injection (for T-cell depletions only) and every 3 days thereafter. For NK-cell depletion mice were injected with 50 μg of anti-NK1.1 (BioXCell BE0036) one day prior to tumour injection and every 4 days thereafter. Isotype control mice were treated in the same manner using rat IgG2b isotype control (BioXcell BE0090). All depleting antibodies were diluted in InVivoPure pH 7.0 Dilution Buffer (BioXcell IP0070).
Tumours were measured thrice weekly via caliper measurement and tumour volume calculated as the weekly average of (L x W2)/2 (where L is the longer of the two measurements). At the study conclusion all tumours were resected, flash frozen in liquid nitrogen, and stored at −80° C for downstream analysis or immediately stored in formalin for further analysis and processing. No significant differences in body weight were noted between groups in any of the studies. No statistical methods were used to pre-determine samples sizes but our samples sizes are similar to those reported in previous publications 11, 64, 73. Data were plotted and analysed using GraphPad Prism 10.0.0. Further information on research design is available in the Nature Research Reporting Summary linked to this article.
Flow Cytometry
~100 μl of blood was collected from the submandibular vein and stored on ice in DMEM/F12 + 10% FBS until all sample collections had finished. Erythrocytes and debris were eliminated by density centrifugation using Lympholyte M (Cedarlane #CL5031). Peripheral blood mononuclear cells were collected from the buffy coat, stained for 30 minutes on ice in 3% FCS, washed, and subjected to flow cytometric analysis using a BD LSRII flow cytometer. The following fluorescently conjugated antibodies were used FITC-CD3 (Biolegend #100203), APC-Cy7-CD45 (Biolegend #103115), AF700-CD45 (Biolegend #103127), AF700-CD8a (Biolegend #100729), PE-CD4 (Biolegend #100407), PerCP-Cy5.5-CD19 (Biolegend #152405), BV421-NK1.1 (Biolegend 108731), and PE-NKp46 (Biolegend #137604). Data was analysed using FlowJo software version 10.6.1 first by gating on single cells followed by lymphocytes by forward and side scatter.
For phenotypic marker analysis of tumour-infiltrating leukocytes and splenic leukocytes single cell suspensions of tumour and spleen were prepared as previously described 74–76 and stained for surface and intracellular markers. Samples were acquired on BD FACS Symphony flow cytometer. Data were analysed using FlowJo v10.6.1 (Treestar Inc.). Data were plotted and analysed using GraphPad Prism 10.0.0. Fluorescent conjugated antibodies used for flow cytometry are listed in the Nature Portfolio Reporting Summary.
Ex vivo studies on mouse CD8+ T-cells, NK-cells and BMDMs
CD14+CD11b+ bone marrow cells were isolated from C57Bl/6J mice before seeding in mCSF (40 ng/mL; Biolegend 576304) for five days. M1 and M2 macrophages were polarized using LPS (Sigma L2654) and IFNγ (Peprotech 31505), 100 ng/mL each, or IL-4 (10 ng/mL; Sigma SPR3211), respectively. Differentiation was confirmed by qRT-PCR. For T-cell and NK-cell purification, total splenocytes were isolated from wild type or Acss2−/− mice C57Bl/6 mice and then enriched for T-cell fractions using MagniSort Mouse CD4 (8804–6821-74) or CD8 (8804–6822-74) T-cell Enrichment Kits (ThermoFisher) or NK-cells using MagniSort Mouse NK-cell Enrichment Kit (501125089).
Proliferation and polyfunctional assays on human CD8+ T-cells
Donor human CD8+ T-cells, CD4+ T-cells, B-cells, and monocytes were obtained from the University of Pennsylvania Human Immunology Core. Cryopreserved human CD8+ T-cells were recovered in RPMI plus 10% FBS and IL-2 (20 ng/mL) for 4 to 6 hours. Cells were then counted, resuspended in their respective culture medium supplemented with 10 mM glucose, 1 mM glucose, or 0 mM glucose and 1 mM acetate, 0.5 mM acetate, or 0.1 mM acetate and stimulated with Immunocult (CD3/CD28/CD2 stimulation cocktail) overnight (~12 hours). At the time of Immunocult stimulation, anti-CD107a antibody (clone H4A3, BioLegend) and Brefeldin A (BioLegend) were added to the culture at a 1:200 concentration and 0.5X concentration, respectively. After overnight stimulation (~12 hours), cells were washed, stained for surface antigens, and then stained for intracellular antigens using the BD Cytofix/Cytoperm Fixation/Permeabilization Kit according to the manufacturer’s instructions (BD Bioscience). For proliferation assays, cells were stained with 5 μM CellTrace Violet before pelleting and resuspension in their respective culture medium for five days with Immunocult stimulation. Samples were acquired on BD FACS Symphony or LSRII flow cytometers. Data were analysed using FlowJo v10.6.1 (Treestar Inc.). Data were plotted and analysed using GraphPad Prism 10.0.0. Fluorescent conjugated antibodies used for flow cytometry are listed in the Nature Portfolio Reporting Summary.
LC-MS based metabolomics
13C2-acetate was purchased from Cambridge Isotopes, Inc. 48 hours prior to sacrifice tumour-bearing mice were supplemented with 2% 13C2-acetate in the drinking water and further administered an intraperitoneal bolus of 13C2-acetate (2g/kg) 90 minutes before collection. Tumour-bearing mice were sacrificed by exsanguination under anesthesia and tumours were immediately excised and flash frozen in liquid nitrogen. Frozen tumours were weighed and then pulverized with a ceramic bead at liquid nitrogen temperatures using a cryomill (Retsch). Tissue metabolites were extracted at 40 mg/mL in extraction solution consisting of LC-MS grade methanol:water (4:1) for 10 minutes at 4°C on a rocker. The metabolite extract was cleared twice by centrifugation. Supernatants were transferred to LC-MS silanized glass vials with PTFE caps and stored at −80°C until LC-MS analysis.
For ex vivo stable isotope tracing into CD8+ T-cells, NK-cells, and macrophages (unstimulated, M1 and M2), cells were seeded in the presence of 0.1 mM or 0.5 mM 13C2-acetate for up to three hours. In some conditions, CD8+ T-cells were also incubated with 1 μM VY-3-135. Cells were then pelleted and washed with ice-cold PBS prior to extraction of polar metabolites as described above.
LC-MS analysis was performed on a Q Exactive HF-X mass spectrometer (ThermoFisher Scientific) equipped with a HESI II probe and coupled to a Vanquish Horizon UHPLC system (ThermoFisher Scientific) or a Sciex QTrap 5500 LC-MS/MS system as previously described 11, 77. Hydrophilic interaction liquid chromatography (HILIC) was performed at 0.2 ml/min on a ZIC-pHILIC column (150 × 2.1 mm, 5 μM particle size, EMD Millipore) with a ZIC-pHILIC guard column (20 × 2.1 mm, EMD Millipore) at 30 °C. Solvent A was 20 mM ammonium carbonate, 0.1% ammonium hydroxide, pH 9.2, 5 μM medronic acid, and solvent B was acetonitrile. The gradient was 85% B for 2 min, 85% B to 20% B over 15 min, 20% B to 85% B over 0.1 min, and 85% B for 8.9 min. The autosampler was held at 4 °C. For each analysis, 2 μl of sample was injected. The following parameters were used for the MS analysis: sheath gas flow rate, 30; auxiliary gas flow rate, 5; sweep gas flow rate, 0; auxiliary gas heater temperature, 200 °C; spray voltage, 3.6 kV for positive and negative modes; capillary temperature, 325 °C; and funnel RF level, 65. Samples were analysed by full MS with polarity switching. Full MS scans were acquired at 60,000 resolution with 2 microscans and a scan range of 72–1080 m/z, automatic gain control (AGC) target of 5e6, and maximum injection time (IT) of 200 ms. Peak analysis was performed using an annotated compound library and TraceFinder 4.1 software or MultiQuant 3.0.3 software for LC-MS data processing 78. Data were plotted using GraphPad Prism 10.0.0. Samples were not deisotoped for natural abundance of carbon-13.
Bulk RNA-Seq
Bulk tumour tissue was pulverized as indicated above and RNA was extracted using Trizol and purified using a RNeasy Plus kit (Qiagen). Quantity was determined using the Qubit 2.0 Fluorometer (ThermoFisher Scientific, Waltham, MA) and quality was validated using TapeStation RNA ScreenTape or Agilent Bioanalyser Total RNA Nano chip (Agilent, Santa Clara, CA). 200 ng of total RNA was used to prepare library for Illumina Sequencing using the Quant-Seq 3’mRNA-Seq Library Preparation Kit (Lexogen, Austria). Library quantity was determined using qPCR (KAPA Biosystem, Wilmington, MA). Library size was determined using Agilent TapeStation or Bioanalyser and DNA High Sensitivity D5000 ScreenTape or High Sensitivity DNA chip (Agilent, Santa Clara, CA). Equimolar amounts of each sample library were pooled, denatured and run using Hi-Output, Single-read, 75bp cycle sequencing kit. Next Generation Sequencing was done on a NextSeq 500 (Illumina, San Diego, CA).
RNA-Seq data was aligned using bowtie279 against mm10 version of mouse genome and RSEM software80 was used to estimate read counts and FPKM values using Ensemble transcriptome information. DESeq281 was used to identify differentially expressed genes between sample groups and genes were considered significant if they passed a FDR<5% threshold, unless stated otherwise. Gene expression heatmaps were generated using DESeq2 normalized counts. Statistically significant differentially expressed genes were subjected to enrichment analysis using Ingenuity Pathway Analysis.
Single cell RNA-sequencing
Tumour-bearing mice were euthanized and tumours were immediately resected and processed using the mouse tumour dissociation kit (Miltenyi #130–096-730) according to manufacturer’s instructions. Briefly, three tumours from each treatment group were minced and processed to single cell suspension in gentleMACS C tubes with the gentleMACs Octo Dissociator with heaters (Miltenyi #130–096-427). Cell suspensions were passed through a 70 μm filter and counted. 1×10⁶ cells per sample were each labeled with a unique Totalseq™ anti-mouse hashtag antibody (BIoLegend, San Diego, CA) as per manufacturer’s instructions. Dead cells were then removed using the Dead Cell Removal Kit (Miltenyi #130–109-398). ~5000 live cells from each sample were then pooled to create one multiplexed single cell suspension; this was loaded onto one lane of a 10x Chromium Next GEM G Chip and partitioned into single cell droplets in a 10x Chromium Controller using the Chromium Next GEM Single Cell Gel Bead Kit. Final libraries were made using both the Chromium Next GEM Single Cell 3’ Library Construction Kit and the 3’ Feature Barcode Library Kit (10x Genomics, Pleasanton, CA) as per manufactures protocol. Sequencing was done on an Illumina Nextseq 500 NGS platform using a 75 cycle High Output kit (Illumina, San Diego, CA) with a 28 bp x 55 bp run configuration yielding a total of 444 million reads.
Cell Ranger Suite (v3.1.0, https://support.10xgenomics.com) was used for preprocessing the scRNAseq data with refdata-cellranger-mm10–3.0.0 transcriptome as a reference to map reads on mouse genome (mm10) using STAR 82. Samples were demultiplexed using HTODemux function in Seurat 83 (v3.2.0) based on hashtag oligos (HTOs). Low quality cells with less than 200 genes with reads and cells with over 10% mitochondrial content were filtered out leaving 3366 cells from vehicle treated tumors and 2715 cells from VY-3-135 treated tumors. Cell clustering, marker identification and visualization was performed using Seurat. R package SingleR 84 was used to determine cell types of the clusters using ImmGen data set as a reference for cell-specific gene signatures. Cell types were also further resolved with the help of known gene markers associated with different immune cell sub-types. Genes differentially expressed between drug and control samples within clusters of interest were identified using non-parametric Wilcoxon rank sum test and statistically significant genes (FDR < 5%) were used for enrichment analysis using QIAGEN’s Ingenuity® Pathway Analysis software (IPA®, QIAGEN Redwood City, www.qiagen.com/ingenuity)
Extended Data
Extended Data Fig. 1 |. Knockout of Acss2 in mouse breast cancer cell lines often leads to tumor clearance.
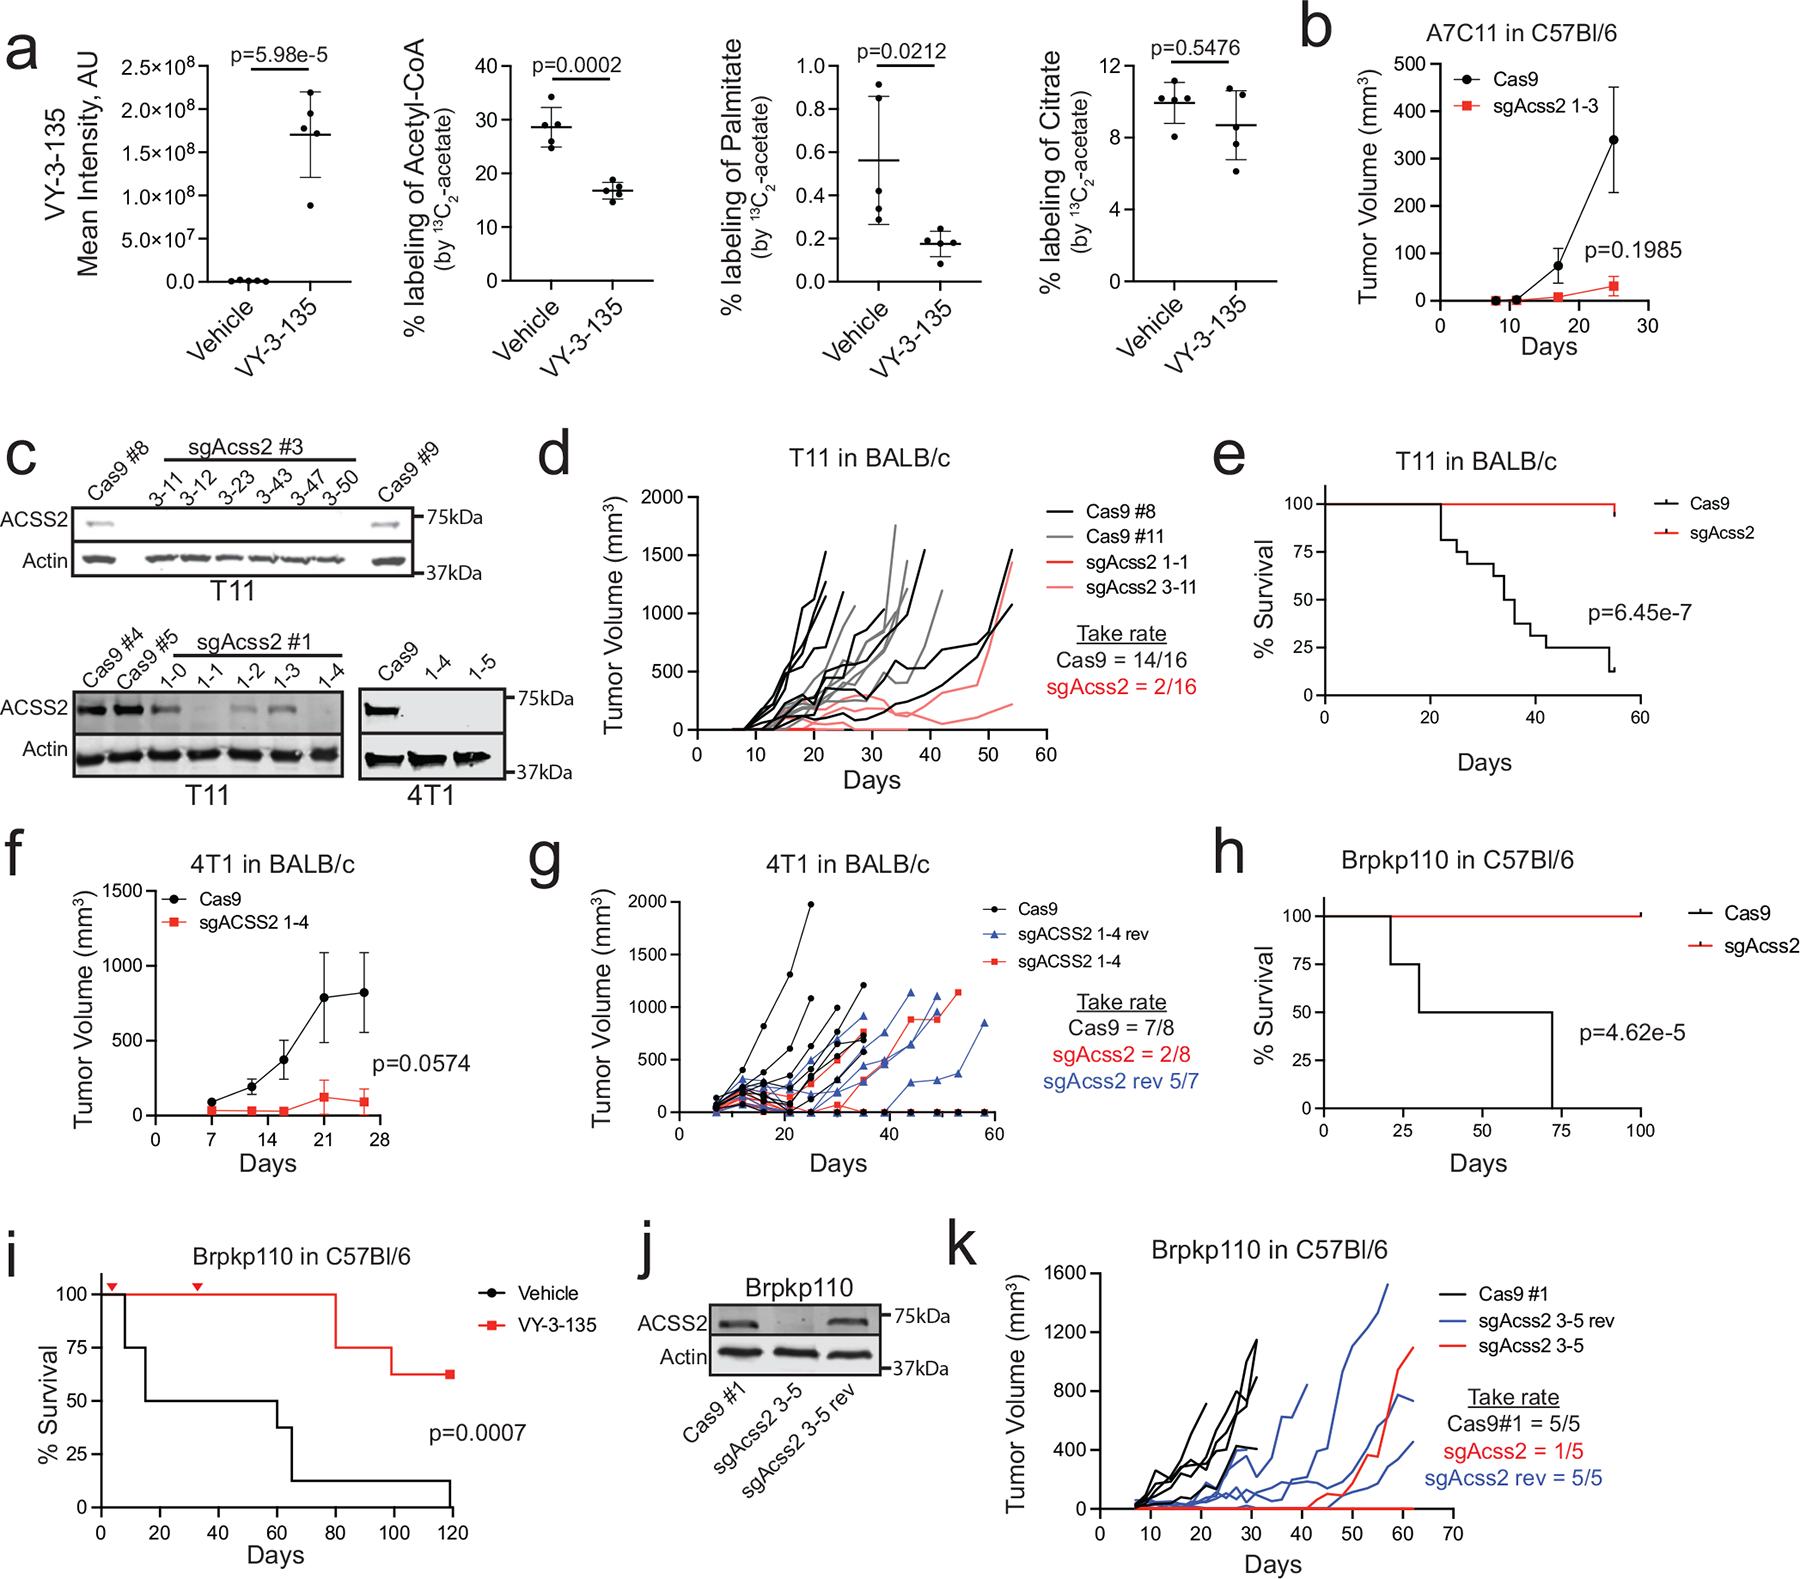
a, LC-MS analysis of 13C2-acetate labeling of metabolites and fatty acids in T12 tumor tissue from vehicle versus VY-3-135 treated BALB/c mice. Lines represent the mean ± standard deviation (SD). P values were generated using two-sided t-test. n = 5 tumours per group. AU = arbitrary units b, Allograft tumour growth of Cas9 (WT) or sgAcss2 (Acss2- KO) A7C11 cells in C57Bl/6 mice. Adjusted p values were generated using two tailed multiple unpaired Welch t-test. Values represent the mean tumour volume ± SEM. n = 5 mice per group. c, Western blots for ACSS2 expression in T11 and 4T1 sgAcss2 cell lines. d, Allograft tumour growth of Cas9 (WT) or sgAcss2 (Acss2-KO) T11 cells in BALB/c mice. n = 8 mice per group. e, Kaplan-Meier survival plot of C57Bl/6 tumour-bearing mice injected with either wild type (Cas9) or Acss2-KO (sgAcss2) T11 cells. P values were generated using a log-rank (Mantel-Cox) test. n = 16 mice per group. f, Allograft tumour growth of Cas9 (WT) or sgAcss2 (Acss2-KO) 4T1 cells in BALB/c mice. Adjusted p values were generated using multiple two-sided Welch t-test. Values represent the mean tumour volume ± SEM. n = 8 mice per group. g, Syngeneic allograft tumour growth of 4T1 sgAcss2 revertant (sgAcss2 rev) tumours in BALB/c mice. n = 7 to 8 mice per group as indicated on plot. Take rates indicate the number of mice with tumours in each group at the end of the study. h, i, Kaplan-Meier survival plot of C57Bl/6 tumour-bearing mice injected with either wild type (Cas9) or Acss2-KO (sgAcss2) Brpkp110 cells or with wild type (Cas9) Brpkp110 cells that were treated daily from day 4 to day 31 (marked red triangles) with VY-3 135. P values were generated using a log-rank (Mantel-Cox) test. n = 8 mice per group. j, Western blot for ACSS2 expression in Brpkp110 wild type (Cas9 #1), sgAcss2 and sgAcss2 rev. k, Syngeneic allograft tumour growth of Brpkp110 cells from panel j in C57Bl/6 mice. n = 5 mice per group. Western blotting results were independently validated twice.
Extended Data Fig. 2 |. Clearance of Acss2-KO tumours depends on the presence of functional T cells.
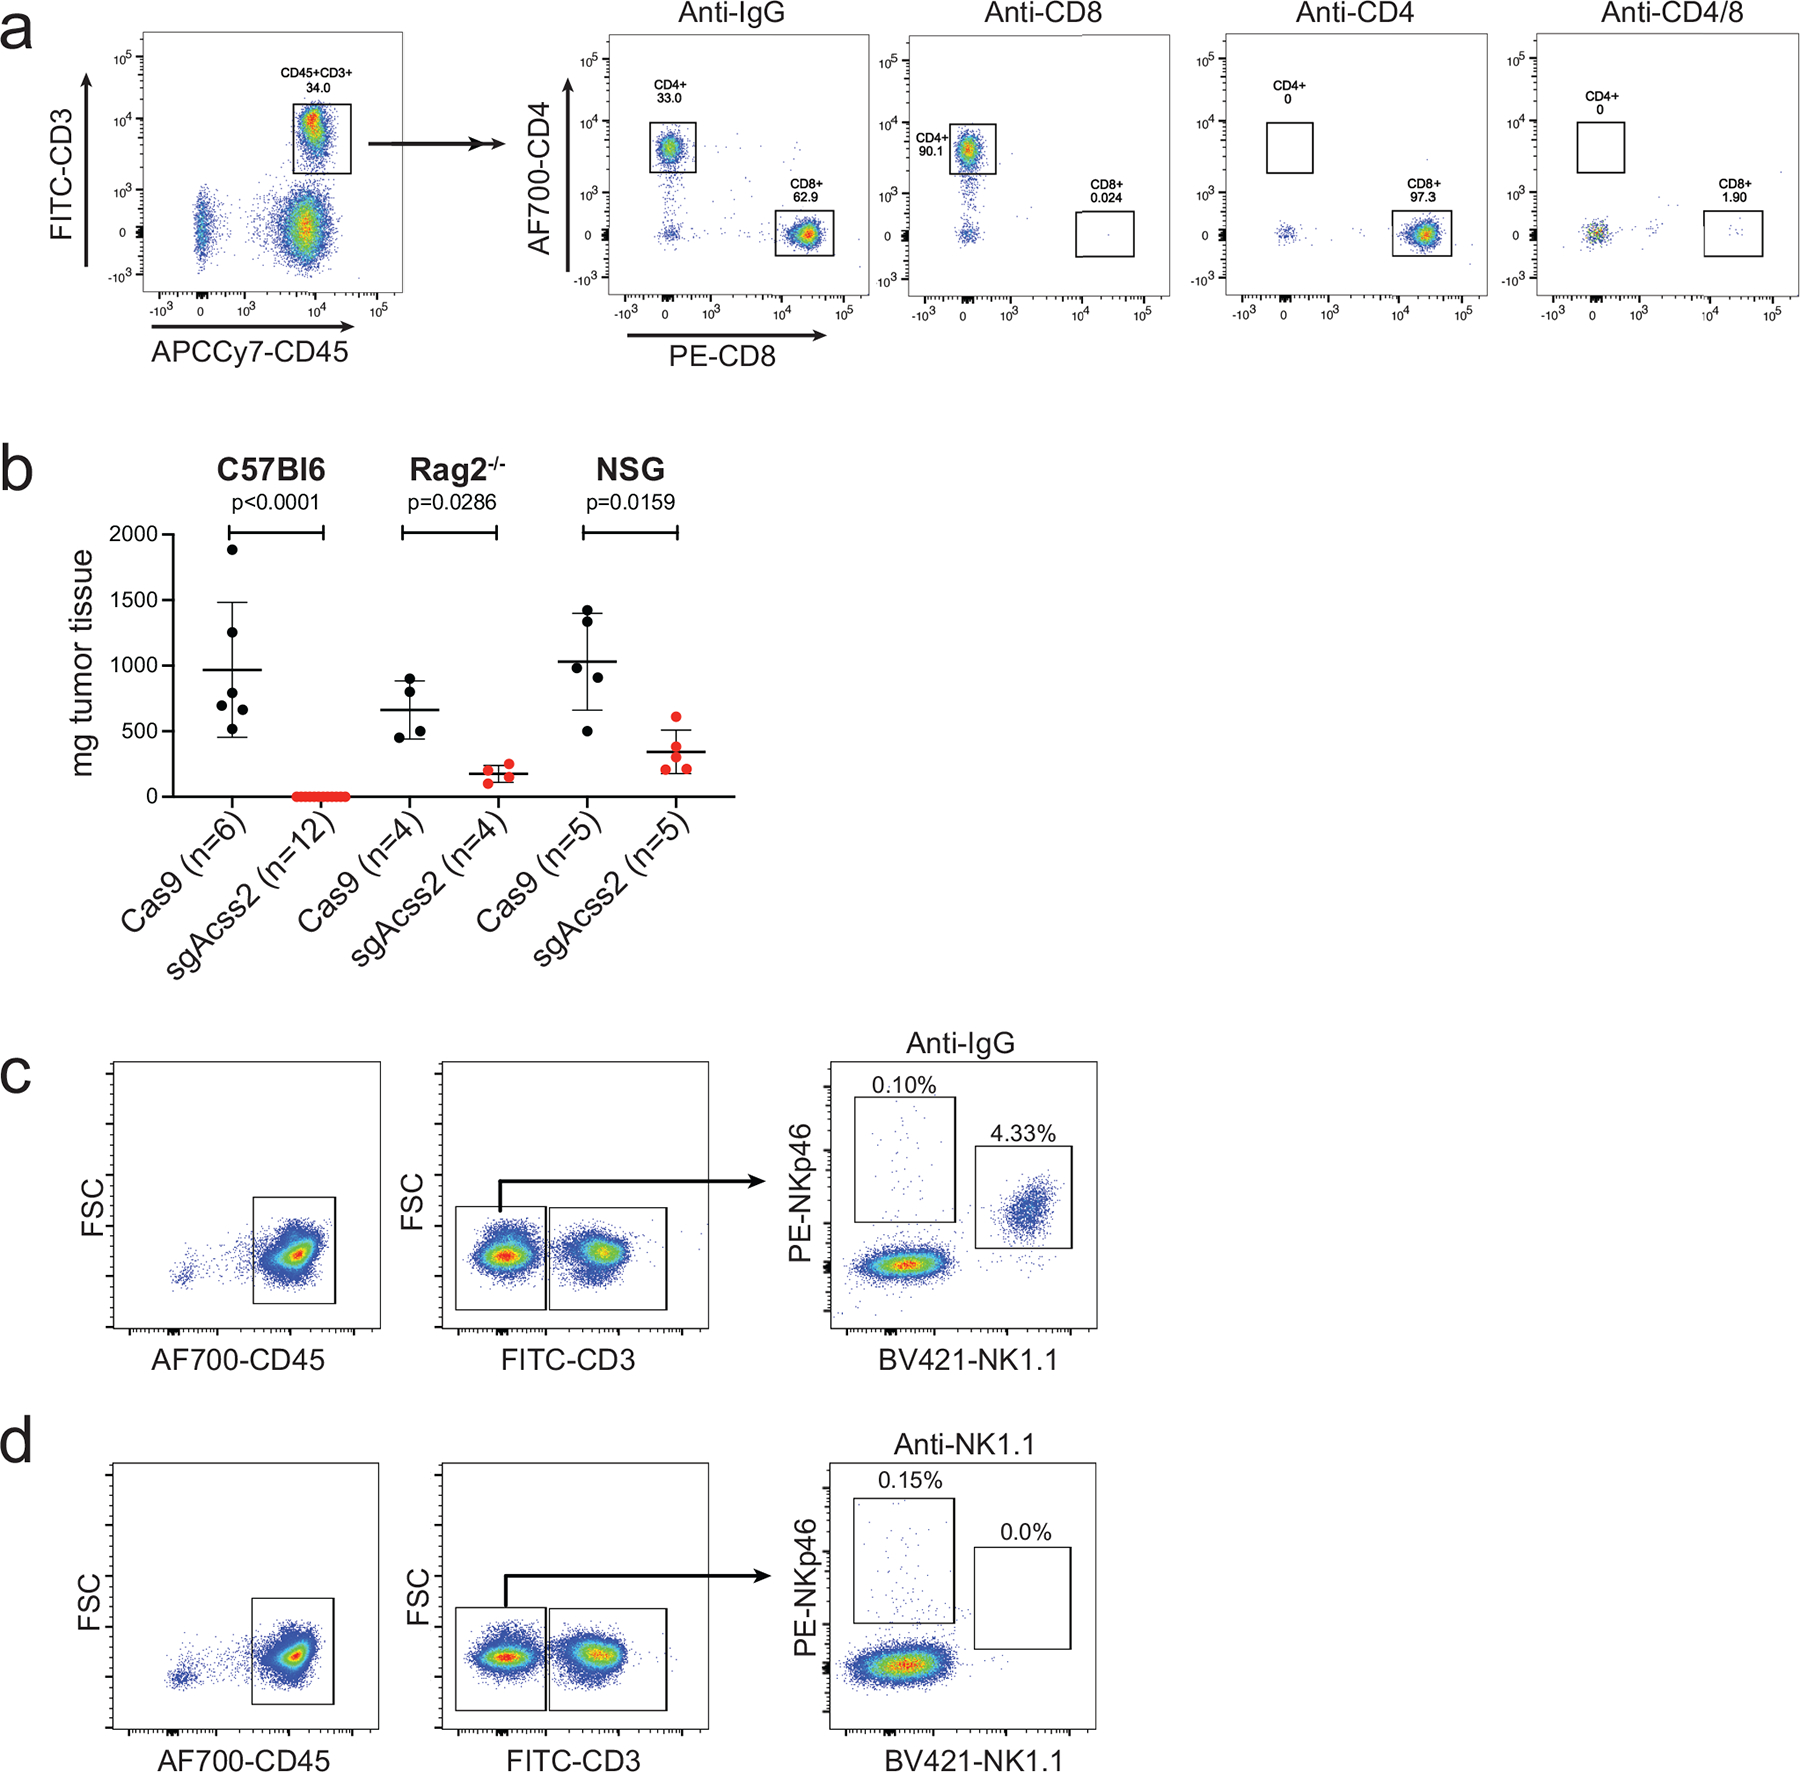
a, Representative flow plots of peripheral blood mononuclear cells collected from mice depleted of CD4+, CD8+, or CD4+ and CD8+ T cells. b, Final tumour weights of WT or Acss2-KO Brpkp110 tumours grown in C57Bl/6, C57Bl/6 Rag2−/−, or NSG mice. Values represent the mean tumour volume ± SD. P values generated using two-tailed Mann–Whitney U test. c, d, Representative flow plots of peripheral blood mononuclear cells collected from mice treated with IgG control (c) or an NK-cell depleting antibody against NK1.1 (d).
Extended Data Fig. 3 |. ACSS2 inhibitor-treated tumours have gene signatures associated with increased immune surveillance and activation.
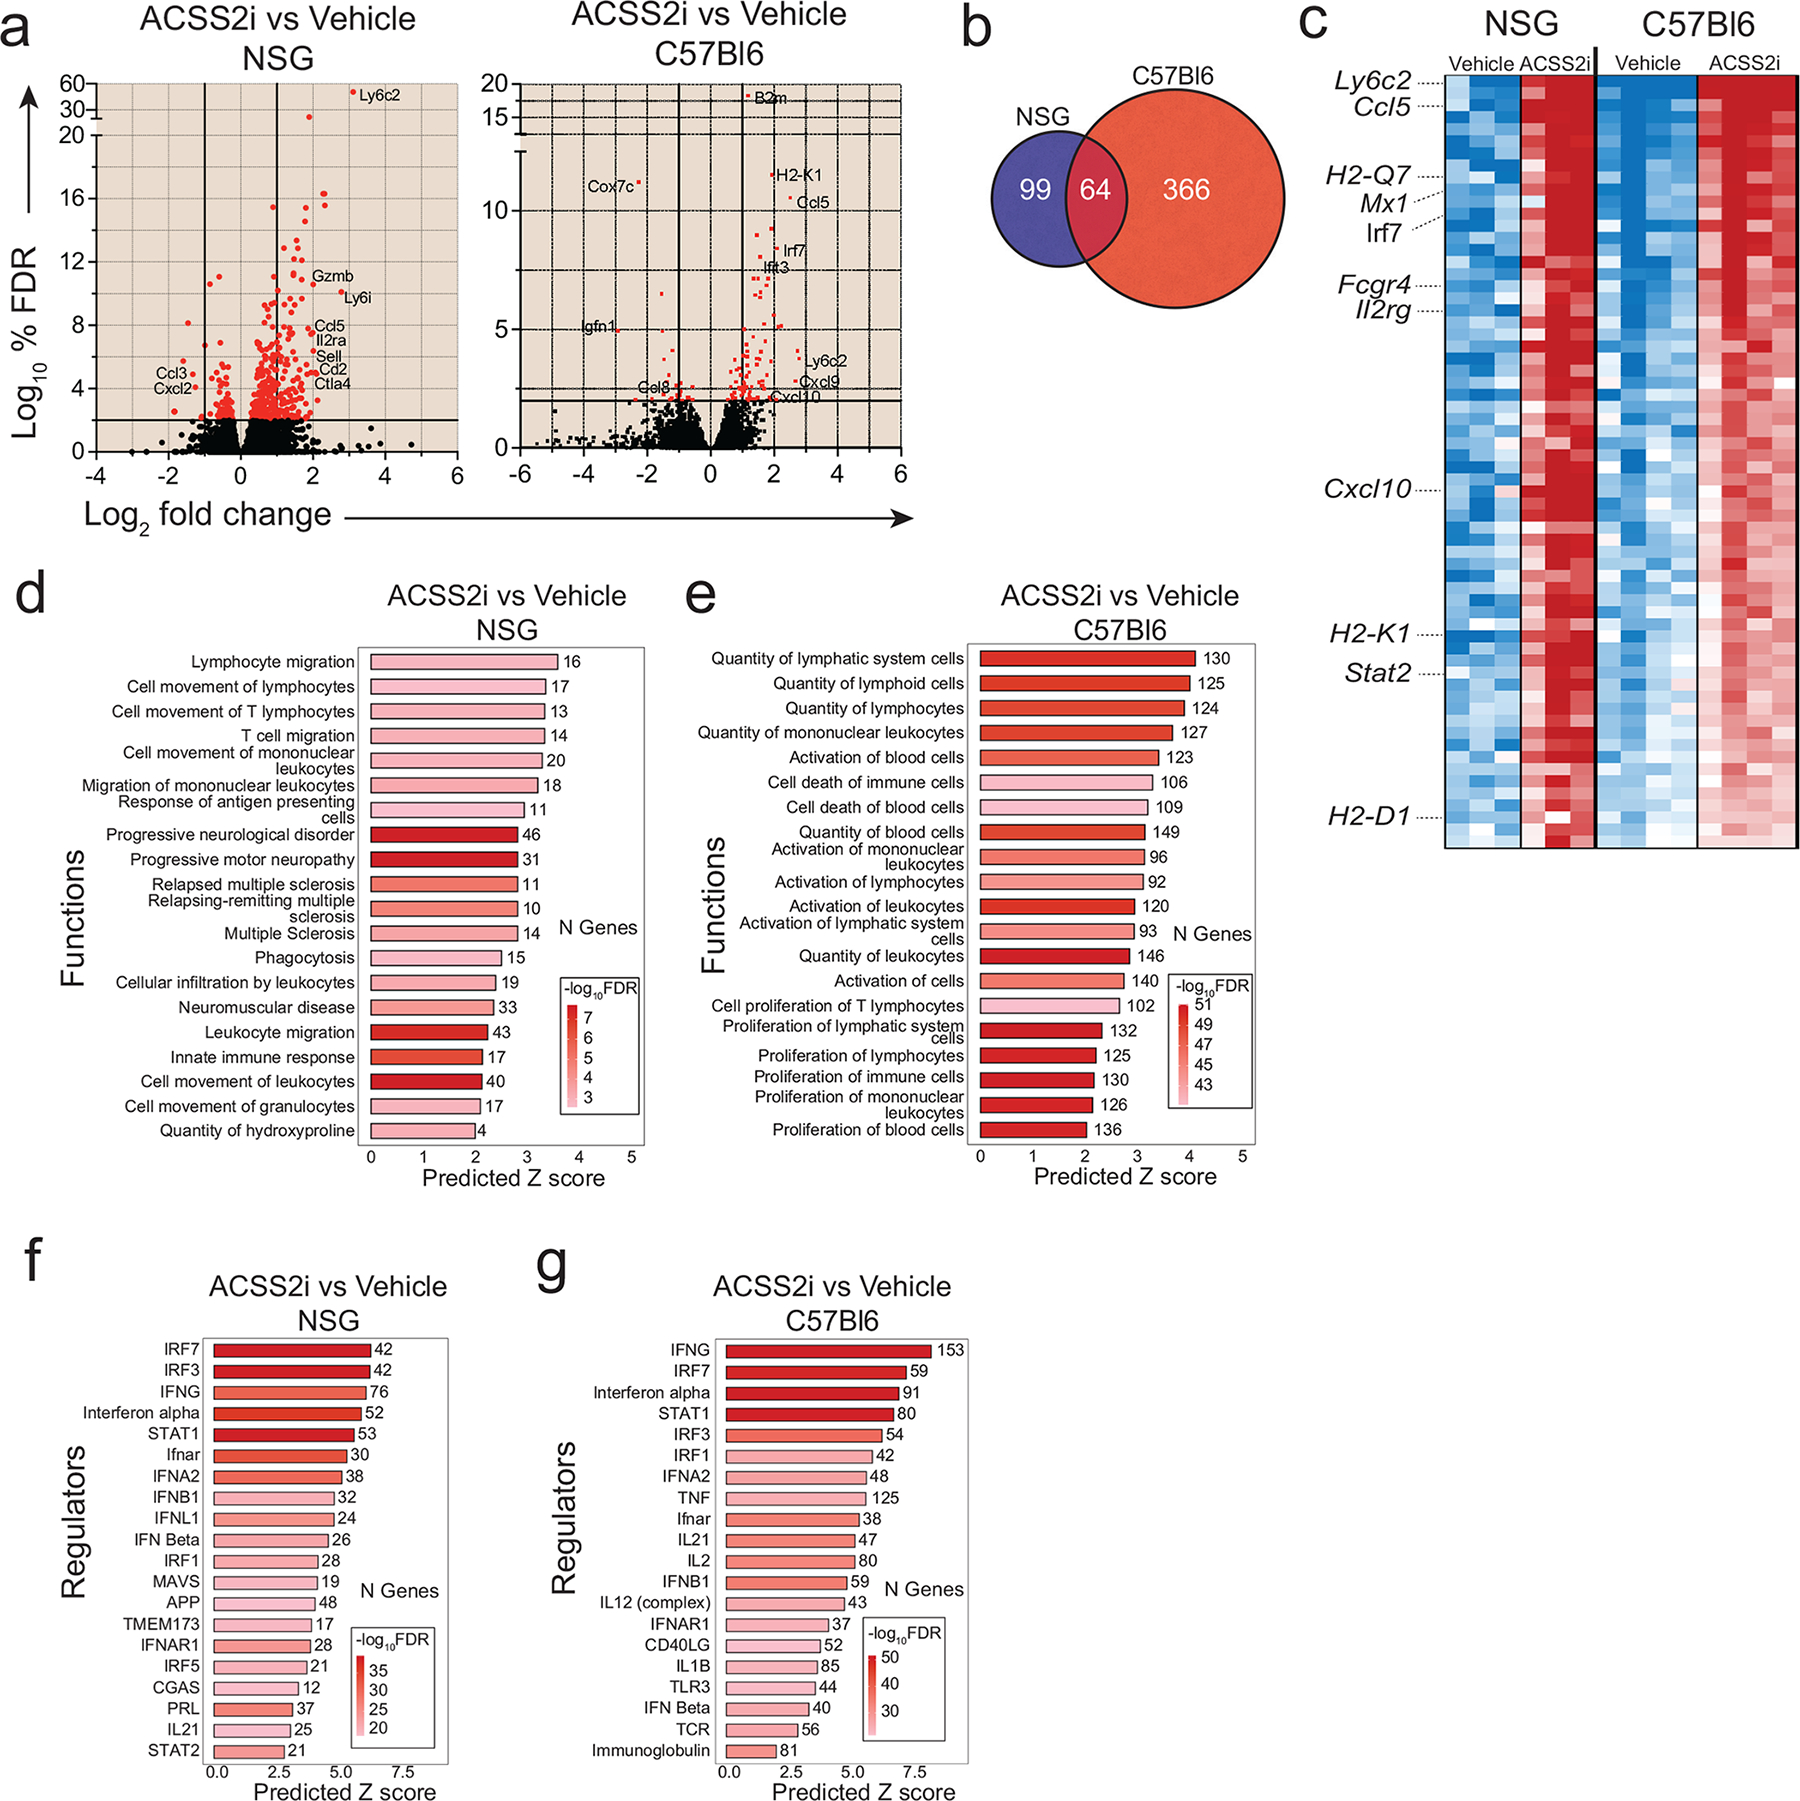
a, Volcano plots showing differentially expressed genes (DEGs) in tumours from NSG or C57Bl/6 mice treated with VY-3-135. NSG tumour-bearing mice were treated for 15 days. C57Bl/6 mice were treated for 5 days. b, Venn diagram illustrating the overlap of genes differentially regulated by VY-3-135 treatment in tumours grown in NSG versus C57Bl/6 mice. c, Heat map of 64 genes in common from the data in panel a. d, e, GSEA of the top 20 most significantly activated functions in tumours after VY-3-135 treatment in NSG and C57Bl/6 mice. Heat-mapping represents -log10 FDR values. The number of genes within that function that were altered is displayed. The x-axis shows the predicted Z score based on the gene expression differences. f, g, IPA analysis of the top 20 significant regulators enriched by VY-3-135 treatment in NSG or C57Bl/6 mice. Heat-mapping on bar plots represents -log10 FDR values. The number next to the bar displays the number (N) of genes within that regulator or function gene set that were altered. The x-axis is the predicted Z score based on the gene expression differences.
Extended Data Fig. 4 |. Single cell RNA sequencing identifies enhanced activation of tumour infiltrating myeloid cells after ACSS2 inhibition.
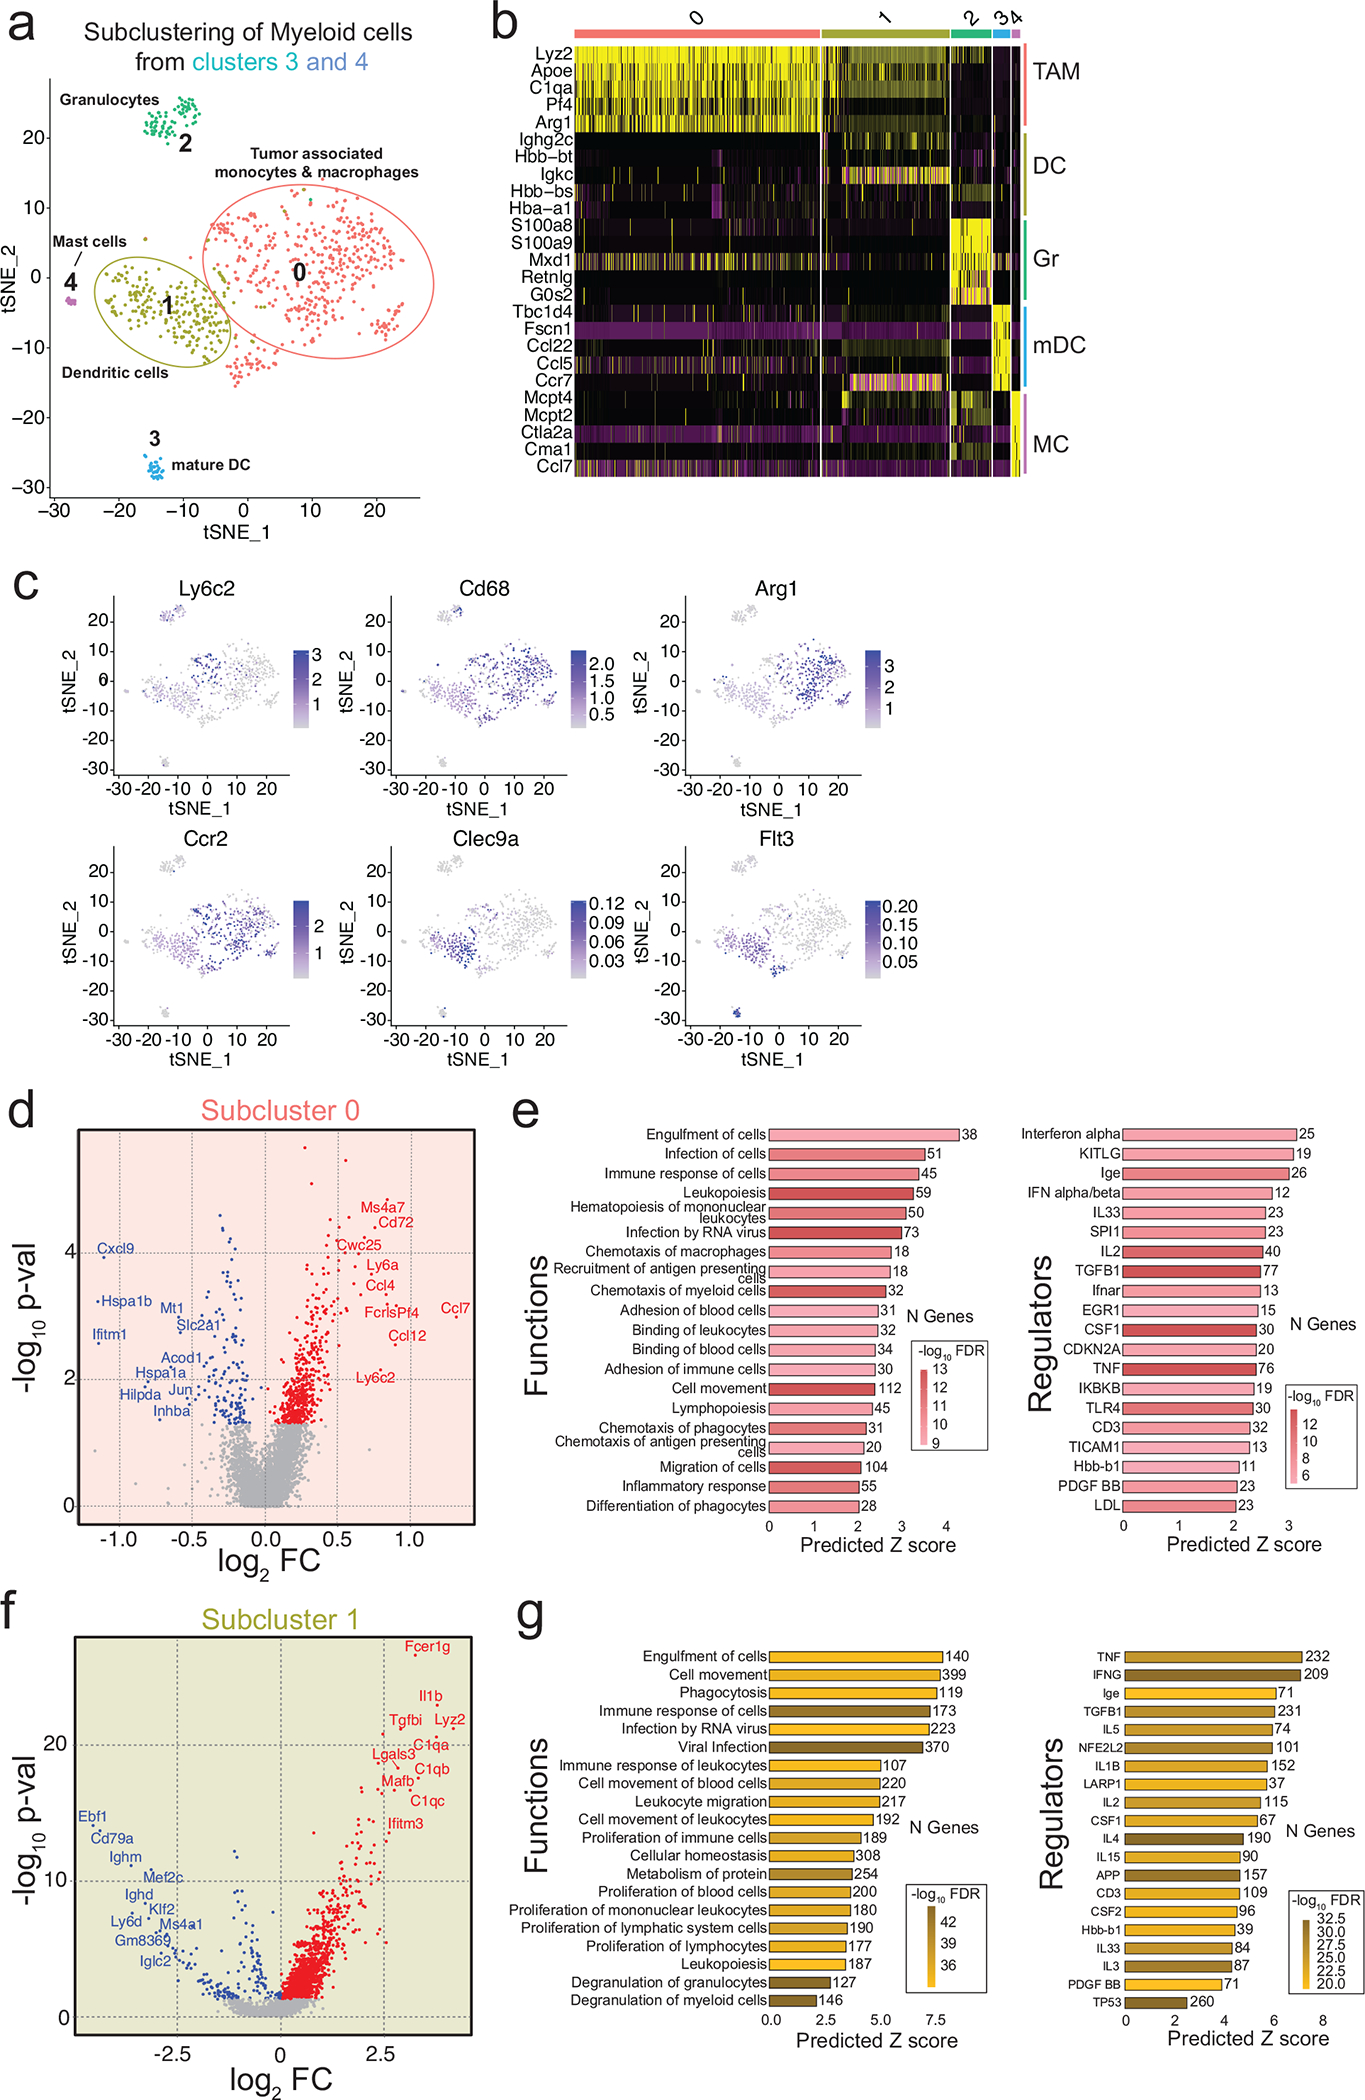
a, Seurat plot of cell populations following subclustering of myeloid cells from clusters 3 and 4 from Fig. 5a. b, Heat map illustrating gene expression of the top five most highly expressed gene markers within each subcluster. c, Heatmapping of gene marker expression onto the myeloid cell subclusters. d, Volcano plot illustrating DEGs in VY-3-135 treated tumours of subcluster 0. P values were generated with a nonparametric Wilcoxon rank-sum test. e, GSEA of the top 20 functions and regulators in subcluster 0 that were significantly activated in VY-3-135 treated tumours. f, Volcano plot illustrating DEGs in subcluster 1 in VY-3-135 treated tumours. P values were generated with a nonparametric Wilcoxon rank-sum test. g, GSEA of the top 20 functions and regulators in subcluster 1 that were significantly activated in VY-3-135 treated tumours. Heat-mapping on bar plots represents -log10 FDR values. The number next to the bar displays the number (N) of genes within that regulator or function gene set that were altered. The x-axis is the predicted Z score based on the gene expression differences.
Extended Data Fig. 5 |. Gene markers used to identify the cell types within the subclusters of T cells and NK cells.
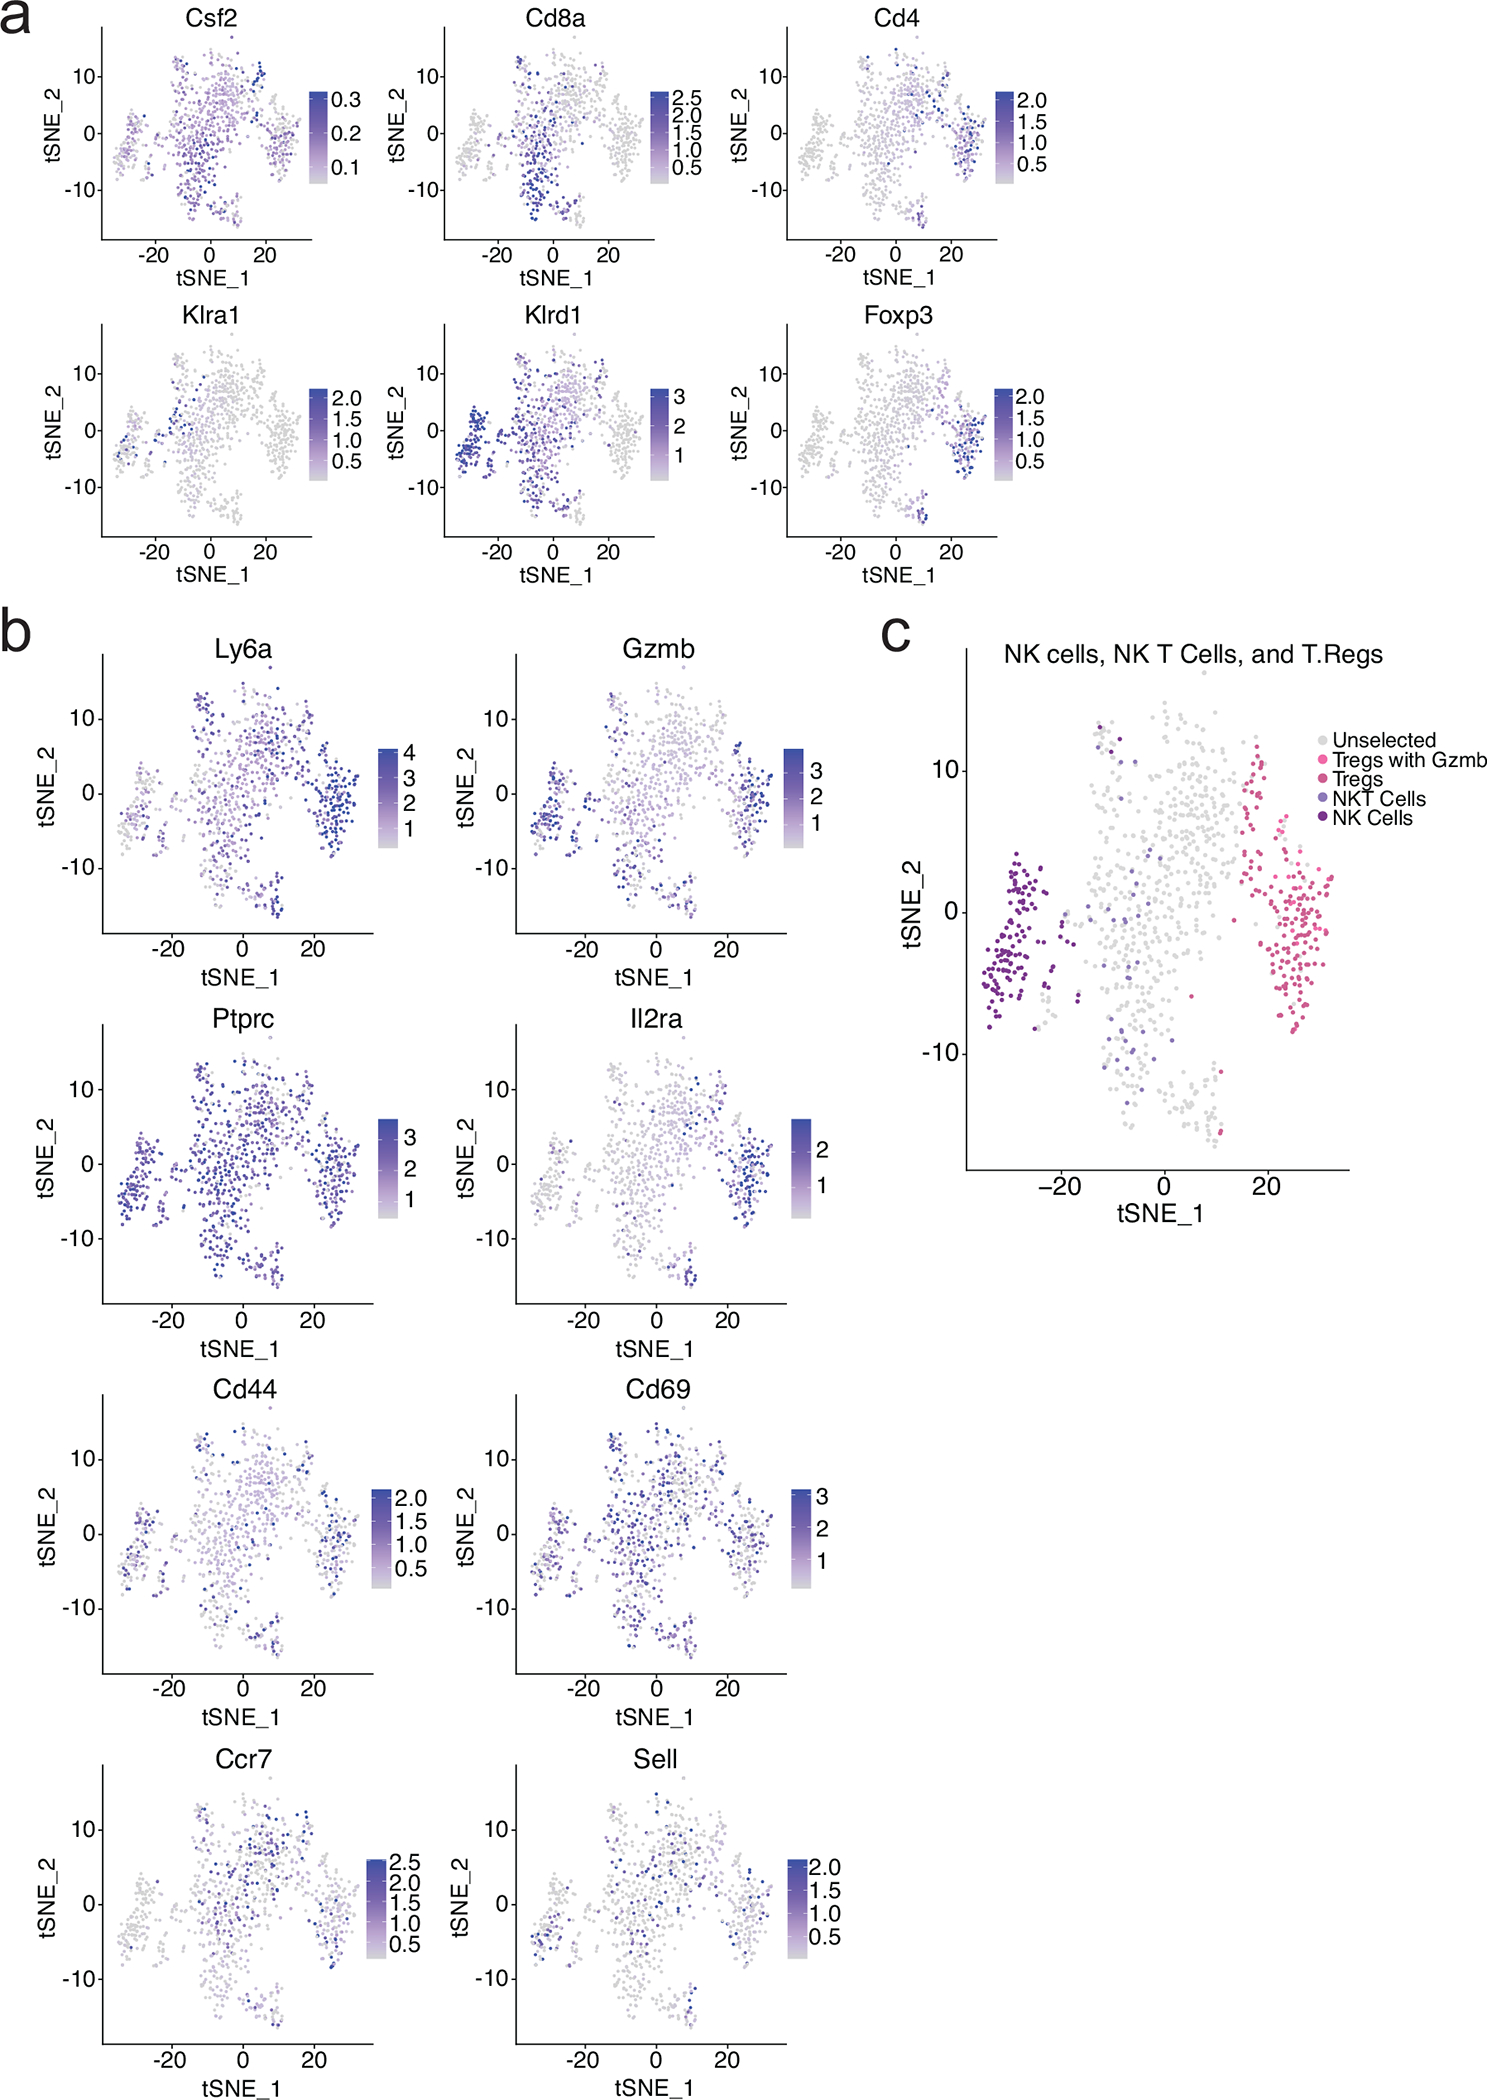
a, b, Heat-mapping of the relative expression of canonical genes used to distinguish T cells and NK cells within all five lymphocyte subclusters from Fig. 5d. c, Predicted distribution of NK, NKT, and Treg cells within the subclusters.
Extended Data Fig. 6 |. Lymphocytes express relatively high amounts of ACSS1 and oxidize acetate better than macrophages.
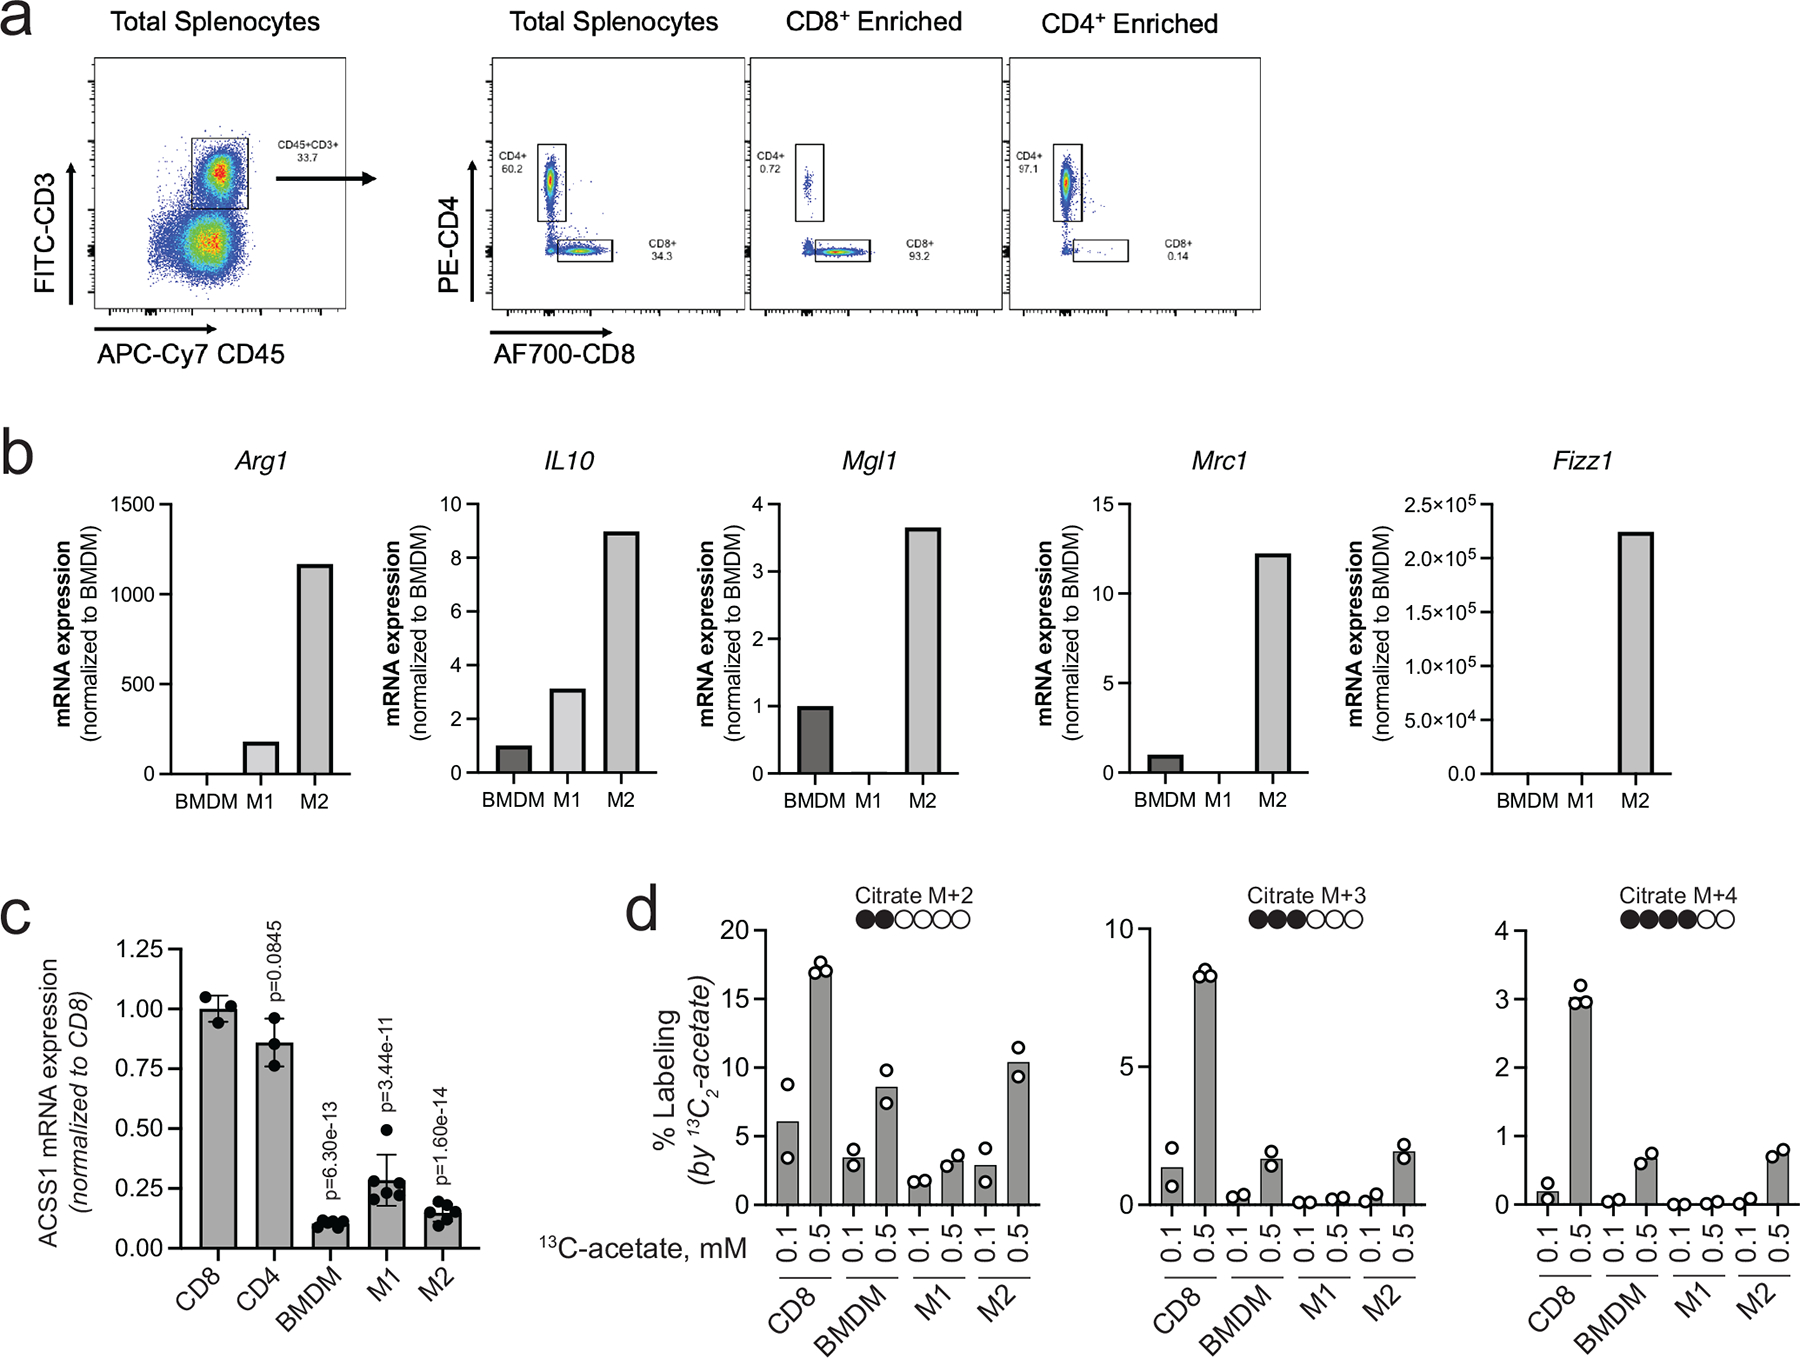
a, Representative dot plots displaying enrichment for CD8+ and CD4+ T cells from total splenocytes collected from mice. b, mRNA expression for macrophage markers of polarization. Data are presented as relative expression normalized to BMDM. n = 1 quantitation of mRNA expression. c, ACSS1 mRNA expression in T cells and macrophages. Data are presented as a mean ± SD. P values generated using two-way ANOVA Dunnett’s multiple comparisons test against CD8+ T cells. n.s. = not significant. n = 3 independent samples for T cells and n = 6 independent samples for macrophages. d, Stable isotope tracing of 0.1 versus 0.5 mM 13C2 acetate into T cells and macrophages for 1 h and LC-MS based analysis of citrate labeling. M + 2, M + 3, and M + 4 plots show the percent labeling of citrate by 13C2-acetate for each isotopologue. n = 2 independent cultures of CD8+ T cells and macrophages.
Extended Data Fig. 7 |. Acetate increases expression of cytokines and activation markers in T cells cultured in low glucose.
a, ACSS1, ACSS2 and ACSS3 expression in lymphocytes and monocytes from one male and one female healthy human donor. b, ACSS1 mRNA expression represented as normalized transcripts per kilobase million (nTPM) from a scRNA-seq analysis of normal human breast tissue. Where n ≥ 3 data are presented as a mean ± SEM. c, ACSS1 mRNA expression from a scRNA-seq analysis of human breast tumors. Violin plots with hashed lines representing median and dotted lines mark upper and lower quartiles. P values generated using log-rank test. d, Expression of degranulation and activation markers in human CD8+ T cells after stimulation in the presence of increasing concentrations of acetate and two different concentrations of glucose. Dotted lines represent expression levels in standard culture medium. n = 2 independent CD8+ T cell cultures. Data are presented as a percent of total CD8+ T cells. e, Glucose and acetate consumption by human CD8+ T cells during polyfunctional assay. Data are expressed as change in concentration during overnight stimulation. n.d. = not detected. n = 2 independent CD8+ T-cell cultures. Western blotting results were independently validated at least twice.
Supplementary Material
Acknowledgements
We would like to thank Hsin-Yao Tang, Nicole Gorman, Aaron Goldman, and Thomas Beer of the Wistar Institute Proteomic and Metabolomic core. We also would like to acknowledge the staff of the Wistar Institute Genomics Core, Wistar Flow Cytometry Core, and Wistar Animal Facility. The authors thank Emily Cento, Zhilin Chen, Max A. Eldabbas, and Emileigh Maddox of the Human Immunology Core (HIC) and the Division of Transfusion Medicine and Therapeutic Pathology at the Perelman School of Medicine at the University of Pennsylvania for providing de-identified, T-cells, B-cells, monocytes, and NK-cells that were purified from healthy donor apheresis using StemCell RosetteSep™ kits. HIC RRID: SCR_022380
Financial Support:
This work was supported by grants from NIH NCI DP2 CA249950-01 (Z.T.S), NIH NCI P01 CA114046 (Z.T.S.), NIH R21 CA259240-01 (R.S.S.), the W.W. Smith Charitable Trust (Z.T.S.), Susan G. Komen® CCR19608782 (Z.T.S.), the V Foundation for Cancer Research (Z.T.S.). This research and project is funded, in part, by a contract with the Pennsylvania Breast Cancer Coalition (Z.T.S). The PBCC takes no part in and is in no way responsible for any analyses, interpretations, or conclusions contained herein. NIH NCI T32 CA009171 (K.D.M. and S.H.), and the American Cancer Society Rena and Victor Damone Postdoctoral Fellowship PF-20-1225-01-CCG (K.D.M.). The Wistar Molecular Screening Facility and Genomics Facility are supported by NIH grant P30 CA010815. The Wistar Proteomic and Metabolomic Facility is supported in part by NIH grants R50 CA221838 and S10 OD023586. The HIC is supported in part by NIH P30 AI045008 and P30 CA016520.
Footnotes
Competing Interests
J.M.S. and Z.T.S. are scientific co-founders and consultants for Syndeavor Therapeutics. The remaining authors declare no competing interests.
Data Availability
RNA-seq data that support the findings of this study have been deposited in the Gene Expression Omnibus (GEO) under accession code GSE202281. Metabolomic data is available at the NIH Common Fund’s National Metabolomics Data Repository (NMDR) website, the Metabolomics Workbench, https://www.metabolomicsworkbench.org where it has been assigned Study ID ST002740. The data can be accessed directly via its Project DOI: http://dx.doi.org/10.21228/M89T4G. This work is supported by NIH grant U2C-DK119886. Source data for all figures and extended data have been provided as Source Data files. Previoulsy published human breast tissue scRNAseq that was re-analysed here for expression of ACSS1 and ACSS2 mRNA is available under accession code GSE164898 40, 41. Previously published human primary breast tumor scRNAseq that was re-analysed here for expression for ACSS1 mRNA is available from GSE176078 36.
Main References:
- 1.Bianchini G, Balko JM, Mayer IA, Sanders ME & Gianni L Triple-negative breast cancer: challenges and opportunities of a heterogeneous disease. Nat Rev Clin Oncol 13, 674–690 (2016). [DOI] [PMC free article] [PubMed] [Google Scholar]
- 2.Atezolizumab Combo Approved for PD-L1-positive TNBC. Cancer Discov 9, OF2 (2019). [DOI] [PubMed] [Google Scholar]
- 3.Emens LA et al. First-line atezolizumab plus nab-paclitaxel for unresectable, locally advanced, or metastatic triple-negative breast cancer: IMpassion130 final overall survival analysis. Ann Oncol 32, 983–993 (2021). [DOI] [PubMed] [Google Scholar]
- 4.Nanda R et al. Pembrolizumab in Patients With Advanced Triple-Negative Breast Cancer: Phase Ib KEYNOTE-012 Study. J Clin Oncol 34, 2460–2467 (2016). [DOI] [PMC free article] [PubMed] [Google Scholar]
- 5.Adams S et al. Pembrolizumab monotherapy for previously treated metastatic triple-negative breast cancer: cohort A of the phase II KEYNOTE-086 study. Ann Oncol 30, 397–404 (2019). [DOI] [PubMed] [Google Scholar]
- 6.Loi S et al. Relationship between tumor infiltrating lymphocyte (TIL) levels and response to pembrolizumab (pembro) in metastatic triple-negative breast cancer (mTNBC): Results from KEYNOTE-086. Annals of Oncology 28, v608 (2017). [Google Scholar]
- 7.Winer EP et al. Pembrolizumab versus investigator-choice chemotherapy for metastatic triple-negative breast cancer (KEYNOTE-119): a randomised, open-label, phase 3 trial. Lancet Oncol 22, 499–511 (2021). [DOI] [PubMed] [Google Scholar]
- 8.Dirix LY et al. Avelumab, an anti-PD-L1 antibody, in patients with locally advanced or metastatic breast cancer: a phase 1b JAVELIN Solid Tumor study. Breast Cancer Res Treat 167, 671–686 (2018). [DOI] [PMC free article] [PubMed] [Google Scholar]
- 9.Fujino T, Kondo J, Ishikawa M, Morikawa K & Yamamoto TT Acetyl-CoA synthetase 2, a mitochondrial matrix enzyme involved in the oxidation of acetate. J Biol Chem 276, 11420–11426 (2001). [DOI] [PubMed] [Google Scholar]
- 10.Yoshimura Y, Araki A, Maruta H, Takahashi Y & Yamashita H Molecular cloning of rat acss3 and characterization of mammalian propionyl-CoA synthetase in the liver mitochondrial matrix. J Biochem 161, 279–289 (2017). [DOI] [PubMed] [Google Scholar]
- 11.Miller KD et al. Targeting ACSS2 with a transition state mimetic inhibits triple-negative breast cancer growth. Cancer Res (2021). [DOI] [PMC free article] [PubMed] [Google Scholar]
- 12.Luong A, Hannah VC, Brown MS & Goldstein JL Molecular characterization of human acetyl-CoA synthetase, an enzyme regulated by sterol regulatory element-binding proteins. J Biol Chem 275, 26458–26466 (2000). [DOI] [PubMed] [Google Scholar]
- 13.Schug ZT, Vande Voorde J & Gottlieb E The metabolic fate of acetate in cancer. Nat Rev Cancer 16, 708–717 (2016). [DOI] [PMC free article] [PubMed] [Google Scholar]
- 14.Bulusu V et al. Acetate Recapturing by Nuclear Acetyl-CoA Synthetase 2 Prevents Loss of Histone Acetylation during Oxygen and Serum Limitation. Cell Rep 18, 647–658 (2017). [DOI] [PMC free article] [PubMed] [Google Scholar]
- 15.Schug ZT et al. Acetyl-CoA synthetase 2 promotes acetate utilization and maintains cancer cell growth under metabolic stress. Cancer Cell 27, 57–71 (2015). [DOI] [PMC free article] [PubMed] [Google Scholar]
- 16.Kamphorst JJ, Chung MK, Fan J & Rabinowitz JD Quantitative analysis of acetyl-CoA production in hypoxic cancer cells reveals substantial contribution from acetate. Cancer Metab 2, 23 (2014). [DOI] [PMC free article] [PubMed] [Google Scholar]
- 17.Comerford SA et al. Acetate dependence of tumors. Cell 159, 1591–1602 (2014). [DOI] [PMC free article] [PubMed] [Google Scholar]
- 18.Chen R et al. The acetate/ACSS2 switch regulates HIF-2 stress signaling in the tumor cell microenvironment. PloS one 10, e0116515 (2015). [DOI] [PMC free article] [PubMed] [Google Scholar]
- 19.Chen R, Xu M, Nagati J & Garcia JA Coordinate regulation of stress signaling and epigenetic events by Acss2 and HIF-2 in cancer cells. PloS one 12, e0190241 (2017). [DOI] [PMC free article] [PubMed] [Google Scholar]
- 20.Gao X et al. Acetate functions as an epigenetic metabolite to promote lipid synthesis under hypoxia. Nat Commun 7, 11960 (2016). [DOI] [PMC free article] [PubMed] [Google Scholar]
- 21.Li X et al. Nucleus-Translocated ACSS2 Promotes Gene Transcription for Lysosomal Biogenesis and Autophagy. Mol Cell 66, 684–697 e689 (2017). [DOI] [PMC free article] [PubMed] [Google Scholar]
- 22.Li Z et al. Acetyl-CoA Synthetase 2: A Critical Linkage in Obesity-Induced Tumorigenesis in Myeloma. Cell Metab 33, 78–93 e77 (2021). [DOI] [PMC free article] [PubMed] [Google Scholar]
- 23.Lakhter AJ et al. Glucose-independent Acetate Metabolism Promotes Melanoma Cell Survival and Tumor Growth. J Biol Chem 291, 21869–21879 (2016). [DOI] [PMC free article] [PubMed] [Google Scholar]
- 24.Oyama N et al. 11C-Acetate PET imaging for renal cell carcinoma. Eur J Nucl Med Mol Imaging 36, 422–427 (2009). [DOI] [PubMed] [Google Scholar]
- 25.Ho CL et al. 11C-acetate PET/CT for metabolic characterization of multiple myeloma: a comparative study with 18F-FDG PET/CT. J Nucl Med 55, 749–752 (2014). [DOI] [PubMed] [Google Scholar]
- 26.Delbeke D & Pinson CW 11C-acetate: a new tracer for the evaluation of hepatocellular carcinoma. J Nucl Med 44, 222–223 (2003). [PubMed] [Google Scholar]
- 27.Calhoun S, Duan L & Maki CG Acetyl-CoA synthetases ACSS1 and ACSS2 are 4-hydroxytamoxifen responsive factors that promote survival in tamoxifen treated and estrogen deprived cells. Transl Oncol 19, 101386 (2022). [DOI] [PMC free article] [PubMed] [Google Scholar]
- 28.Triplett TA et al. Reversal of indoleamine 2,3-dioxygenase-mediated cancer immune suppression by systemic kynurenine depletion with a therapeutic enzyme. Nat Biotechnol 36, 758–764 (2018). [DOI] [PMC free article] [PubMed] [Google Scholar]
- 29.Leone RD et al. Glutamine blockade induces divergent metabolic programs to overcome tumor immune evasion. Science 366, 1013–1021 (2019). [DOI] [PMC free article] [PubMed] [Google Scholar]
- 30.Scharping NE et al. Mitochondrial stress induced by continuous stimulation under hypoxia rapidly drives T cell exhaustion. Nat Immunol 22, 205–215 (2021). [DOI] [PMC free article] [PubMed] [Google Scholar]
- 31.Zhang YX et al. Nanoenabled Modulation of Acidic Tumor Microenvironment Reverses Anergy of Infiltrating T Cells and Potentiates Anti-PD-1 Therapy. Nano Lett 19, 2774–2783 (2019). [DOI] [PubMed] [Google Scholar]
- 32.Zhao F et al. Paracrine Wnt5a-beta-Catenin Signaling Triggers a Metabolic Program that Drives Dendritic Cell Tolerization. Immunity 48, 147–160 e147 (2018). [DOI] [PMC free article] [PubMed] [Google Scholar]
- 33.Guerra L, Bonetti L & Brenner D Metabolic Modulation of Immunity: A New Concept in Cancer Immunotherapy. Cell Rep 32, 107848 (2020). [DOI] [PubMed] [Google Scholar]
- 34.Tibbitt CA et al. Single-Cell RNA Sequencing of the T Helper Cell Response to House Dust Mites Defines a Distinct Gene Expression Signature in Airway Th2 Cells. Immunity 51, 169–184 e165 (2019). [DOI] [PubMed] [Google Scholar]
- 35.Rogers PR, Song J, Gramaglia I, Killeen N & Croft M OX40 promotes Bcl-xL and Bcl-2 expression and is essential for long-term survival of CD4 T cells. Immunity 15, 445–455 (2001). [DOI] [PubMed] [Google Scholar]
- 36.Wu SZ et al. A single-cell and spatially resolved atlas of human breast cancers. Nat Genet 53, 1334–1347 (2021). [DOI] [PMC free article] [PubMed] [Google Scholar]
- 37.Curtis C et al. The genomic and transcriptomic architecture of 2,000 breast tumours reveals novel subgroups. Nature 486, 346–352 (2012). [DOI] [PMC free article] [PubMed] [Google Scholar]
- 38.Cancer Genome Atlas Research, N. et al. The Cancer Genome Atlas Pan-Cancer analysis project. Nat Genet 45, 1113–1120 (2013). [DOI] [PMC free article] [PubMed] [Google Scholar]
- 39.Bacigalupa ZA et al. ACSS2 Regulates HIF-2α Degradation through the E3-Ubiquitin Ligase MUL1 in Clear Cell Renal Cell Carcinoma. bioRxiv, 2022.2004.2021.489116 (2022). [Google Scholar]
- 40.Bhat-Nakshatri P et al. Acquisition, processing, and single-cell analysis of normal human breast tissues from a biobank. STAR Protoc 3, 101047 (2022). [DOI] [PMC free article] [PubMed] [Google Scholar]
- 41.Bhat-Nakshatri P et al. A single-cell atlas of the healthy breast tissues reveals clinically relevant clusters of breast epithelial cells. Cell Rep Med 2, 100219 (2021). [DOI] [PMC free article] [PubMed] [Google Scholar]
- 42.Wilde L et al. Metabolic coupling and the Reverse Warburg Effect in cancer: Implications for novel biomarker and anticancer agent development. Semin Oncol 44, 198–203 (2017). [DOI] [PMC free article] [PubMed] [Google Scholar]
- 43.Shin E & Koo JS Glucose Metabolism and Glucose Transporters in Breast Cancer. Front Cell Dev Biol 9, 728759 (2021). [DOI] [PMC free article] [PubMed] [Google Scholar]
- 44.Pavlides S et al. The reverse Warburg effect: aerobic glycolysis in cancer associated fibroblasts and the tumor stroma. Cell Cycle 8, 3984–4001 (2009). [DOI] [PubMed] [Google Scholar]
- 45.Sousa CM et al. Pancreatic stellate cells support tumour metabolism through autophagic alanine secretion. Nature 536, 479–483 (2016). [DOI] [PMC free article] [PubMed] [Google Scholar]
- 46.Auciello FR et al. A Stromal Lysolipid-Autotaxin Signaling Axis Promotes Pancreatic Tumor Progression. Cancer Discov 9, 617–627 (2019). [DOI] [PMC free article] [PubMed] [Google Scholar]
- 47.Mendoza M et al. Enzymatic transfer of acetate on histones from lysine reservoir sites to lysine activating sites. Sci Adv 8, eabj5688 (2022). [DOI] [PMC free article] [PubMed] [Google Scholar]
- 48.Cai L, Sutter BM, Li B & Tu BP Acetyl-CoA induces cell growth and proliferation by promoting the acetylation of histones at growth genes. Mol Cell 42, 426–437 (2011). [DOI] [PMC free article] [PubMed] [Google Scholar]
- 49.Balmer ML et al. Memory CD8(+) T Cells Balance Pro- and Anti-inflammatory Activity by Reprogramming Cellular Acetate Handling at Sites of Infection. Cell Metab 32, 457–467 e455 (2020). [DOI] [PubMed] [Google Scholar]
- 50.Fachi JL et al. Acetate coordinates neutrophil and ILC3 responses against C. difficile through FFAR2. J Exp Med 217 (2020). [DOI] [PMC free article] [PubMed] [Google Scholar]
- 51.Balmer ML et al. Memory CD8(+) T Cells Require Increased Concentrations of Acetate Induced by Stress for Optimal Function. Immunity 44, 1312–1324 (2016). [DOI] [PubMed] [Google Scholar]
- 52.Hanninen A, Maksimow M, Alam C, Morgan DJ & Jalkanen S Ly6C supports preferential homing of central memory CD8+ T cells into lymph nodes. Eur J Immunol 41, 634–644 (2011). [DOI] [PubMed] [Google Scholar]
- 53.Araki Y, Fann M, Wersto R & Weng NP Histone acetylation facilitates rapid and robust memory CD8 T cell response through differential expression of effector molecules (eomesodermin and its targets: perforin and granzyme B). J Immunol 180, 8102–8108 (2008). [DOI] [PMC free article] [PubMed] [Google Scholar]
- 54.Qiu J et al. Acetate Promotes T Cell Effector Function during Glucose Restriction. Cell Rep 27, 2063–2074 e2065 (2019). [DOI] [PMC free article] [PubMed] [Google Scholar]
- 55.Vodnala SK et al. T cell stemness and dysfunction in tumors are triggered by a common mechanism. Science 363 (2019). [DOI] [PMC free article] [PubMed] [Google Scholar]
- 56.Sugiura A & Rathmell JC Metabolic Barriers to T Cell Function in Tumors. J Immunol 200, 400–407 (2018). [DOI] [PMC free article] [PubMed] [Google Scholar]
- 57.Arner EN & Rathmell JC Metabolic programming and immune suppression in the tumor microenvironment. Cancer Cell (2023). [DOI] [PMC free article] [PubMed] [Google Scholar]
- 58.Chang CH et al. Metabolic Competition in the Tumor Microenvironment Is a Driver of Cancer Progression. Cell 162, 1229–1241 (2015). [DOI] [PMC free article] [PubMed] [Google Scholar]
- 59.Zhou Y, Cheng L, Liu L & Li X NK cells are never alone: crosstalk and communication in tumour microenvironments. Mol Cancer 22, 34 (2023). [DOI] [PMC free article] [PubMed] [Google Scholar]
- 60.Huntington ND, Cursons J & Rautela J The cancer-natural killer cell immunity cycle. Nat Rev Cancer 20, 437–454 (2020). [DOI] [PubMed] [Google Scholar]
- 61.Barry KC et al. A natural killer-dendritic cell axis defines checkpoint therapy-responsive tumor microenvironments. Nat Med 24, 1178–1191 (2018). [DOI] [PMC free article] [PubMed] [Google Scholar]
- 62.Bottcher JP et al. NK Cells Stimulate Recruitment of cDC1 into the Tumor Microenvironment Promoting Cancer Immune Control. Cell 172, 1022–1037 e1014 (2018). [DOI] [PMC free article] [PubMed] [Google Scholar]
Methods Only References
- 63.Mocikat R et al. Natural killer cells activated by MHC class I(low) targets prime dendritic cells to induce protective CD8 T cell responses. Immunity 19, 561–569 (2003). [DOI] [PubMed] [Google Scholar]
- 64.Allegrezza MJ et al. Trametinib Drives T-cell-Dependent Control of KRAS-Mutated Tumors by Inhibiting Pathological Myelopoiesis. Cancer Res 76, 6253–6265 (2016). [DOI] [PMC free article] [PubMed] [Google Scholar]
- 65.Rutkowski MR et al. Initiation of metastatic breast carcinoma by targeting of the ductal epithelium with adenovirus-cre: a novel transgenic mouse model of breast cancer. J Vis Exp (2014). [DOI] [PMC free article] [PubMed] [Google Scholar]
- 66.Rutkowski MR et al. Microbially driven TLR5-dependent signaling governs distal malignant progression through tumor-promoting inflammation. Cancer Cell 27, 27–40 (2015). [DOI] [PMC free article] [PubMed] [Google Scholar]
- 67.Sheen MR et al. Constitutively activated PI3K accelerates tumor initiation and modifies histopathology of breast cancer. Oncogenesis 5, e267 (2016). [DOI] [PMC free article] [PubMed] [Google Scholar]
- 68.Pfefferle AD et al. Genomic profiling of murine mammary tumors identifies potential personalized drug targets for p53-deficient mammary cancers. Dis Model Mech 9, 749–757 (2016). [DOI] [PMC free article] [PubMed] [Google Scholar]
- 69.Hollern DP et al. B Cells and T Follicular Helper Cells Mediate Response to Checkpoint Inhibitors in High Mutation Burden Mouse Models of Breast Cancer. Cell 179, 1191–1206 e1121 (2019). [DOI] [PMC free article] [PubMed] [Google Scholar]
- 70.Pfefferle AD et al. Transcriptomic classification of genetically engineered mouse models of breast cancer identifies human subtype counterparts. Genome Biol 14, R125 (2013). [DOI] [PMC free article] [PubMed] [Google Scholar]
- 71.Singh S et al. Chemotherapy Coupled to Macrophage Inhibition Induces T-cell and B-cell Infiltration and Durable Regression in Triple-Negative Breast Cancer. Cancer Res 82, 2281–2297 (2022). [DOI] [PMC free article] [PubMed] [Google Scholar]
- 72.Zheng T et al. Profiling single-guide RNA specificity reveals a mismatch sensitive core sequence. Sci Rep 7, 40638 (2017). [DOI] [PMC free article] [PubMed] [Google Scholar]
- 73.Singh S et al. Synergy of chemotherapy and macrophage depletion leads to T cell memory activation and durable triple negative breast cancer regression. bioRxiv, 2021.2002.2022.432300 (2021). [Google Scholar]
- 74.Shinde R et al. Apoptotic cell-induced AhR activity is required for immunological tolerance and suppression of systemic lupus erythematosus in mice and humans. Nat Immunol 19, 571–582 (2018). [DOI] [PMC free article] [PubMed] [Google Scholar]
- 75.Hezaveh K et al. Tryptophan-derived microbial metabolites activate the aryl hydrocarbon receptor in tumor-associated macrophages to suppress anti-tumor immunity. Immunity 55, 324–340 e328 (2022). [DOI] [PMC free article] [PubMed] [Google Scholar]
- 76.Liu Z, Gu Y, Shin A, Zhang S & Ginhoux F Analysis of Myeloid Cells in Mouse Tissues with Flow Cytometry. STAR Protoc 1, 100029 (2020). [DOI] [PMC free article] [PubMed] [Google Scholar]
- 77.Casciano JC et al. MYC regulates fatty acid metabolism through a multigenic program in claudin-low triple negative breast cancer. British journal of cancer 122, 868–884 (2020). [DOI] [PMC free article] [PubMed] [Google Scholar]
- 78.Melamud E, Vastag L & Rabinowitz JD Metabolomic analysis and visualization engine for LC-MS data. Anal Chem 82, 9818–9826 (2010). [DOI] [PMC free article] [PubMed] [Google Scholar]
- 79.Langmead B & Salzberg SL Fast gapped-read alignment with Bowtie 2. Nat Methods 9, 357–359 (2012). [DOI] [PMC free article] [PubMed] [Google Scholar]
- 80.Li B & Dewey CN RSEM: accurate transcript quantification from RNA-Seq data with or without a reference genome. BMC Bioinformatics 12, 323 (2011). [DOI] [PMC free article] [PubMed] [Google Scholar]
- 81.Love MI, Huber W & Anders S Moderated estimation of fold change and dispersion for RNA-seq data with DESeq2. Genome Biol 15, 550 (2014). [DOI] [PMC free article] [PubMed] [Google Scholar]
- 82.Dobin A et al. STAR: ultrafast universal RNA-seq aligner. Bioinformatics 29, 15–21 (2013). [DOI] [PMC free article] [PubMed] [Google Scholar]
- 83.Stuart T et al. Comprehensive Integration of Single-Cell Data. Cell 177, 1888–1902 e1821 (2019). [DOI] [PMC free article] [PubMed] [Google Scholar]
- 84.Aran D et al. Reference-based analysis of lung single-cell sequencing reveals a transitional profibrotic macrophage. Nat Immunol 20, 163–172 (2019). [DOI] [PMC free article] [PubMed] [Google Scholar]
Associated Data
This section collects any data citations, data availability statements, or supplementary materials included in this article.
Supplementary Materials
Data Availability Statement
RNA-seq data that support the findings of this study have been deposited in the Gene Expression Omnibus (GEO) under accession code GSE202281. Metabolomic data is available at the NIH Common Fund’s National Metabolomics Data Repository (NMDR) website, the Metabolomics Workbench, https://www.metabolomicsworkbench.org where it has been assigned Study ID ST002740. The data can be accessed directly via its Project DOI: http://dx.doi.org/10.21228/M89T4G. This work is supported by NIH grant U2C-DK119886. Source data for all figures and extended data have been provided as Source Data files. Previoulsy published human breast tissue scRNAseq that was re-analysed here for expression of ACSS1 and ACSS2 mRNA is available under accession code GSE164898 40, 41. Previously published human primary breast tumor scRNAseq that was re-analysed here for expression for ACSS1 mRNA is available from GSE176078 36.