Abstract
Purpose:
The purpose is to evaluate the relative contribution from confounding factors (T1w and MT) to the chemical exchange saturation transfer ratio (CESTR) quantified APT and NOE(−3.5) in tumors as well as whether the CESTR can reflect the distribution of the solute concentration (fs).
Methods:
We first provided a signal model that shows the separate dependence of CESTR on these confounding factors and the clean CEST/NOE effects quantified by an apparent exchange-dependent relaxation (AREX) method. We then measured the change in these effects in the 9L tumor model in rats, through which we calculated the relative contribution of each confounding factor. fs was also fitted, and its correlations with the CESTR and AREX was assessed to evaluate their capabilities to reflect fs.
Results:
The CESTR-quantified APT shows ‘positive’ contrast in tumors, which mainly arises from R1w at low powers and both R1w and MT at high powers. CESTR-quantified NOE(−3.5) shows no or weak contrast in tumors, which is due to the cancellation of R1w and NOE(−3.5) which have opposite contributions. CESTR-quantified APT has a stronger correlation with APT fs than AREX-quantified APT. CESTR-quantified NOE(−3.5) has a weaker correlation with NOE(−3.5) fs than AREX-quantified NOE(−3.5).
Conclusion:
CESTR reflects a combined effect of T1w and CEST/NOE. Both of these factors depend on fs, which contributes positively to the dependence of CESTR on fs in APT imaging and enhances its correlation with fs. In contrast, these factors have opposite contributions to its dependence on fs in NOE(−3.5) imaging, thereby weakening the correlation.
Keywords: Chemical exchange saturation transfer (CEST), nuclear Overhauser Enhancement (NOE), magnetization transfer (MT), tumor
INTRODUCTION
Chemical exchange saturation transfer (CEST) and nuclear Overhauser enhancement (NOE)-mediated saturation transfer are relatively new molecular MR imaging mechanisms which allow indirect detections of solute molecules with exchangeable protons or dipolar-coupled protons with enhanced sensitivity (1–6). In CEST/NOE imaging, a Z-spectrum, which is the plot of the water signal as a function of the frequency offset of the saturation pulses, is usually obtained so that different molecules with different resonance frequency offsets can be identified. Amide proton transfer (APT) is a variation of CEST imaging that detects the saturation transfer effect from mobile proteins/peptides and can be measured at approximately 3.5ppm from water (7). Nuclear Overhauser enhancement (NOE)-mediated saturation transfer imaging detects the saturation transfer effect from mobile macromolecular components with finite linewidth (e.g., large proteins, phospholipids) which can be measured at approximately −3.5ppm (8–12). These biomolecules are important tissue components that vary in multiple disorders. For example, protein overexpression (i.e., increased protein concentration) has been used as an imaging molecular biomarker for diagnosing tumors (13,14). Additionally, the concentration of most phospholipid species decreases in tumors, which has also been suggested as another cancer biomarker (15). Accurate and specific detection of variations in the concentration of these biomolecules in tissues is significant for both clinical diagnoses and research on the underlying pathologies.
However, as an indirect method for molecular imaging, CEST/NOE signals depend on not only the saturation transfer effect from the solute pool of interest but also on the water longitudinal relaxation time () as well as the background signal, including contributions from the direct water saturation (DS) and semisolid magnetization transfer (MT) effects (16). In addition, the saturation transfer effect has contributions from not only the solute concentration (fs) but also other sample parameters, including the solute-water chemical exchange rate or cross-relaxation rate (ksw) and the solute transverse relaxation rate (). These nonspecific factors may vary in different pathologies, thus reducing the accuracy and specificity of CEST/NOE imaging in detecting the solute molecular concentration leading to misinterpretations. Conventionally, a label signal that has contributions from both the CEST/NOE effect and the background signal and a reference signal that has contributions from only the background signal are first measured. The difference in the label and reference signals normalized to a control signal with no saturating pulses (1) or normalized to the reference signal (17–20), termed the chemical exchange saturation transfer ratio (CESTR), is then used to reduce the contributions from the background signal (1). However, CESTR cannot fully remove the nonspecific background signal. Previously, we have performed the first order Taylor series approximation of the CEST signal (21), in which the 0th order term can be looked as the reference signal and the 1st order term is the product of the square of the reference signal, T1obs, and the CEST effect (T1obs = 1/ R1obs is the observed water longitudinal relaxation time). Although the reference signal in the 0th order term can by removed by CESTR, the reference signal in the 1st order term cannot be removed. It scales the CEST effect and introduces non-specificities to CESTR. This scaling effect has been also reported and termed ‘shine through’ effect in previous publications (16,22,23). Additionally, CESTR has a complex dependence on T1w (21). Therefore, CESTR only provides a CEST/NOE-weighted signal. Evaluation of the relative contribution from each nonspecific factor to the CESTR contrast can help to interpret its contrast origin.
At low static magnetic fields in most clinical human imaging, the reference signal is usually obtained by an asymmetric analysis method, and is termed magnetization transfer ratio using asymmetric analysis (). The asymmetric analysis method is simple, but may cause additional contaminations from other pools symmetrically on the other side of the water peak. At high fields, a more accurate reference signal can be obtained by using other quantification methods, such as the multiple-pool Lorentzian fit (12,24–26), chemical exchange rotation transfer (CERT) (27–32), and variable delay multiple pulse (VDMP) (33,34). Previously, we evaluated the dependence of the MTRasym-quantified APT signal on T1w with experiments and simulations focused on low fields where there is a significant DS effect (21). We found that there are two types of T1w effects, termed T1w recovery and T1w-related saturation effects, which have opposite influences on the MTRasym. The T1w recovery effect reflects the dependence of MTRasym on T1w due to the recovery of water longitudinal magnetization. The T1w-related saturation effect reflects the dependence of MTRasym on T1w due to the ‘shine through’ effect from DS. Specifically, with increasing T1w, the T1w recovery effect increases the MTRasym, but the T1w-related saturation effect decreases the MTRasym. By choosing appropriate saturation powers so that the two T1w effects can be counterbalanced, the MTRasym could be roughly insensitive to T1w. However, at high fields where the DS effect is usually weak, the insensitivity of the CESTR to T1w may not be achieved. The dependence of CESTR on T1w as well as other effects at high fields has not been evaluated.
In some diseases such as cancer, changes in both T1w and MT effects have been observed. Although CESTR-quantified APT-weighted imaging and NOE-weighted imaging have been widely applied in tumors previously (14,35–46), the contributions from the change in these nonspecific factors to the CESTR contrast between tumors and normal tissues as well as its ability to reflect the distribution of corresponding molecular concentrations in tumors are unknown. To fully remove the contamination from T1w, MT, and DS effects, an apparent exchange-dependent relaxation (AREX) method was also developed to quantify CEST/NOE effects. AREX values depend only on the solute exchanging parameters, including fs, ksw, and R2s, but not other sample parameters which thus can provide more specific quantification of CEST/NOE effects than CESTR (16,22,47). However, whether AREX imaging can reflect the distribution of the corresponding molecular concentration in tumors is also unknown. In this paper, we first provided an approximate signal model to show the separate dependence of CESTR on the T1w recovery effect, the background signal, and the CEST/NOE effects; we then measured the change of these effects in animal tumor models through which we can calculate the separate contribution from change in each of these effects to the CESTR contrast between tumors and normal tissues. Last, we fitted the proton concentration of the solute molecules and examined its correlations with the CESTR and AREX to determine whether they can reflect the distribution of the corresponding molecular concentration in tumors.
THEORY
In a three-pool model including CEST/NOE, DS, and MT, these effects acquired in steady state can be described simultaneously by superimposing their rotating frame relaxations (when the concentrations of CEST and MT pools are much less than 1) (16,22),
| (1) |
Where is the RF saturation pulse frequency offset from water. , , , and are the water longitudinal relaxation, water relaxation, target CEST/NOE effect, and MT effect in the rotating frame, respectively. fm is the semi-solid MT pool concentration. can be described by (22,47),
| (2) |
where is the measured CEST signal and S0 is the control signal.
By substituting in Eq. (1) with Eq. (2) and expanding it in powers of , we can obtain
| (3) |
In APT and NOE imaging in biological tissues, is much less than (48). Therefore, the first two items in Eq. (3) dominate the CEST signal. Eq. (3) can represent . By setting to zero, we can obtain ,
| (4) |
In this paper, we termed the CESTR with normalization to the control signal CESTRI, and the CESTR with normalization to the reference signal was termed CESTRΠ. Using Eq. (3) and Eq. (4), an approximate model of CESTRI and CESTRΠ can be then derived,
| (5) |
| (6) |
Here, we termed ‘1/R1obs’ the T1w recovery effect similar to that in our previous publication (21). The term or represents the background signal (or reference signal), which should mostly arise from the MT effect at ±3.5 ppm at high fields and when relatively low saturation powers are used. can be described by Eq. (7) (22) and quantified by the AREX defined in Eq. (8) (16),
| (7) |
| (8) |
where is the solute transverse relaxation rate and is the solute frequency offset. Simulations in Supporting Information Figs. S1–S4 show that the approximate model in Eq. (5) and Eq. (6) can provide a rough estimation of CESTR. Simulations in Supporting information Figs. S5–S8 further suggest that CESTR is roughly proportional to each contributor.
Inspired by the approximate model in Eq. (5) and Eq. (6), we defined , in which ‘t’ represents tumors and ‘n’ represents normal tissues, to analyze the separate contribution from change in the T1w recovery effect, MT effect, and CEST/NOE effect to the CESTR contrast in tumors. CCESTR can be then modeled by,
| (9) |
where represents the contribution from the variation of the T1w recovery effect to CCESTR; or represents the contribution from the variation of the MT effect to CCESTR for CESTRI and CESTRΠ, respectively; and represents the contribution from the variation of the CEST/NOE effect. Simulations in Supporting Information Figs. S9–S12 show that the approximate model in Eq. (9) can provide an accurate estimation of CCESTR. Simulations in Supporting information Figs. S13–S16 further suggest that CCESTR is also proportional to each contributor.
METHODS
Animal Preparation
Eight rats bearing 9L tumors were included in this study. For brain tumor induction, each rat was injected with 1 × 10⁵ 9L glioblastoma cells in the right brain hemisphere, and was then imaged after 2 to 3 weeks. All rats were immobilized and anesthetized with a 2%/98% isoflurane/oxygen mixture during data acquisition. Respiration was monitored to be stable, and a constant rectal temperature of 37°C was maintained throughout the experiments using a warm-air feedback system (SA Instruments, Stony Brook, NY, USA). All animal procedures were approved by the Animal Care and Usage Committee of Vanderbilt University Medical Center.
MRI
All measurements were performed on a Varian DirectDrive™ horizontal 9.4 T magnet with a 38mm Litz RF coil (Doty Scientific Inc. Columbia, SC). CEST measurements were performed by applying a CW-CEST sequence with a 5s CW irradiation pulse with of , , and followed by single-shot spin-echo echo planar imaging (SE-EPI) acquisition. Z-spectra were acquired with RF offsets at ±4000, ±3500, ±3000, and from −2000 to 2000 Hz with a step of 50 Hz (−10 to 10 ppm on 9.4 T) (49). S0 were obtained by setting the RF offset to 100 kHz (250 ppm on 9.4T). Apparent water longitudinal relaxation rate (R1obs) and semisolid MT pool concentration (fm) were obtained using a selective inversion recovery (SIR) method with inversion times of 4, 5, 6, 8, 10, 12, 15, 20, 50, 200, 500, 800, 1000, 2000, 4000, and 6000 ms (50). All images were acquired with matrix size 64 × 64, field of view 30 × 30 mm2, and one acquisition.
Multiple-pool Lorentzian fit and the fitting of exchange parameters
We used multiple-pool Lorentzian fitting to process the CEST Z-spectrum. Eq. (10) gives the model function of the Lorentzian fit method.
| (10) |
Here, , which represents a Lorentzian line with central frequency offset from water (), peak full width at half maximum (Wi), and peak amplitude (Ai). N is the number of fitted pools. Specifically, a six-pool model Lorentzian fit was performed to process the Z-spectra. The model contains amide, amine, water, NOE at −1.6ppm (NOE(−1.6)) (12,51–55), NOE at −3.5ppm (NOE(−3.5)), and semisolid MT components. The number of fitted pools was estimated by observing exchange/coupling effects on Z-spectra. The fitting was performed to achieve the lowest root mean square (RMS) of residuals between the measured data and model. The Lorentzian fit was performed voxel by voxel. Supporting Information Table S1 lists the starting points and boundaries of the fit. The goodness of fit was observed by the sum of squared errors.
Since a CEST/NOE pool could be influenced by many other pools, we defined Sref to have contributions from all other pools but not the corresponding CEST/NOE pool. So Sref for APT, amine at 2ppm, NOE(−1.6), and NOE(−3.5) were obtained by the sum of all Lorentzians except the corresponding pool in Eq. (10); Slab was obtained by the sum of all Lorentzians in Eq. (10) (56). Simulations in Supporting Information Figs. S17 and S18 show that the multiple-pool Lorentzian fit can provide accurate estimation of Sref. CESTRI- and CESTRΠ-quantified CEST/NOE effects were then obtained by subtracting Slab from Sref. AREX-quantified CEST/NOE effects were then obtained by inversely subtracting Slab from Sref and with T1w normalization according to Eq. (8).
Previously, we have shown that the AREX metric using Sref from the multiple-pool Lorentzian fit can provide relatively accurate estimation of when at 9.4T (48). Here, spectra were obtained using the AREX metric and the multiple-pool Lorentzian fit. fs, ksw, and R2s were obtained by fitting (with from 5ppm to 2ppm for APT and from −2ppm to −5ppm for NOE(−3.5)) acquired with the three values to Eq. (7). Since the fitting of fs, ksw, and R2s requires a high SNR, we do not provide their maps. Instead, we first averaged the values from all voxels in a region of interest (ROI) of tumor or contralateral normal tissue, and then fit their values.
Numerical simulations
Numerical simulation of coupled Bloch equations were performed to evaluate the accuracy and reliability of the fitting method for quantifying fs. Simulated CEST Z-spectra with RF saturation time of 5s and with of , , and were first created using a seven-pool (amide at 3.5 ppm, fast exchanging amine at 3 ppm, intermediate exchanging guanidinium at 2ppm, water at 0mm, NOE(−1.6), NOE(−3.5), and semi-solid MT at −2.3ppm) model mimicking complex biological tissues. Sample parameters for the simulations are shown in Supporting information Table S2. Noises (Sn) were generated by randn function in MATLAB, and were added to the simulated CEST signals by . Other data processing to quantify AREX spectra from the simulated Z-spectra and to further fit fs, ksw, and T2s was the same as that for processing the in vivo data. SNR was calculated using the ratio of the noise to the equilibrium water signal. At each noise level, 100 data sets were generated to determine the resulting variance in the fitted parameters.
The coupled Bloch equations can be written as , where A is a 19 matrix for the seven-pool model. The water and solute pools each have three coupled equations representing their x, y, and z components. All numerical calculations of the CEST signals integrated the differential equations through the sequence using the ordinary differential equation solver (ODE45) in MATLAB 2018a (Math Works, Natick, MA, USA).
Data analysis and statistics
Student’s t-test was employed to evaluate the difference of all MRI/CEST parameters between tumors and contralateral normal tissues. Correlations between all MRI/CEST parameters and fs were performed. Spearman’s r and p values were provided. The corresponding linear regression was also provided to indicate how these parameters are correlated in a linear manner. It was considered to be statistically significant when p < 0.05. ROIs of tumor were outlined from the fm map with values less than a threshold of 7%. ROIs of contralateral normal tissue were chosen to mirror the tumor ROIs.
RESULTS
Fig. 1 and Fig. 2 show the Monte Carlo simulation of the fitting method for quantifying the APT fs and the NOE(−3.5) fs, respectively, with a variety of noise levels. The mean coefficient of variation is 11.97% for the fitting of APT fs in Fig. 1d and is 3.54% for the fitting of NOE(−3.5) fs in Fig. 2d when the SNR is 250. The normalized root mean square error (NRMSE) between the mean of the fitted fs and the ground truth is 2.03% for the fitting of APT fs in Fig. 1d and is 4.01% for the fitting of NOE(−3.5) fs in Fig. 2d when the SNR is 250. The relatively low coefficient of variation and NRMSE suggest that the fitting method for quantifying fs is accurate. Supporting Information Figs. S19 shows the Monte Carlo simulation of this fitting method for quantifying fs for a variety of varied sample parameters, which suggests that the fitted fs is roughly independent of other sample parameters and thus is reliable.
Fig. 1.
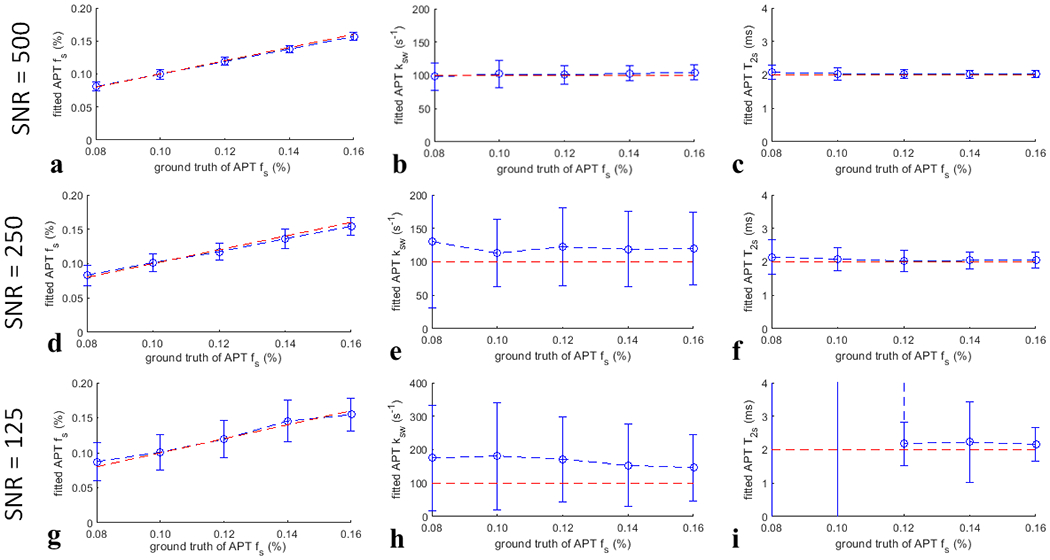
Monte Carlo simulation of the fitted APT fs, APT ksw, and APT T2s (blue lines) from simulations with varied APT fs, but constant APT ksw and APT T2s for different SNR. The ground truth of the fitted parameters (red lines) were also plotted for comparison.
Fig. 2.
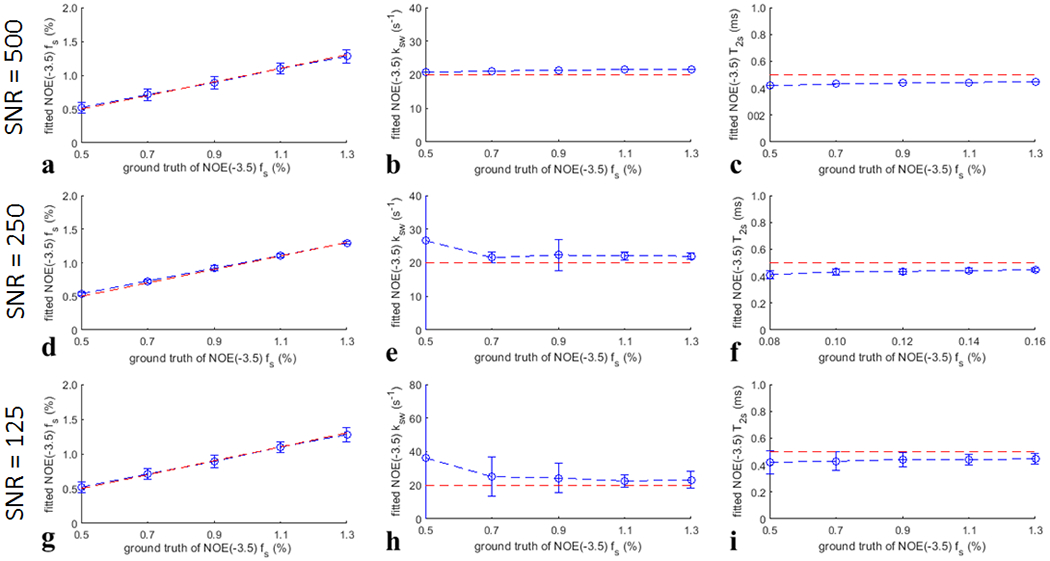
Monte Carlo simulation of the fitted NOE(−3.5) fs, NOE(−3.5) ksw, and NOE(−3.5) T2s (blue lines) from simulations with varied NOE(−3.5) fs, but constant NOE(−3.5) ksw and NOE(−3.5) T2s for different SNR. The ground truth of the fitted parameters (red lines) were also plotted for comparison.
Fig. 3a and 3b show the average CEST Z-spectra (or Slab) and the corresponding Sref for the multiple-pool Lorentzian fitting of APT and NOE(−3.5), as well as the fitting residuals from tumors and contralateral normal tissues of the eight rats with of . APT at 3.5ppm, amine at 2ppm, NOE at −1.6ppm and −3.5ppm, and the broad semisolid MT can be clearly observed on the CEST Z-spectra. The small residuals (< ±0.2%) in the frequency range of APT and NOE peaks indicate the success in the multiple-pool Lorentzian fit of these CEST/NOE effects. Fig. 3c–3h shows the spectra of CESTRI, CESTRΠ, and AREX for APT and NOE(−3.5) with of . Supporting Information Fig. S20 and S21 show these spectra with of and , respectively.
Fig. 3.
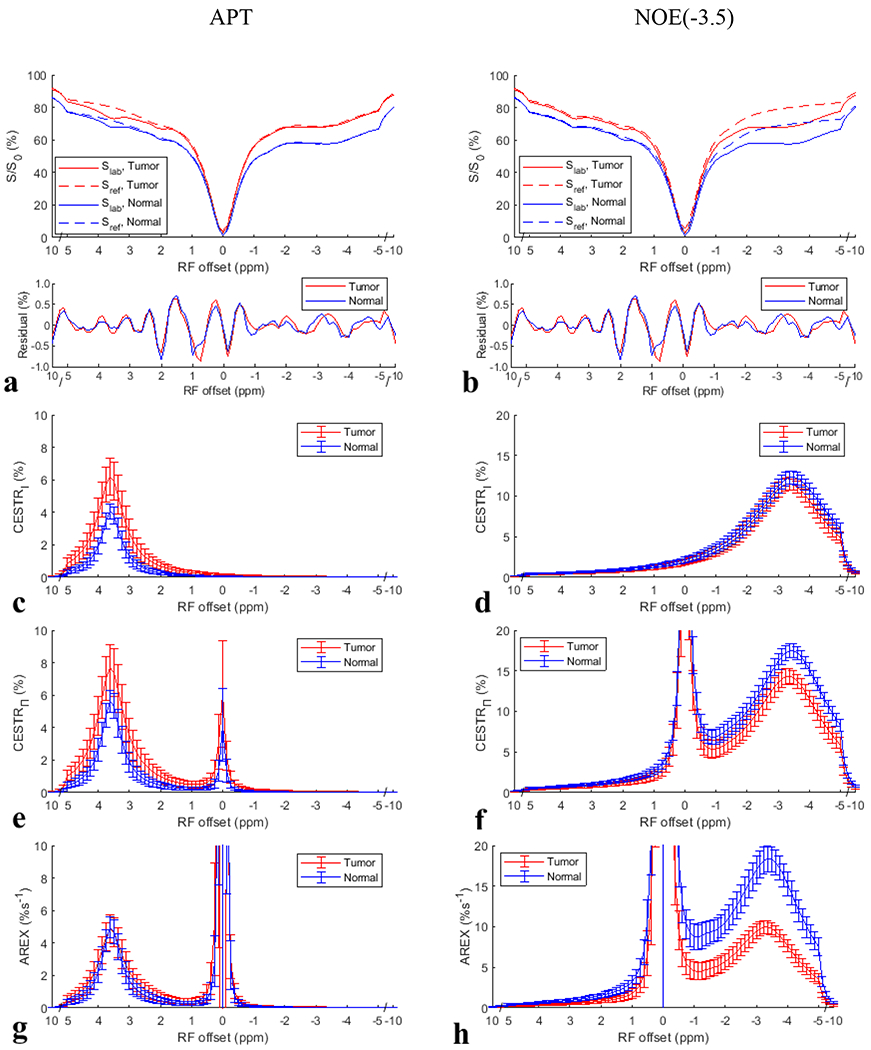
Average CEST Z-spectra (or Slab) and the corresponding Sref for the multiple-pool Lorentzian fitting of APT (a) and NOE(−3.5) (b) from tumors and contralateral normal tissues of the eight rats with a value of , as well as the fitting residuals. The CESTRI, CESTRΠ, and AREX spectra obtained from these Z-spectra for APT (c, e, g) and NOE(−3.5) (b, f, h), respectively.
Table 1 lists the values of CESTRI, CESTRΠ, Sref/S0, and AREX for APT at 3.5ppm and for NOE at −3.5ppm, R1w, fm, as well as the fitted fs, ksw, and R2s from tumors and contralateral normal tissue. There were significant differences between tumors and contralateral normal tissues for CESTRI- and CESTRΠ-quantified APT, R1obs, fm and APT fs but not for AREX-quantified APT for all values. In contrast, there were significant differences between tumors and contralateral normal tissues for both the CESTR- and AREX-quantified NOE(−3.5) as well as the NOE(−3.5) fs for all values, except the CESTRI-quantified NOE(−3.5) with an of . Fig. 4 shows the maps of CESTRI, CESTRΠ, and AREX for APT at 3.5ppm and for NOE at −3.5ppm with of from a representative rat brain. Fig. S22 shows these maps with of and . Positive CESTR contrast, but no or weak AREX contrast, for APT imaging can be clearly observed, especially at higher values. Negative AREX contrast, but no or weak CESTR contrast, for NOE(−3.5) imaging can be clearly observed, especially at higher values.
Table 1.
lists of the values of CESTRI, CESTRΠ, Sref/S0, and AREX for APT at 3.5ppm and for NOE at −3.5ppm, R1w, fm, as well as the fitted fs, ksw, and R2s for APT and NOE(−3.5) from tumors and contralateral normal tissue.
| APT | NOE(−3.5) | |||
|---|---|---|---|---|
| Tumor | Normal | Tumor | Normal | |
| CESTRI (%) | 1.62±0.23* | 1.31±0.17 | 3.99±0.54* | 4.56±0.43 |
| CESTRI (%) | 3.70±0.80* | 2.81±0.30 | 8.54±0.42* | 9.56±0.87 |
| CESTRI (%) | 6.27±1.10* | 4.16±0.49 | 11.66±0.72 | 12.36±0.81 |
| CESTRΠ (%) | 1.66±0.25* | 1.34±0.17 | 4.09±0.56* | 4.73±0.45 |
| CESTRΠ (%) | 3.98±0.88* | 3.14±0.35 | 9.22±0.43* | 10.87±0.97 |
| CESTRΠ (%) | 7.79±1.37* | 5.78±0.71 | 14.54±0.93* | 17.55±0.87 |
| R1w (s−1) | 0.44±0.03* | 0.56±0.02 | 0.44±0.03* | 0.56±0.02 |
| fm (%) | 4.94±0.38* | 9.99±1.26 | 4.94±0.38* | 9.99±1.26 |
| Sref/S0 (%) | 97.80±0.58* | 97.15±0.50 | 97.75±0.67 | 96.29±0.86 |
| Sref/S0 (%) | 92.74±0.68* | 89.49±0.70 | 92.62±1.24* | 87.55±1.11 |
| Sref/S0 (%) | 79.68±2.10* | 71.50±1.85 | 80.35±1.61* | 70.07±2.69 |
| AREX (%s−1) | 0.81±0.12 | 0.84±0.09 | 2.06±030* | 3.11±0.34 |
| AREX (%s−1) | 2.07±0.38 | 2.17±0.21 | 5.18±0.29* | 8.42±0.83 |
| AREX (%s−1) | 4.92±0.84 | 5.11±0.65 | 10.15±0.76* | 18.46±1.57 |
| fs (%) | 0.13±0.03* | 0.10±0.02 | 0.95±0.10* | 1.53±0.26 |
| ksw (s−1) | 81.62±50.17 | 109.81±81.12 | 14.30±2.55* | 19.93±4.27 |
| T2s (ms) | 1.20±0.34 | 1.70±0.54 | 0.52±0.09 | 0.45±0.06 |
p < 0.05
Fig. 4.
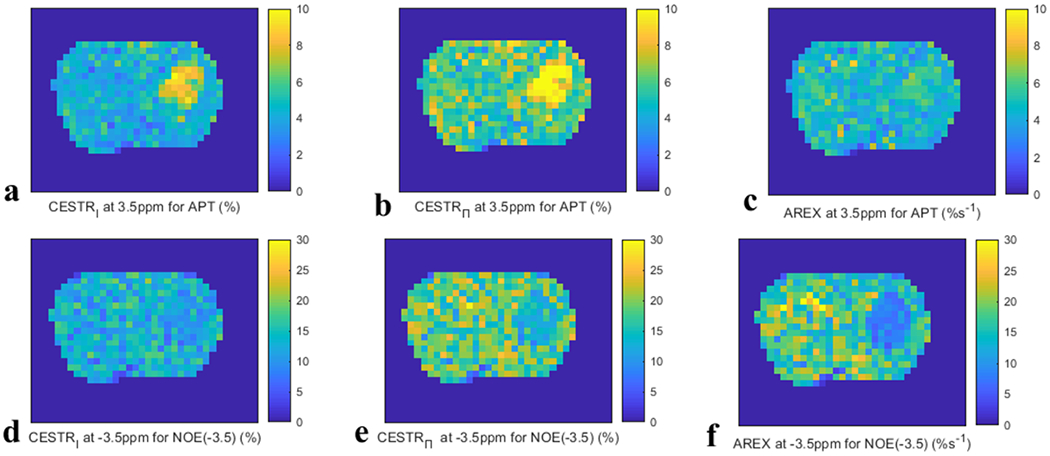
Maps of CESTRI (left column), CESTRΠ (medium column), and AREX (right column) for APT at 3.5 ppm (a-c) and NOE at −3.5 ppm (d-f) with of from a representative rat brain.
Fig. 5 and Fig. 6 show the CCESTR and each of its contributors (i.e., , CMT, and ) for APT and NOE(−3.5) from the eight rats. The average for APT is very small compared with the average |CCESTR-1| for all values; the average |CMT-1| for APT is also very small at of and but increases at of ; the average is comparable to the average |CCESTR-1| for APT at of and but is relatively smaller than it is at of ; both the average and average |CMT-1| are major contributors to |CCESTR-1| at of . This result suggests that the change in R1obs in tumors dominates the CESTR contrast at lower values, and both R1obs and the MT effect dominate the CESTR contrast at higher values. Both the average and the average CCESTR for NOE(−3.5) are less than 1, and the average is larger than the average |CCESTR-1| for all values. In contrast, both the average and average CMT for NOE(−3.5) are greater than 1; similar to APT, the average |CMT-1| for NOE(−3.5) is also very small at values of and , but increases at values of . This result suggests that changes in both R1obs and NOE(−3.5) effect in tumors contribute to the CESTR contrast at lower values and changes in R1obs, MT effect, and NOE(−3.5) effect in tumors contribute to the CESTR contrast at higher values. Additionally, the contributions from R1obs and NOE(−3.5) effect are in opposite directions, causing the reduced CESTR contrast. In addition, compared with CESTRI, CESTRΠ has a reduced contribution from the MT effect for both the APT and NOE(−3.5). However, CESTRΠ still cannot remove the contribution from R1obs.
Fig. 5.
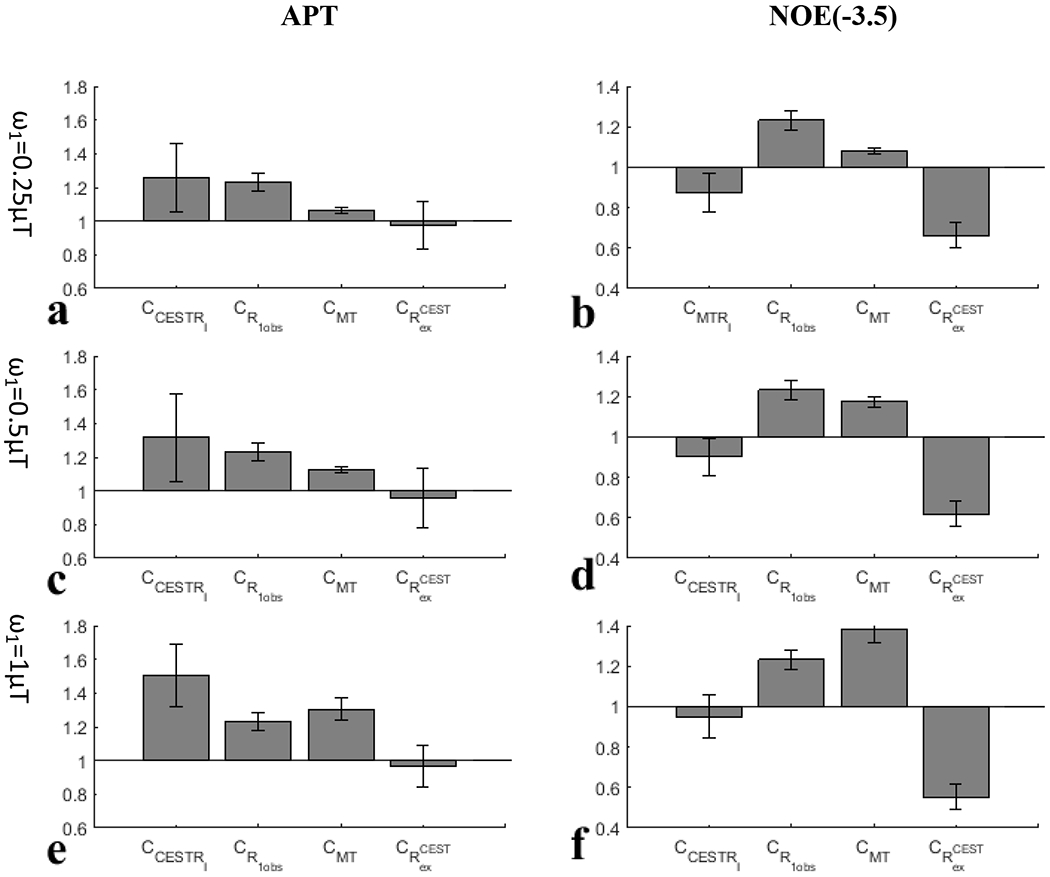
and each of its contributors for APT (left column) and NOE(−3.5) (right column) with values of (a, b), (e, f), and (i, j), respectively, from the eight rats.
Fig. 6.
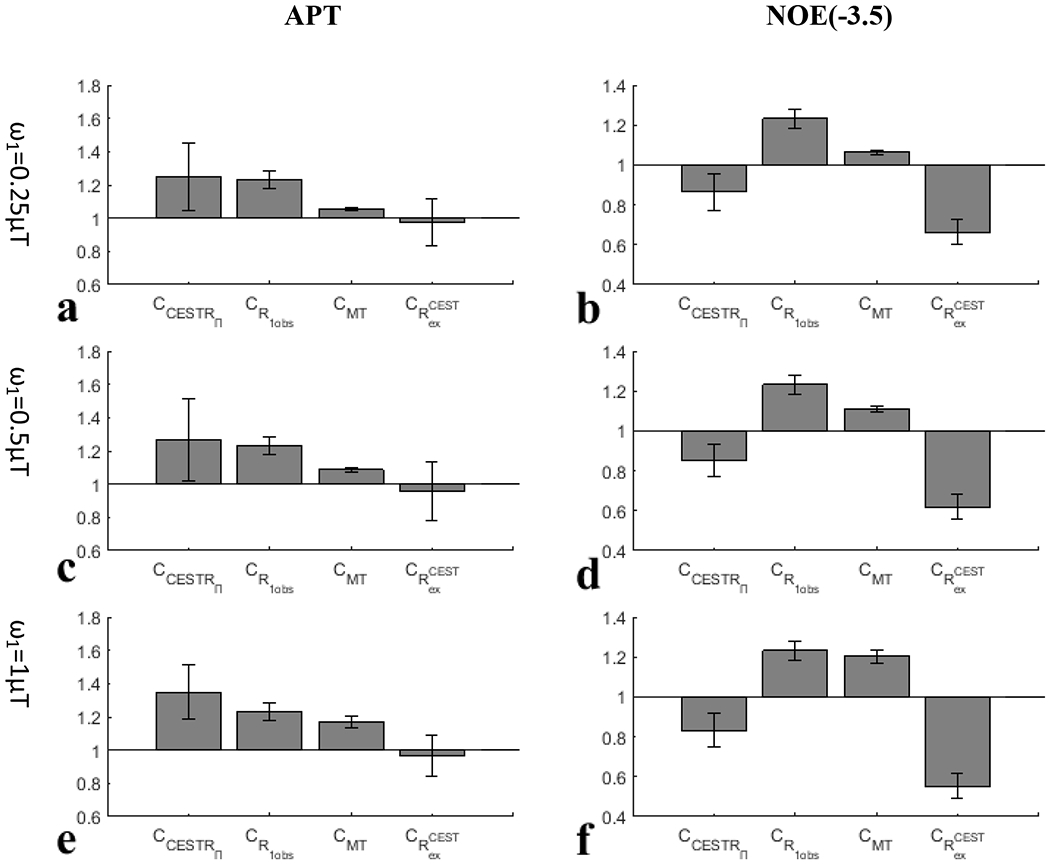
and each of its contributors for APT (left column) and NOE(−3.5) (right column) with values of (c, d), (g, h), and (k, l), respectively, from the eight rats.
Fig. 7 summarizes the correlations between the APT effect quantified by the three CEST metrics (CESTRI, CESTRΠ, AREX) and the corresponding APT fs from both the tumors and the contralateral normal tissues. Significant correlations between the CESTR-quantified APT effect and the APT fs, but not between the AREX-quantified APT effect and the APT fs, for all values were found. Fig. 8 summarizes the correlations between the NOE(−3.5) effect quantified by the three CEST metrics (CESTRI, CESTRΠ, AREX) and the corresponding NOE(−3.5) fs from both the tumors and the contralateral normal tissues. Significant correlations between the NOE(−3.5) effect quantified the three CEST metrics and the NOE(−3.5) fs for all values (except the CESTRΠ-quantified NOE(−3.5) for value of ) were found. However, the correlation between the AREX-quantified NOE(−3.5) effect and the NOE(−3.5) fs is stronger than the correlation between the CESTR-quantified NOE(−3.5) effect and the NOE(−3.5) fs.
Fig. 7.
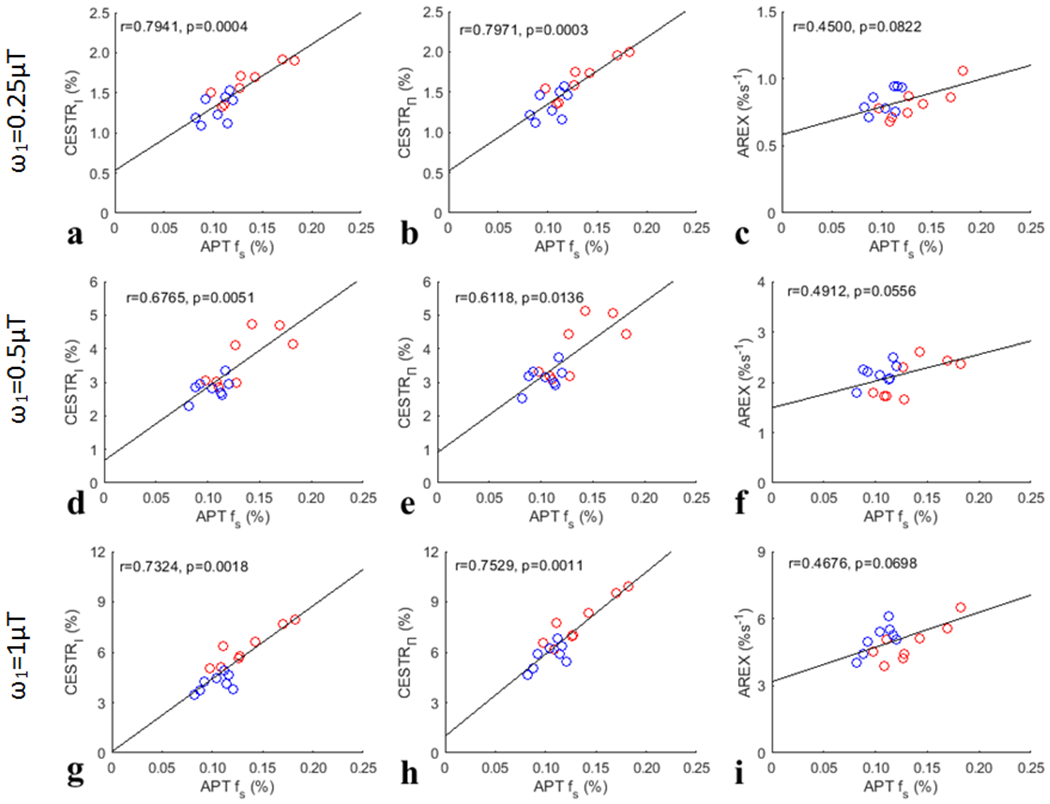
Summarized correlation of three CEST metrics (CESTRI, CESTRΠ, AREX) at 3.5ppm for APT with the corresponding APT fs from both the tumors and the contralateral normal tissues of the eight rats. The red circles represent the mean values of each tumor, and the blue circles are the mean values of each ROI of contralateral normal tissue. The Spearman’s rank correlation coefficient (r) and p value of each correlation are provided. The black lines represent the linear regression of all data points in each correlation subfigure.
Fig. 8.
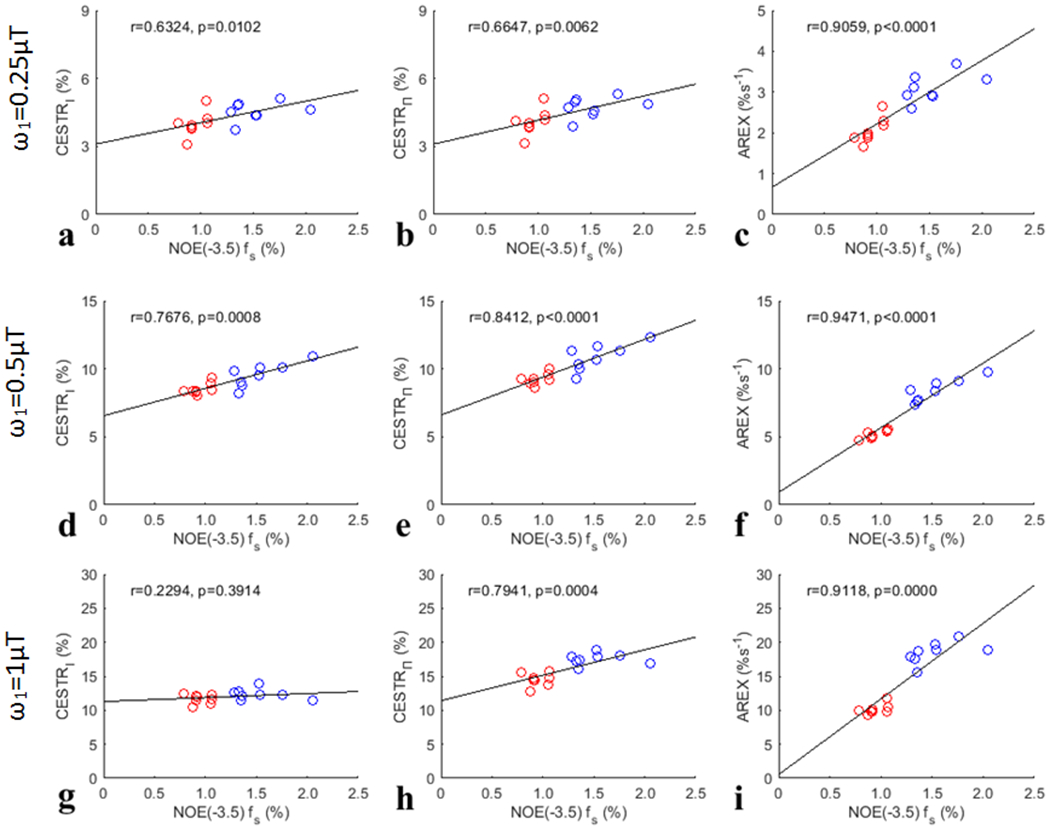
Summarized correlation of three CEST metrics (CESTRI, CESTRΠ, AREX) at −3.5ppm for NOE(−3.5) with the corresponding NOE(−3.5) fs from both the tumors and the contralateral normal tissues of the eight rats. The red circles represent the mean values of each tumor, and the blue circles are the mean values of each ROI of contralateral normal tissue. The Spearman’s rank correlation coefficient (r) and p value of each correlation are provided. The black lines represent the linear regression of all data points in each correlation subfigure.
Fig. 9 summarizes the correlations between the confounding factors (1/R1obs, Sref/S0 with the three ) and the APT fs and NOE(−3.5) fs, respectively, from both the tumors and the contralateral normal tissues. Although 1/R1obs has positive correlation with APT fs, it has negative correlation with NOE fs. Supporting Information Fig. S23 and S24 summarizes the correlations between other MRI/CEST parameters (fm, all CESTR- and AREX-quantified CEST/NOE effects with the three , NOE(−3.5) or APT fs) and the APT fs and NOE(−3.5) fs, respectively, from both the tumors and the contralateral normal tissues. Significant correlations of 1/R1obs, fm, NOE(−1.6) and NOE(−3.5) quantified by the three metrics (except the AREX-quantified NOE(−3.5)) with the APT fs were found. However, the correlation between these MRI/CEST parameters and the APT fs is not as strong as that between the CESTR and the APT fs. Significant correlations of 1/R1obs, Sref/S0 with all values, fm, CESTRI-quantified APT, CESTRΠ-quantified NOE(−1.6) and APT, as well as AREX quantified amine and NOE(−1.6) with the APT fs were found. However, the correlation between these MRI/CEST parameters (except 1/R1obs and Sref/S0 with a value of ) and the NOE(−3.5) fs is not as strong as that between the AREX and the NOE(−3.5) fs.
Fig. 9.
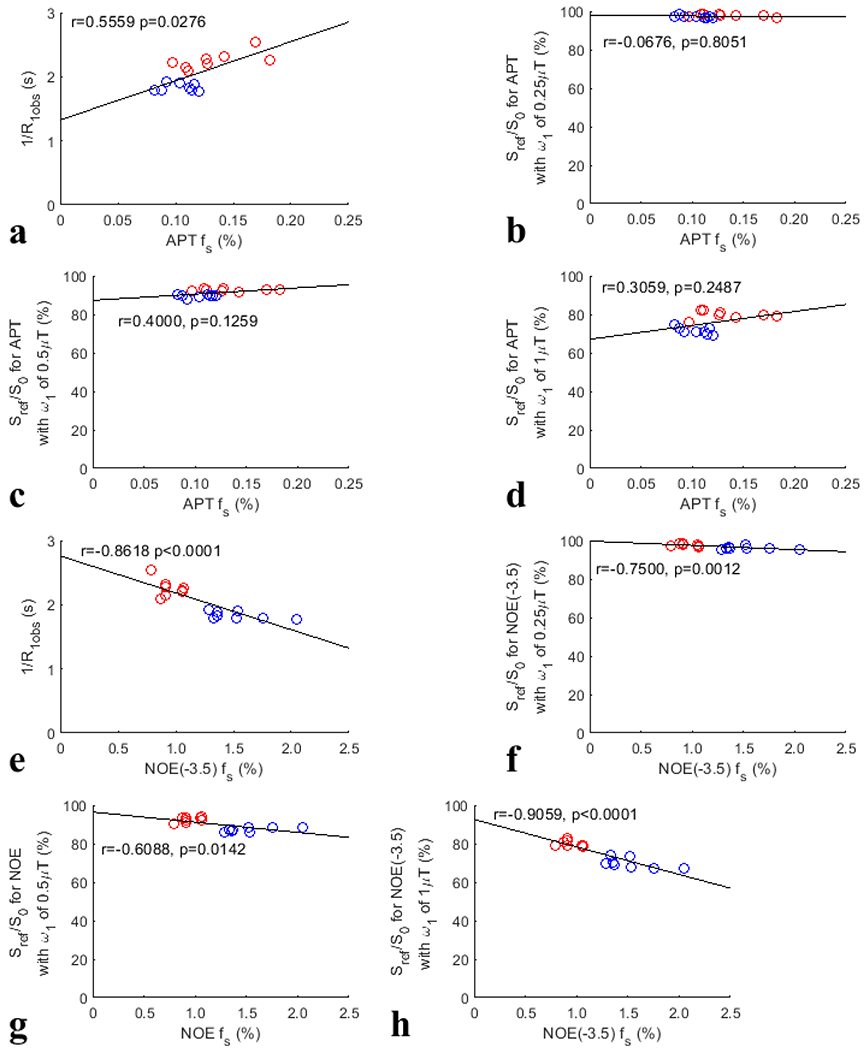
Summarized correlation of the confounding factors (1/R1obs, Sref/S0 with values of , , and ) with the APT fs (a-d) and NOE(−3.5) fs (e-h), respectively, from both the tumors and the contralateral normal tissues of the eight rats. The red circles represent the mean values of each tumor, and the blue circles are the mean values of each ROI of contralateral normal tissue. The Spearman’s rank correlation coefficient (r) and p value of each correlation are provided. The black lines represent the linear regression of all data points in each correlation subfigure.
DISCUSSION
Although it has been noticed that the APT/NOE-weighted imaging in tumors has contaminations from both T1obs and MT effects (57), it is still not clear about how these confounding factors influence the APT/NOE-weighted imaging and how much their relative contributions are. This may be due the short of appropriate signal models for analyzing the contributions from the confounding factors. Although a few signal models have been previously derived from the coupled Bloch equations, they are very complex, especially when multiple pools for modeling biological tissues are considered, which do not show intuitive dependencies on the confounding factors and the CEST effects (3). In this paper, we provided a new approximate signal model which can be approximated as the multiplication of three independent terms, which are determined by the T1w recovery effect, MT effect, and CEST/NOE effect, respectively. This approximate signal model allows us to analyze each of the contributors separately.
Although the CESTR-quantified APT is not specific to the APT effect, it has a stronger correlation with the APT fs than the AREX-quantified APT. This is consistent with a previous report showing a strong correlation between the MTRasym-quantified APT and protein content using proteomic analysis (13). Fig. 7 shows that there are positive correlations between the AREX-quantified APT and the APT fs with relatively low p values (close to 0.05) although there are no statistical significance. Fig. 9 shows that there is a significant positive correlation between 1/R1obs and the APT fs. Since CESTR is roughly equal to the production of 1/R1obs, Sref/S0/(1+fm) or (Sref/S0)2/(1+fm), and as shown in Eq. (5) and Eq. (6), the strong correlation between the CESTR-quantified APT and the APT fs may be due to the enhancement effect from both 1/R1obs and the APT effect. Therefore, the CESTR-quantified APT contrast between tumors and normal tissues should reflect a combined effect from these two APT fs-sensitive factors, which is thus more strongly related to the APT fs than all other MRI/CEST parameters analyzed in this paper. CESTR is a widely used method to quantify APT effect which has shown interesting contrast in tumors, suggesting that it may reflect the underlying biomarker. Our results provide insight into the interpretation of the contrast origin of the APT/NOE-weighted imaging in tumors at high fields.
The CESTR-quantified NOE(−3.5) is not specific to the NOE(−3.5) effect. Different from the APT, the correlation between the CESTR-quantified NOE(−3.5) and the NOE(−3.5) fs is not as strong as that between the AREX-quantified NOE(−3.5) and the NOE(−3.5) fs. Fig. 8 shows that there are significant positive correlations between the AREX-quantified NOE(−3.5) and the NOE(−3.5) fs. Fig. 9 shows that there are significant negative correlations between 1/R1obs and the NOE(−3.5) fs. The relatively weaker correlation between the CESTR-quantified NOE(−3.5) and the NOE(−3.5) fs than that between the AREX-quantified NOE(−3.5) and the NOE(−3.5) fs should be due to the cancellation effect from 1/R1obs and the NOE(−3.5) effect which have opposite influences on the CESTR-quantified NOE(−3.5) contrast. The positive correlations of both the CESTR-quantified NOE(−3.5) and the AREX-quantified NOE(−3.5) with the NOE(−3.5) fs suggest that the contribution from the NOE(−3.5) effect to the CESTR-quantified NOE(−3.5) dominates that from R1obs. Therefore, the CESTR-quantified NOE(−3.5) contrast between tumors and normal tissues should mainly reflect the NOE(−3.5) effect, but has negative but small contributions from 1/R1obs.
Previously, it was indicated that the APT fs has little impact on R1obs (16). But significant correlation between 1/R1obs and APT fs was found in Fig. 9a. This can be explained by that the amide concentration reflects the concentration of proteins which influence R1obs through other fast exchanging protons (e.g., amines, hydroxyls) and/or dipolar-coupled protons. In addition, significant correlation between fm and APT fs was found in Supporting information Fig. S23a. The mechanism is unclear. Supporting information Fig17. Sj-Sl show that the multiple-pool Lorentzian fitted Sref matches the ground truth simulated Sref very well with varied fm, suggesting that this correlation is not due to the failure of the multiple-pool Lorentzian fit in separating APT from MT.
Our conclusion about the relative contributions from confounding factors to the APT/NOE contrast in tumors relies on the accuracy of the approximate model in Eq. (9). In Supporting Information Fig. S1–S16, although the deviations of the approximate model in Eq. (5) and Eq. (6) are from a few percent to more than ten percent, the deviations of the approximate model in Eq. (9) are very small (<3%). The deviations in Eq. (5) and Eq. (6) are due to the ignorance of the higher order terms of the Taylor series. However, these higher order terms may have a roughly similar form of dependence on the contributing factors to that in Eq. (5) and Eq. (6). Thus, the ratio of two CESTR values from tumor and normal tissues in Eq. (9) has less influence from the ignorance of the higher order terms.
Our conclusion about the capability of the CESTR and AREX to reflect the solute molecular concentration relies on the accurate and robust fitting of fs. Fig. 1 and Fig. 2 show that although the fitting of ksw and R2s are unreliable, the fitting of fs is relatively accurate and robust. Our fitted APT fs values are much smaller than those reported in previous publications (58–61). This may be due to the use of different models. Previously, we showed that the fast exchanging amine CEST effect is present at both high and low values (e.g. ) and has significant contributions to the CEST signal at 3.5ppm (48,62). We also showed that the influence of the fast exchanging amine CEST effect on the quantification of APT can be significantly reduced by multiple-pool Lorentzian fit with at 9.4T. In this paper, we used low values and the multiple-pool Lorentzian fit to reduce the contamination from the fast exchanging amine CEST effect. However, in previous papers, the contribution from the fast exchanging amine CEST effect was not considered.
In this paper, we used the ratio of two CESTR signals from tumors and normal tissues (i.e., CCESTR = CESTRt / CESTRn) to reflect the CESTR contrast. Conventionally, CESTR contrast in tumors has been calculated by the subtraction of two CESTR signals from tumors and normal tissues (i.e., CESTRt - CESTRn) (63). By inputting CCESTR, this conventional CESTR contrast becomes (CCESTR-1)·CESTRn or ()·CESTRn. From this equation, we can see that the relative size of , , and can still reflect their relative contributions to the conventional CESTR contrast.
Based on Eq. (7) and Eq. (8), the AREX metric reflects the production of fs, ksw, and a labeling efficiency related factor. In the full-saturation limit (64), AREX equals fsksw. In this paper, we used % and s-1 as units for fs and ksw, respectively. Therefore, we used %s−1 as the unit for the AREX metric. It is worth noting that some previous publications have used Hz as the unit for the AREX metric which may look fs as a dimensionless number (65–67).
Our experiments were performed on 9L tumor models in rat brains. In other animal tumor models and human patients, the change in the sample parameters may be different. Further studies related to the specificity of CESTR and its capability to reflect solute concentration in other tumor models are needed. Our conclusion does not fit for the MTRasym-quantified APT at 3T, since it depends on not only the R1obs and MT but also amine, DS and NOE effects, which are more complex.
CONCLUSION
CESTR measures a combined effect from the change in R1w, MT, and CEST/NOE effects in tumors and thus is not a specific metric. However, in APT imaging, all these factors contribute positively to the dependence of CESTR on the amide concentration, which makes it a better method for detecting the increased protein concentration in tumors than other MRI/CEST parameters. In contrast, the AREX-quantified APT has no significant correlation with the amide concentration. In NOE(−3.5) imaging, these factors contribute to the dependence of CESTR on the macromolecular NOE pool concentration in opposite directions, which reduces its ability to detect the reduced macromolecular NOE pool concentration in tumors. In contrast, the AREX-quantified NOE(−3.5) has a significant and stronger correlation with the macromolecular NOE pool concentration.
Supplementary Material
Grant Sponsor:
R21 AR074261, R03 EB029078, R01 EB029443
REFERENCES
- 1.Zhou JY, van Zijl PCM. Chemical exchange saturation transfer imaging and spectroscopy. Prog Nucl Mag Res Sp 2006;48(2–3):109–136. [Google Scholar]
- 2.van Zijl PCM, Yadav NN. Chemical Exchange Saturation Transfer (CEST): What is in a Name and What Isnť? Magnetic Resonance In Medicine 2011;65(4):927–948. [DOI] [PMC free article] [PubMed] [Google Scholar]
- 3.Kim J, Wu Y, Guo Y, Zheng H, Sun PZ. A review of optimization and quantification techniques for chemical exchange saturation transfer MRI toward sensitive in vivo imaging. Contrast media & molecular imaging 2015;10(3):163–178. [DOI] [PMC free article] [PubMed] [Google Scholar]
- 4.Wu B, Warnock G, Zaiss M, Lin C, Chen M, Zhou Z, Mu L, Nanz D, Tuura R, Delso G. An overview of CEST MRI for non-MR physicists. Ejnmmi Phys 2016;3(1). [DOI] [PMC free article] [PubMed] [Google Scholar]
- 5.van Zijl PCM, Lam WW, Xu JD, Knutsson L, Stanisz GJ. Magnetization Transfer Contrast and Chemical Exchange Saturation Transfer MRI. Features and analysis of the field-dependent saturation spectrum. Neuroimage 2018;168:222–241. [DOI] [PMC free article] [PubMed] [Google Scholar]
- 6.Zhou Y, Bie CX, van Zijl PCM, Yadav NN. The relayed nuclear Overhauser effect in magnetization transfer and chemical exchange saturation transfer MRI. NMR in biomedicine 2022. [DOI] [PMC free article] [PubMed] [Google Scholar]
- 7.Zhou J, Payen JF, Wilson DA, Traystman RJ, van Zijl PC. Using the amide proton signals of intracellular proteins and peptides to detect pH effects in MRI. Nature medicine 2003;9(8):1085–1090. [DOI] [PubMed] [Google Scholar]
- 8.Anderson WA, Freeman R. Influence Of a Second Radiofrequency Field on High-Resolution Nuclear Magnetic Resonance Spectra. J Chem Phys 1962;37(1):85-&. [Google Scholar]
- 9.Vogeli B The nuclear Overhauser effect from a quantitative perspective. Progress in Nuclear Magnetic Resonance Spectroscopy 2014;78:1–46. [DOI] [PubMed] [Google Scholar]
- 10.Solomon I Relaxation Processes In a System Of 2 Spins. Phys Rev 1955;99(2):559–565. [Google Scholar]
- 11.Goerke S, Zaiss M, Kunz P, Klika KD, Windschuh JD, Mogk A, Bukau B, Ladd ME, Bachert P. Signature of protein unfolding in chemical exchange saturation transfer imaging. NMR in biomedicine 2015;28(7):906–913. [DOI] [PubMed] [Google Scholar]
- 12.Zhang XY, Wang F, Jin T, Xu JZ, Xie JP, Gochberg DF, Gore JC, Zu ZL. MR imaging of a novel NOE-mediated magnetization transfer with water in rat brain at 9.4T. Magnetic Resonance In Medicine 2017;78(2):588–597. [DOI] [PMC free article] [PubMed] [Google Scholar]
- 13.Yan K, Fu ZM, Yang C, Zhang K, Jiang SS, Lee DH, Heo HY, Zhang Y, Cole RN, Van Eyk JE, Zhou JY. Assessing Amide Proton Transfer (APT) MRI Contrast Origins in 9 L Gliosarcoma in the Rat Brain Using Proteomic Analysis. Mol Imaging Biol 2015;17(4):479–487. [DOI] [PMC free article] [PubMed] [Google Scholar]
- 14.Zhou JY, Tryggestad E, Wen ZB, Lal B, Zhou TT, Grossman R, Wang SL, Yan K, Fu DX, Ford E, Tyler B, Blakeley J, Laterra J, van Zijl PCM. Differentiation between glioma and radiation necrosis using molecular magnetic resonance imaging of endogenous proteins and peptides. Nature medicine 2011;17(1):130–U308. [DOI] [PMC free article] [PubMed] [Google Scholar]
- 15.Bandu R, Mok HJ, Kim KP. Phospholipids as Cancer Biomarkers: Mass Spectrometry-Based Analysis. Mass Spectrom Rev 2018;37(2):107–138. [DOI] [PubMed] [Google Scholar]
- 16.Zaiss M, Zu ZL, Xu JZ, Schuenke P, Gochberg DF, Gore JC, Ladd ME, Bachert P. A combined analytical solution for chemical exchange saturation transfer and semi-solid magnetization transfer. NMR in biomedicine 2015;28(2):217–230. [DOI] [PMC free article] [PubMed] [Google Scholar]
- 17.Jin T, Kim SG. Quantitative chemical exchange sensitive MRI using irradiation with toggling inversion preparation. Magnetic Resonance In Medicine 2012;68(4):1056–1064. [DOI] [PMC free article] [PubMed] [Google Scholar]
- 18.Wermter FC, Bock C, Dreher W. Investigating GluCEST and its specificity for pH mapping at low temperatures. NMR in biomedicine 2015;28(11):1507–1517. [DOI] [PubMed] [Google Scholar]
- 19.Ling W, Regatte RR, Navon G, Jerschow A. Assessment of glycosaminoglycan concentration in vivo by chemical exchange-dependent saturation transfer (gagCEST). P Natl Acad Sci USA 2008;105(7):2266–2270. [DOI] [PMC free article] [PubMed] [Google Scholar]
- 20.Liu GS, Gilad AA, Bulte JWM, van Zijl PCM, McMahon MT. High-throughput screening of chemical exchange saturation transfer MR contrast agents. Contrast media & molecular imaging 2010;5(3):162–170. [DOI] [PMC free article] [PubMed] [Google Scholar]
- 21.Zu ZL. Towards the complex dependence of MTRasym on T-1w in amide proton transfer (APT) imaging. NMR in biomedicine 2018;31(7). [DOI] [PMC free article] [PubMed] [Google Scholar]
- 22.Zaiss M, Bachert P. Exchange-dependent relaxation in the rotating frame for slow and intermediate exchange - modeling off-resonant spin-lock and chemical exchange saturation transfer. NMR in biomedicine 2013;26(5):507–518. [DOI] [PubMed] [Google Scholar]
- 23.Zaiss M, Xu JZ, Goerke S, Khan IS, Singer RJ, Gore JC, Gochberg DF, Bachert P. Inverse Z-spectrum analysis for spillover-, MT-, and T-1-corrected steady-state pulsed CEST-MRI - application to pH-weighted MRI of acute stroke. Nmr in Biomedicine 2014;27(3):240–252. [DOI] [PMC free article] [PubMed] [Google Scholar]
- 24.Zaiss M, Schmitt B, Bachert P. Quantitative separation of CEST effect from magnetization transfer and spillover effects by Lorentzian-line-fit analysis of z-spectra. J Magn Reson 2011;211(2):149–155. [DOI] [PubMed] [Google Scholar]
- 25.Desmond KL, Moosvi F, Stanisz GJ. Mapping of amide, amine, and aliphatic peaks in the CEST spectra of murine xenografts at 7 T. Magnetic Resonance in Medicine 2014;71(5):1841–1853. [DOI] [PubMed] [Google Scholar]
- 26.Zhou IY, Lu D, Ji Y, Wu L, Wang E, Cheung JS, Zhang X-A, Sun PZ. Determination of multipool contributions to endogenous amide proton transfer effects in global ischemia with high spectral resolution in vivo chemical exchange saturation transfer MRI. Magnetic Resonance in Medicine;in press. [DOI] [PMC free article] [PubMed] [Google Scholar]
- 27.Zu Z, Janve VA, Xu J, Does MD, Gore JC, Gochberg DF. A new method for detecting exchanging amide protons using chemical exchange rotation transfer. Magnetic Resonance in Medicine 2013;69(3):637–647. [DOI] [PMC free article] [PubMed] [Google Scholar]
- 28.Zu Z, Janve VA, Li K, Does MD, Gore JC, Gochberg DF. Multi-angle ratiometric approach to measure chemical exchange in amide proton transfer imaging. Magnetic Resonance in Medicine 2012;68(3):711–719. [DOI] [PMC free article] [PubMed] [Google Scholar]
- 29.Zu ZL, Xu JZ, Li H, Chekmenev EY, Quarles CC, Does MD, Gore JC, Gochberg DF. Imaging Amide Proton Transfer and Nuclear Overhauser Enhancement Using Chemical Exchange Rotation Transfer (CERT). Magnetic Resonance In Medicine 2014;72(2):471–476. [DOI] [PMC free article] [PubMed] [Google Scholar]
- 30.Zu ZL, Louie EA, Lin EC, Jiang XY, Does MD, Gore JC, Gochberg DF. Chemical exchange rotation transfer imaging of intermediate-exchanging amines at 2 ppm. NMR in biomedicine 2017;30(10). [DOI] [PMC free article] [PubMed] [Google Scholar]
- 31.Zu ZL, Li H, Xu JZ, Zhang XY, Zaiss M, Li K, Does MD, Gore JC, Gochberg DF. Measurement of APT using a combined CERT-AREX approach with varying duty cycles. Magn Reson Imaging 2017;42:22–31. [DOI] [PMC free article] [PubMed] [Google Scholar]
- 32.Zu Z, Lin EC, Louie EA, Jiang X, Lankford CL, Damon B, Does MD, Gore JC, Gochberg DF. Chemical exchange rotation transfer imaging of phosphocreatine in muscle. NMR in biomedicine 2020:e4437. [DOI] [PMC free article] [PubMed] [Google Scholar]
- 33.Xu JD, Chan KWY, Xu X, Yadav N, Liu GS, van Zijl PCM. On-resonance variable delay multipulse scheme for imaging of fast-exchanging protons and semisolid macromolecules. Magnetic Resonance In Medicine 2017;77(2):730–739. [DOI] [PMC free article] [PubMed] [Google Scholar]
- 34.Chen L, Xu X, Zeng HF, Chan KWY, Yadav N, Cai SH, Schunke KJ, Faraday N, van Zijl PCM, Xu JD. Separating fast and slow exchange transfer and magnetization transfer using off-resonance variable-delay multiple-pulse (VDMP) MRI. Magnetic Resonance In Medicine 2018;80(4):1568–1576. [DOI] [PMC free article] [PubMed] [Google Scholar]
- 35.Jones CK, Huang A, Xu JD, Edden RAE, Schar M, Hua J, Oskolkov N, Zaca D, Zhou JY, McMahon MT, Pillai JJ, van Zijl PCM. Nuclear Overhauser enhancement (NOE) imaging in the human brain at 7 T. Neuroimage 2013;77:114–124. [DOI] [PMC free article] [PubMed] [Google Scholar]
- 36.Zaiss M, Kunz P, Goerke S, Radbruch A, Bachert P. MR imaging of protein folding in vitro employing Nuclear-Overhauser-mediated saturation transfer. NMR in biomedicine 2013;26(12):1815–1822. [DOI] [PubMed] [Google Scholar]
- 37.Paech D, Zaiss M, Meissner JE, Windschuh J, Wiestler B, Bachert P, Neumann JO, Kickingereder P, Schlemmer HP, Wick W, Nagel AM, Heiland S, Ladd ME, Bendszus M, Radbruch A. Nuclear Overhauser Enhancement Mediated Chemical Exchange Saturation Transfer Imaging at 7 Tesla in Glioblastoma Patients. Plos One 2014;9(8). [DOI] [PMC free article] [PubMed] [Google Scholar]
- 38.Mehrabian H, Desmond KL, Soliman H, Sahgal A, Stanisz GJ. Differentiation between Radiation Necrosis and Tumor Progression Using Chemical Exchange Saturation Transfer. Clin Cancer Res 2017;23(14):3667–3675. [DOI] [PubMed] [Google Scholar]
- 39.Tang XY, Dai ZZ, Xiao G, Yan G, Shen ZW, Zhang T, Zhang GS, Zhuang ZR, Shen YY, Zhang ZY, Hu W, Wu RH. Nuclear Overhauser Enhancement-Mediated Magnetization Transfer Imaging in Glioma with Different Progression at 7 T. Acs Chem Neurosci 2017;8(1):60–66. [DOI] [PubMed] [Google Scholar]
- 40.Lee DH, Heo HY, Zhang K, Zhang Y, Jiang SS, Zhao XN, Zhou JY. Quantitative assessment of the effects of water proton concentration and water T-1 changes on amide proton transfer (APT) and nuclear overhauser enhancement (NOE) MRI: The origin of the APT imaging signal in brain tumor. Magnetic Resonance In Medicine 2017;77(2):855–863. [DOI] [PMC free article] [PubMed] [Google Scholar]
- 41.Wu YL, Wood TC, Arzanforoosh F, Hernandez-Tamames JA, Barker GJ, Smits M, Warnert EA. 3D APT and NOE CEST-MRI of healthy volunteers and patients with non-enhancing glioma at 3 T. Magn Reson Mater Phy 2022;35(1):63–73. [DOI] [PMC free article] [PubMed] [Google Scholar]
- 42.Jiang SS, Rui QH, Wang Y, Heo HY, Zou TY, Yu H, Zhang Y, Wang XL, Du YX, Wen XR, Chen FY, Wang JH, Eberhart CG, Zhou JY, Wen ZB. Discriminating MGMT promoter methylation status in patients with glioblastoma employing amide proton transfer-weighted MRI metrics. Eur Radiol 2018;28(5):2115–2123. [DOI] [PMC free article] [PubMed] [Google Scholar]
- 43.Jiang SS, Zou TY, Eberhart CG, Villalobos MAV, Heo HY, Zhang Y, Wang Y, Wang XL, Yu H, Du YX, van Zijl PCM, Wen ZB, Zhou JY. Predicting IDH mutation status in grade II gliomas using amide proton transfer-weighted (APTw) MRI. Magnetic Resonance In Medicine 2017;78(3):1100–1109. [DOI] [PMC free article] [PubMed] [Google Scholar]
- 44.Jiang SS, Eberhart CG, Zhang Y, Heo HY, Wen ZB, Blair L, Qin HM, Lim M, Quinones-Hinojosa A, Weingart JD, Barker PB, Pomper MG, Laterra J, van Zijl PCM, Blakeley JO, Zhou JY. Amide proton transfer-weighted magnetic resonance image-guided stereotactic biopsy in patients with newly diagnosed gliomas. Eur J Cancer 2017;83:9–18. [DOI] [PMC free article] [PubMed] [Google Scholar]
- 45.Jiang SS, Eberhart CG, Lim M, Heo HY, Zhang Y, Blair L, Wen ZB, Holdhoff M, Lin D, Huang P, Qin HM, Quinones-Hinojosa A, Weingart JD, Barker PB, Pomper MG, Laterra J, van Zijl PCM, Blakeley JO, Zhou JY. Identifying Recurrent Malignant Glioma after Treatment Using Amide Proton Transfer-Weighted MR Imaging: A Validation Study with Image-Guided Stereotactic Biopsy. Clin Cancer Res 2019;25(2):552–561. [DOI] [PMC free article] [PubMed] [Google Scholar]
- 46.Yu H, Wen XR, Wu PP, Chen YQ, Zou TY, Wang XL, Jiang SS, Zhou JY, Wen ZB. Can amide proton transfer-weighted imaging differentiate tumor grade and predict Ki-67 proliferation status of meningioma? Eur Radiol 2019;29(10):5298–5306. [DOI] [PMC free article] [PubMed] [Google Scholar]
- 47.Zaiss M, Bachert P. Chemical exchange saturation transfer (CEST) and MR Z-spectroscopy in vivo: a review of theoretical approaches and methods. Physics in medicine and biology 2013;58(22):R221–269. [DOI] [PubMed] [Google Scholar]
- 48.Zhang XY, Wang F, Li H, Xu JZ, Gochberg DF, Gore JC, Zu ZL. Accuracy in the quantification of chemical exchange saturation transfer (CEST) and relayed nuclear Overhauser enhancement (rNOE) saturation transfer effects. NMR in biomedicine 2017;30(7). [DOI] [PMC free article] [PubMed] [Google Scholar]
- 49.Zhang XY, Wang F, Jin T, Xu JZ, Xie JP, Gochberg DF, Gore JC, Zu ZL. MR imaging of a novel NOE-mediated magnetization transfer with water in rat brain at 9.4 T. Magnetic Resonance in Medicine 2017;78(2):588–597. [DOI] [PMC free article] [PubMed] [Google Scholar]
- 50.Gochberg DF, Gore JC. Quantitative magnetization transfer imaging via selective inversion recovery with short repetition times. Magnetic Resonance In Medicine 2007;57(2):437–441. [DOI] [PMC free article] [PubMed] [Google Scholar]
- 51.Zhang XY, Wang F, Afzal A, Xu JZ, Gore JC, Gochberg DF, Zu ZL. A new NOE-mediated MT signal at around-1.6 ppm for detecting ischemic stroke in rat brain. Magn Reson Imaging 2016;34(8):1100–1106. [DOI] [PMC free article] [PubMed] [Google Scholar]
- 52.Zu ZL. Ratiometric NOE(−1.6) contrast in brain tumors. NMR in biomedicine 2018;31(12). [DOI] [PubMed] [Google Scholar]
- 53.Zu ZL. Toward more reliable measurements of NOE effects in CEST spectra at around-1.6 ppm (NOE (−1.6)) in rat brain. Magnetic Resonance In Medicine 2019;81(1):208–219. [DOI] [PMC free article] [PubMed] [Google Scholar]
- 54.Zu ZL, Lin EC, Louie EA, Xu JZ, Li H, Xie JP, Lankford CL, Chekmenev EY, Swanson SD, Does MD, Gore JC, Gochberg DF. Relayed nuclear Overhauser enhancement sensitivity to membrane Cho phospholipids. Magnetic Resonance In Medicine 2020;84(4):1961–1976. [DOI] [PMC free article] [PubMed] [Google Scholar]
- 55.Cui J, Zhao Y, Wang F, Gochberg DF, Zu ZL. Contribution of blood to nuclear Overhauser effect at-1.6 ppm. Magnetic Resonance In Medicine 2022;87(1):409–416. [DOI] [PMC free article] [PubMed] [Google Scholar]
- 56.Windschuh J, Zaiss M, Meissner JE, Paech D, Radbruch A, Ladd ME, Bachert P. Correction of B1-inhomogeneities for relaxation-compensated CEST imaging at 7T. Nmr in Biomedicine 2015;28(5):529–537. [DOI] [PubMed] [Google Scholar]
- 57.Zhou JY, Zaiss M, Knutsson L, Sun PZ, Ahn SS, Aime S, Bachert P, Blakeley JO, Cai KJ, Chappell MA, Chen M, Gochberg DF, Goerke S, Heo HY, Jiang SS, Jin T, Kim SG, Laterra J, Paech D, Pagel MD, Park JE, Reddy R, Sakata A, Sartoretti-Schefer S, Sherry AD, Smith SA, Stanisz GJ, Sundgren PC, Togao O, Vandsburger M, Wen ZB, Wu Y, Zhang Y, Zhu WZ, Zu ZL, van Zijl PCM. Review and consensus recommendations on clinical APT-weighted imaging approaches at 3T: Application to brain tumors. Magnetic Resonance In Medicine 2022;88(2):546–574. [DOI] [PMC free article] [PubMed] [Google Scholar]
- 58.Cohen O, Huang SN, McMahon MT, Rosen MS, Farrar CT. Rapid and quantitative chemical exchange saturation transfer (CEST) imaging with magnetic resonance fingerprinting (MRF). Magnetic Resonance In Medicine 2018;80(6):2449–2463. [DOI] [PMC free article] [PubMed] [Google Scholar]
- 59.Perlman O, Ito H, Herz K, Shono N, Nakashima H, Zaiss M, Chiocca EA, Cohen O, Rosen MS, Farrar CT. Quantitative imaging of apoptosis following oncolytic virotherapy by magnetic resonance fingerprinting aided by deep learning. Nat Biomed Eng 2022;6(5):648–657. [DOI] [PMC free article] [PubMed] [Google Scholar]
- 60.Kim B, Schar M, Park H, Heo HY. A deep learning approach for magnetization transfer contrast MR fingerprinting and chemical exchange saturation transfer imaging. Neuroimage 2020;221. [DOI] [PubMed] [Google Scholar]
- 61.Perlman O, Farrar CT, Heo HY. MR fingerprinting for semisolid magnetization transfer and chemical exchange saturation transfer quantification. NMR in biomedicine 2022. [DOI] [PMC free article] [PubMed] [Google Scholar]
- 62.Zhang XY, Wang F, Xu JZ, Gochberg DF, Gore JC, Zu ZL. Increased CEST specificity for amide and fast-exchanging amine protons using exchange-dependent relaxation rate. NMR in biomedicine 2018;31(2). [DOI] [PMC free article] [PubMed] [Google Scholar]
- 63.Zhou JY, Lal B, Wilson DA, Laterra J, van Zijl PCM. Amide proton transfer (APT) contrast for imaging of brain tumors. Magnetic Resonance In Medicine 2003;50(6):1120–1126. [DOI] [PubMed] [Google Scholar]
- 64.Zaiss M, Xu J, Goerke S, Khan IS, Singer RJ, Gore JC, Gochberg DF, Bachert P. Inverse Z-spectrum analysis for spillover-, MT-, and T1 -corrected steady-state pulsed CEST-MRI--application to pH-weighted MRI of acute stroke. NMR in biomedicine 2014;27(3):240–252. [DOI] [PMC free article] [PubMed] [Google Scholar]
- 65.O'Grady KP, Satish S, Owen QR, Box BA, Bagnato F, Combes AJE, Cook SR, Westervelt HJ, Feiler HR, Lawless RD, Sarma A, Malone SD, Ndolo JM, Yoon K, Dortch RD, Rogers BP, Smith SA. Relaxation-Compensated Chemical Exchange Saturation Transfer MRI in the Brain at 7T: Application in Relapsing-Remitting Multiple Sclerosis. Front Neurol 2022;13. [DOI] [PMC free article] [PubMed] [Google Scholar]
- 66.Zimmermann F, Korzowski A, Breitling J, Meissner JE, Schuenke P, Loi L, Zaiss M, Bickelhaupt S, Schott S, Schlemmer HP, Paech D, Ladd ME, Bachert P, Goerke S. A novel normalization for amide proton transfer CEST MRI to correct for fat signal-induced artifacts: application to human breast cancer imaging. Magnetic Resonance In Medicine 2020;83(3):920–934. [DOI] [PubMed] [Google Scholar]
- 67.Kleimaier D, Goerke S, Nies C, Zaiss M, Kunz P, Bachert P, Ladd ME, Gottwald E, Schad LR. The cellular heat shock response monitored by chemical exchange saturation transfer MRI. Scientific reports 2020;10(1). [DOI] [PMC free article] [PubMed] [Google Scholar]
Associated Data
This section collects any data citations, data availability statements, or supplementary materials included in this article.


