

Abstract
Background
Prior studies suggest that sedentary behavior is a well-known risk factor for cardiometabolic diseases. However, the longitudinal association between overall siting time and kidney function decline is not known.
Material/Methods
We performed a nationwide prospective cohort study in individuals aged more than 40 years enrolled in the China Cardiometabolic Disease and Cancer Cohort (4C) study. A total of 132 123 individuals were included in this study. Sitting time was measured with the short version of the International Physical Activity Questionnaire (IPAQ). Kidney function decline was defined as an eGFR <60 mL/min/1.73 m2 or more than a 30% decrease in eGFR from baseline. Multivariate Cox proportional hazards regression analyses were conducted to estimate the adjusted hazard ratios (aHRs) and 95% confidence intervals (CIs) of the relation between kidney function decline and sitting time.
Results
During a mean follow-up of 3.8 years, 3890 (2.9%) participants experienced kidney function decline. Longer sitting time was significantly associated with the risk of kidney function decline (aHR, 1.136; 95% CI, 1.036–1.247, P=0.007, comparing participants with baseline sitting time in the lowest quartile with those in the highest quartile) after adjustment for potential confounders.
Conclusions
Longer sitting time was independently and prospectively associated with a higher risk of kidney function decline. Sedentary behavior might represent a modifiable risk factor for chronic kidney disease (CKD) prevention.
Keywords: Sedentary Behavior; Kidney Failure, Chronic; Cohort Studies
Background
CKD is defined as a chronic reduction in kidney function owing to irreversible kidney structural or functional damage, manifested as a glomerular filtration rate (GFR) of less than 60 ml/min per 1.73 m2 or an increase in urine protein excretion (albuminuria) of at least 3 months [1]. In addition to the risk of progression into end-stage kidney disease (ESKD) that requires dialysis treatments or kidney transplantation to support life, CKD patients are at increased risk of cardiovascular events [2], affecting morbidity and mortality caused by cardiovascular disease [3].
CKD arises from an extremely heterogeneous group of conditions, including lifestyle-related cardiometabolic abnormalities (such as obesity, dyslipidemia, and diabetes), glomerulonephritis, and nephrotoxic drugs/chemicals. It is important to note that lifestyle-related diseases such as hypertension, diabetes mellitus, and obesity are the main causes in all developed countries and in many developing countries [4]. Currently, the mean global prevalence of CKD is 9.1% [5], which reminds us of the challenge we are facing. Moreover, with the change in the disease spectrum and the growth of lifestyle-related diseases under socioeconomic development accompanied by population aging, the incidence of CKD will steadily increase [6,7].
Under these circumstances, identifying modifiable risk factors for CKD is a global priority. Sedentary behavior, defined as activities that involve energy expenditure less than 1.5 metabolic equivalent units (METs), such as sitting, lying down, and watching television [8], is a well-known modifiable risk factor in lifestyle-related cardiometabolic diseases prevention. Owing to the pathophysiologic role of cardiometabolic factors in CKD development, the relationship between extended sedentary time and CKD has also been evaluated in several studies, showing a significant positive association, even independent of the level of physical activity. However, most of these studies were cross-sectional [9–15], and the causation between CKD and sedentary behavior has not been established. Inconsistent results were reported in prospective analyses [16–18], as they were performed in special groups and used different measures of sedentary behavior. Given the variety of study designs on this topic and the variability in the findings reported, a large-scale longitudinal study in the general population is needed. In the current study, we aimed to investigate whether longer sitting time can contribute to the risk of kidney function decline in individuals with a baseline eGFR greater than 60 mL/min/1.73 m2. The results from our study may provide a better understanding of sedentary behavior in the development of CKD and assist in refining clinical and public health strategies for the prevention of CKD.
Material and Methods
Study Sample
This study used the data from the 4C study, a nationally representative sample of Chinese adults aged more than 40 years. The aim of the 4C study was to investigate the associations among lifestyle and metabolic factors with clinical outcomes, including diabetes, cardiovascular disease (CVD), cancer, and all-cause mortality. Details of the study design have been described previously [19,20]. In brief, at baseline, 193 846 subjects from 16 provinces of China were recruited in 2010–2011. The follow-up study was conducted in 2014–2016, and 170 240 individuals completed the survey. Informed consent was obtained from each study participant. The study protocol was approved by the Medical Ethics Committee of Ruijin Hospital, Shanghai Jiao Tong University.
Participants were excluded if they had glomerulonephritis, nephrotic syndrome, or eGFR less than 60 ml/min per 1.73 m2 at baseline; if they had missing values for sitting time; or if they did not have eGFR measures at follow-up. Finally, 132 123 individuals with complete data on exposure variables, outcome variables, and covariates were included in this study (Supplementary Figure 1).
Measures
Participants reported their sitting time in standardized, face-to-face interviews. The short version of the International Physical Activity Questionnaire (IPAQ) was used (the IPAQ is provided in Supplementary Material 1). The participants were asked about the “time spent sitting on a weekday and weekend day, during the last 7 days, including at work and at leisure time”. The total weekly sitting hours was calculated as follows: total sitting time (hours/week)=weekday sitting hours×5+weekend sitting hours×2.
Baseline demographic characteristics, lifestyle behaviors, and medical history data were collected by trained staff through a standardized questionnaire. Current smoking was defined as participants who smoked at least 7 cigarettes per week for at least 6 months. Current alcohol consumption was defined as participants who consumed alcohol at least once a week for at least 6 months. The types, frequency, and duration of physical activity were collected by using the short version of the IPAQ. Moderate-to-vigorous physical activity (MVPA) was calculated by summing the weekly time spent performing moderate-intensity and vigorous-intensity activities. Height and weight were measured without shoes and in light clothing. Body mass index (BMI) was calculated as weight in kilograms (Kg) divided by the square of height in meters (m2). Blood pressure was measured at the right brachial artery with the subject in the sitting position after 5 min of rest, the measurement was repeated 2 times, and the average value was calculated as the final result. Participants were classified as hypertensive if systolic blood pressure was ≥140 mmHg, or diastolic blood pressure was ≥90 mmHg, or the participant self-reported use of antihypertensive medications.
Blood samples were collected form each participant after overnight fasting. At the same time, a standard oral glucose tolerance test (OGTT) was also performed. Plasma glucose concentrations were measured with the glucose oxidase or the hexokinase method. HbA1c was determined by using the high-performance liquid chromatography. Serum creatinine, total cholesterol, LDL cholesterol, HDL cholesterol, and triglycerides were measured by using an automatic biochemical analyzer. The estimated glomerular filtration rate (eGFR) was calculated by using the CKD-EPI formula [21]. Diabetes was defined as a self-reported previous diagnosis of diabetes, or fasting plasma glucose level ≥7.0 mmol/L, or OGTT 2-h post-load plasma glucose level ≥11.1 mmol/L, or HbA1c ≥6.5% [22]. Dyslipidemia was defined as triglycerides ≥2.26 mmol/L, total cholesterol ≥6.22 mmol/L, LDL-C ≥4.14 mmol/L, HDL-C <1.04 mmol/L, or taking lipid-lowering medications [23].
Outcome
The main outcome of this study was kidney function decline, which was defined as eGFR <60 mL/min/1.73 m2 at follow-up or a greater than 30% decrease in eGFR from baseline [24]. Hospitalization or death caused by CKD or the presence of end-stage kidney disease were also considered as development of the outcome. We chose this definition for the following reasons: (1) A threshold for clinical action of an eGFR less than 60 mL/min/1.73 m2 was independently associated with increased mortality and kidney failure in the general population and in populations with increased cardiovascular risk [2,25]. (2) A 30% decline over 1–3 years was strongly associated with the risk of end-stage kidney disease in individuals with a baseline eGFR <60 or >60 mL/min/1.73 m2 [26].
Statistical Analysis
Symmetrically distributed continuous variables were expressed as the mean±SD, and variables with a skewed distribution were presented as the median and interquartile interval (IQI). Categorical variables were expressed as frequencies. Participant baseline characteristics between groups were compared using ANOVA or the t test for symmetrically distributed continuous variables, Kruskal-Wallis test for variables with a skewed distribution, and Mantel-Haenszel chi-square test for categorical variables. To prospectively assess the relationship between sitting time and incident kidney function decline, Cox proportional hazards regression analyses were conducted to estimate the crude HR (cHR) and adjusted HR (aHR) and 95% CI of the risk of kidney function decline. Crude and multivariate models were performed, and sitting time was entered into the regression models in quartiles. For multivariate models, adjustments were made for age, sex, current smoking, current drinking, BMI, hypertension, diabetes, dyslipidemia, and MVPA. The significance of linear trends across quartiles of sitting time was evaluated by using the median value for each quartile of sitting time analyzed as a continuous variable in Cox regression models. The potential non-linear dose–response relationship of sitting time and the risk of kidney function decline was assessed by restricted cubic splines based on Cox proportional hazards models with 3 knots at fixed centiles (5%, 50%, and 95%) of the distribution. The 5th percentile of the sedentary time distribution was set as the referent category. P values for nonlinearity were calculated by using a likelihood ratio test comparing the model with only a linear term of sedentary time against the model with both the linear and cubic spline terms.
In addition, we evaluated the associations of sitting time with risks of kidney function decline in individuals with different levels of physical activity; we divided the participants into 2 groups according to whether they reached the current physical activity recommendations (MVPA ≥150 min/week).
Prespecified subgroup analyses were conducted within strata of age, sex, current smoking, current drinking, BMI category, hypertension status, diabetes status, dyslipidemia status, and baseline eGFR.
Finally, we conducted several sensitivity analyses. First, to check for reverse causality or potential residual confounding, we excluded participants with cancer, cardiovascular diseases, stroke, chronic respiratory diseases, or liver cirrhosis at baseline and reanalyzed the association. Second, as there were data missing for current smoking (missing rate 1.73%), current drinking (missing rate 2.80%), BMI (missing rate 1.39%), and MVPA (missing rate 5.25%), we imputed the missing values by median for quantitative variables and by mode for qualitative variables and then reanalyzed the association. Third, we used eGFR <60 mL/min/1.73 m2 as the primary endpoint to exam the association between sitting time and kidney function decline. In this analysis, the outcome was defined as incident eGFR less than 60 mL/min/1.73 m2 with a rate of decline more than 1 mL/min/1.73 m2 per year, hospitalization or death caused by CKD, or the presence of end-stage kidney disease. Fourth, we used eGFR decreased by more than 30% from baseline as the primary endpoint to exam the association between sitting time and kidney function decline. In this analysis, the outcome was defined as eGFR decreased more than 30% from baseline, hospitalization or death caused by CKD, or the presence of end-stage kidney disease.
Statistical analyses were done using R version 3.4.2. A two-tailed P value less than 0.05 was considered statistically significant.
Results
Participant Characteristics
A total of 132 123 individuals were included in this study. The baseline characteristics of the participants by quartiles of sitting time are shown in Table 1. The mean (SD) sedentary time was 29.0 [16.4] h/week and the mean age was 56.6 years [9.0]. Among the participants, individuals with longer sitting times were slightly younger, more likely to be current smokers, and had higher prevalence of dyslipidemia but a lower prevalence of hypertension. Differences existed in body mass index and the prevalence of diabetes across sitting time quartiles, but were not obvious.
Table 1.
Baseline characteristics of the study participants according to quartiles of sitting time.
| Full cohort | Quartile 1 (n=32947) | Quartile 2 (n=27162) | Quartile 3 (n=37810) | Quartile 4 (n=34204) | P value | |
|---|---|---|---|---|---|---|
| Age, years | 56.64±9.01 | 57.25±8.98 | 57.02±8.86 | 56.92±8.89 | 55.44±9.18 | <0.001 |
| Female (%) | 86321 (65.3) | 21552 (65.4) | 17937 (66.0) | 25088 (66.4) | 21744 (63.6) | <0.001 |
| Current smoking (%) | 19940 (15.4) | 4541 (13.8) | 3886 (14.3) | 5584 (14.8) | 5929 (17.3) | <0.001 |
| Current drinking (%) | 13988 (10.9) | 3723 (11.3) | 2787 (10.3) | 3758 (9.9) | 3720 (10.9) | <0.001 |
| MVPA (hour/week) | 1.40±4.98 | 1.62±6.29 | 1.30±4.70 | 1.38±4.46 | 1.28±4.28 | <0.001 |
| BMI (kg/m2) | 24.64±3.61 | 24.51±3.71 | 24.65±3.55 | 24.70±3.55 | 24.70±3.65 | <0.001 |
| WC (cm) | 84.01±9.83 | 83.44±9.93 | 83.83±9.85 | 84.31±9.77 | 83.37±9.77 | <0.001 |
| SBP (mmHg) | 133.2±20.76 | 135.60±21.48 | 134.29±20.77 | 132.85±20.39 | 130.27±20.08 | <0.001 |
| DBP (mmHg) | 78.51±11.14 | 78.85±11.27 | 78.58±11.14 | 78.50±11.03 | 78.13±11.12 | <0.001 |
| FPG (mmol/L) | 5.95±1.61 | 5.94±1.59 | 5.95±1.60 | 5.98±1.63 | 5.94±1.62 | 0.003 |
| 2hPG (mmol/L) | 8.24±3.82 | 8.10±3.81 | 8.24±3.85 | 8.34±3.84 | 8.25±3.76 | <0.001 |
| HbA1c (%) | 6.01±1.01 | 6.00±1.01 | 6.00±1.00 | 6.02±1.02 | 6.00±1.01 | 0.154 |
| TC (mmol/L) | 4.96±1.14 | 4.93±1.13 | 4.99±1.13 | 4.99±1.13 | 4.92±1.16 | <0.001 |
| TG (mmol/L) | 1.32 (0.93–1.91) | 1.25 (0.89–1.82) | 1.30 (0.92–1.90) | 1.34 (0.96–1.94) | 1.37 (0.96–1.99) | <0.001 |
| HDL-C (mmol/L) | 1.34±0.36 | 1.37±0.37 | 1.35±0.37 | 1.33±0.36 | 1.30±0.35 | <0.001 |
| LDL-C (mmol/L) | 2.88±0.88 | 2.84±0.87 | 2.89±0.87 | 2.91±0.88 | 2.87±0.89 | <0.001 |
| Cr (μmol/L) | 65.73±12.15 | 64.54±11.60 | 65.59±11.91 | 66.05±12.17 | 66.63±12.72 | <0.001 |
| eGFR (mL/min/1.73 m2) | 95.23±11.90 | 95.91±11.45 | 95.02±11.70 | 94.58±11.94 | 95.48±12.38 | <0.001 |
| Prevalence of hypertension (%) | 59174 (44.8) | 15639 (47.5) | 12501 (46.0) | 17098 (45.2) | 13936 (40.7) | <0.001 |
| Prevalence of diabetes (%) | 30689 (23.2) | 7444 (22.6) | 6318 (23.3) | 9036 (23.9) | 7891 (23.1) | <0.001 |
| Prevalence of dyslipidemia (%) | 56346 (42.7) | 12879 (39.1) | 11360 (41.8) | 16470 (43.6) | 15637 (45.7) | <0.001 |
Continuous variables are expressed as the mean (standard deviation) or median (IQR), and categorical variables are expressed as the number (percentage). Quartiles of sitting time: 1st quartile ≤17.4 h/week, 2nd quartile=17.5–27.9 h/week, 3rd quartile=28.0–36.9 h/week, 4th quartile ≥37 h/week. eGFR – estimated glomerular filtration rate; MVPA – moderate or vigorous intensity physical activity; BMI – body mass index; WC – waist circumference; SBP – systolic blood pressure; DBP – diastolic blood pressure; FPG – fasting blood glucose; 2hPG – 2 hours postprandial blood glucose; TG – triglycerides; TC – total cholesterol; HDL-C – high-density lipoprotein cholesterol; LDL-C – low-density lipoprotein cholesterol; Cr – creatinine.
Sitting Time and Kidney Function Decline
After an average of 3.8 years of follow-up, 3890 cases of incident kidney function decline were identified, corresponding to an incidence rate of 8.07 per 1000 person-years. The characteristics of the study population according to the incidence of kidney function decline are shown in Supplementary Table 1. Individuals who developed kidney function decline had longer sitting times at baseline. In multivariate Cox regression analyses (Table 2), after adjusting for potential confounders, including age, sex, current smoking, current drinking, BMI, hypertension, diabetes, dyslipidemia, and MVPA, individuals with sitting time in the highest quartile had an increased risk for kidney function decline compared with those in the lowest quartile (aHR 1.136, 95% CI, 1.036 to 1.247). However, the risk for individuals with sitting time in the second (aHR 1.002, 95% CI, 0.906 to 1.109) and third (aHR 1.085, 95% CI, 0.990 to 1.189) quartiles was not statistically significant compared with those in the lowest quartile. We next assessed the dose–response relationship of sitting time with kidney function decline by using restricted cubic splines (Figure 1), which suggested a non-linear association of sitting time with incident kidney function decline (P for nonlinearity <0.001). The risk was not significant until sitting time reached approximately 40 h/week.
Table 2.
Association between sitting time and kidney function decline (n=132 123).
| Quartile 1 (n=32 947) | Quartile 2 (n=27 162) | Quartile 3 (n=37 810) | Quartile 4 (n=34 204) | P for trend | |
|---|---|---|---|---|---|
| Cases | 894 (2.7%) | 767 (2.8%) | 1153 (3.1%) | 1076 (3.2%) | 0.003 |
| Model 1 | 1 | 1.013 (0.920–1.116) | 1.079 (0.989–1.177) | 1.052 (0.963–1.150) | 0.137 |
| Model 2 | 1 | 1.020 (0.925–1.126) | 1.101 (1.007–1.203) | 1.159 (1.058–1.268) | <0.001 |
| Model 3 | 1 | 1.002 (0.906–1.109) | 1.085 (0.990–1.189) | 1.136 (1.036–1.247) | 0.002 |
Quartiles of sitting time: 1st quartile ≤17.4 h/week, 2nd quartile=17.5–27.9 h/week, 3rd quartile=28.0–36.9 h/week, 4th quartile ≥37 h/week. Model 1: Crude HR. Model 2: Adjusted for age, sex, current smoking, current drinking. Model 3: Adjusted for covariates in Model 2 plus BMI, hypertension, diabetes, dyslipidemia and MVPA. HR – hazard ratio; CI – confidence interval.
Figure 1.

Restricted cubic spline plot of the association between sitting time and incident kidney function decline. Adjusted for age, sex, current smoking, current drinking, BMI, hypertension, diabetes, dyslipidemia, and MVPA. Solid lines are multivariable adjusted hazard ratios, and dashed lines represent 95% confidence intervals. Created using R version 3.4.2.
Sitting Time, MVPA, and Kidney Function Decline
The effects of sitting time across different MVPA levels on the risk of kidney function decline are shown in Figure 2. For individuals who did not reach MVPA recommendations (<150 min/week, n=115 556), compared to those in the lowest quartile of sitting time, individuals in the highest quartile had significantly higher risk of kidney function decline (aHR 1.125, 95% CI, 1.020 to 1.242). For individuals who met the recommended levels of MVPA (≥150 min/week, n=16 567), the association was still statistically significant (aHR 1.326, 95% CI, 1.043 to 1.687), which indicated that the association between long sitting time and kidney function decline was not affected by level of physical activity (P for interaction=0.194).
Figure 2.
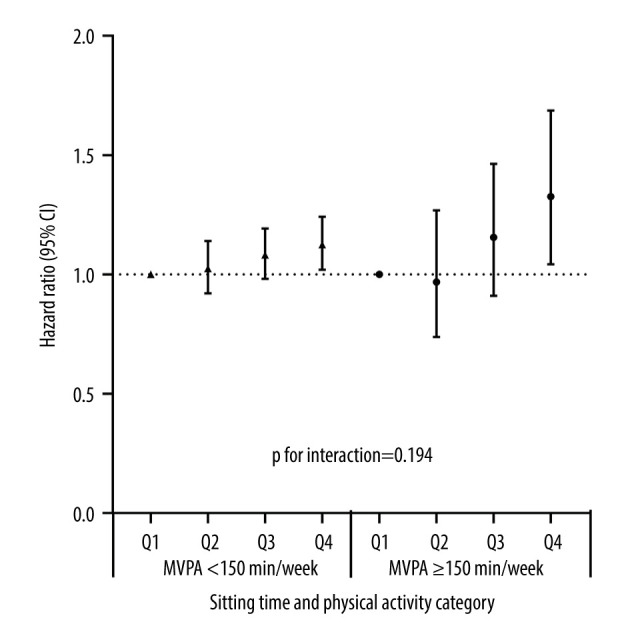
The associations among sitting time, physical activity, and kidney function decline. Adjusted for age, sex, current smoking, current drinking, BMI, hypertension, diabetes, and dyslipidemia. Quartiles of sitting time: 1st quartile ≤17.4 h/week, 2nd quartile=17.5–27.9 h/week, 3rd quartile=28.0–36.9 h/week, and 4th quartile ≥37 h/week. CI – confidence interval; MVPA – moderate or vigorous-intensity physical activity. Created using R version 3.4.2.
Stratified Analysis
Significant interactions were found between sitting time and risk of kidney function decline by age, hypertension, and dyslipidemia (all P value for interaction <0.05). The association appeared to be stronger among those aged over 60 years than younger individuals, stronger among those without hypertension than hypertensive individuals, and stronger among those with dyslipidemia than those without. We found no significant interaction of sedentary time with sex, current drinking status, current smoking status, BMI, diabetes status, or baseline eGFR (Figure 3).
Figure 3.

Subgroup analyses for the association between sitting time and kidney function decline. Hazard ratios for risk of incident kidney function decline are for the comparison of individuals with sitting time in the highest quartile with those in the lowest quartile, stratified by age group (<60 and ≥60 years), sex (male and female), BMI category (<24 and ≥24), current smoking (yes or no), current drinking (yes or no), hypertension (yes or no), diabetes (yes or no), dyslipidemia (yes or no) and baseline eGFR (60–74, 75–89, ≥90 mL/min/1.73 m2). The Cox models were adjusted for age, sex, current smoking, current drinking, BMI, hypertension, diabetes, dyslipidemia, and MVPA, except for the stratifying factor. BMI – body mass index; HR – hazard ratio; CI – confidence interval. Created using R version 3.4.2.
Sensitivity Analysis
In the first sensitivity analysis, after excluding participants with a history of cancer, cardiovascular diseases, stroke, chronic respiratory diseases, or liver cirrhosis at baseline, the results were still consistent with the primary results (Supplementary Table 2). In the second sensitivity analysis, after missing data of the covariates were imputed using a simple imputation method, the results were also qualitatively similar to the primary results (Supplementary Table 3). In the third sensitivity analysis, the outcome was defined as incident eGFR less than 60 mL/min/1.73 m2 and a rate of decline more than 1 mL/min/1.73 m2 per year, hospitalization or death caused by CKD, or the presence of end-stage kidney disease. We found individuals with sitting time in the highest quartile had an increased risk for the outcome compared with those in the lowest quartile (aHR 1.138, 95% CI, 1.015 to 1.277) (Supplementary Table 4). In the fourth sensitivity analysis, the outcome was defined as eGFR decreased more than 30% form baseline, hospitalization or death caused by CKD, or the presence of end-stage kidney disease. We found individuals with sitting time in the highest quartile did not have increased risk for the outcome when compare with those in the first, second, and third quartile (P for trend >0.05) (Supplementary Table 5).
Discussion
In this nationwide cohort study of individuals aged more than 40 years, we found an independent relationship between sedentary time and kidney function decline. Moreover, the association was non-linear, and the increased risk for kidney function decline was statistically significant only at a sitting time longer than approximately 40 h per week. Our findings highlight the deleterious role of sedentary behavior in the pathogenesis of CKD.
Inconsistent results have been reported in previous longitudinal studies examining associations between sedentary behavior and CKD. Two studies used TV viewing time, a surrogate measure of sedentary behavior. The study by Lynch et al was conducted in Australian individuals aged more than 25 years. After adjusting for lifestyle behaviors and cardiometabolic factors, no statistically significant association was found between TV viewing time and CKD incidence defined by the presence of albuminuria or eGFR <60 mL/min/1.73 m2 [16]. Hawkins et al reported that in individuals ages 70–79 years, after adjusting for potential confounders, those who had the longest TV watching time had a greater risk of CKD than those with the shortest watching time [17]. Fujii et al also reported a positive result. Their study was performed in workers aged 20–64 years, subjects were categorized into a sedentary group or a non-sedentary group according to the main occupational activity, and a sedentary pattern was proved to be a significant independent predictor of albuminuria in males [18]. In our study, although we lacked data on albuminuria, we used both eGFR and CKD-related events (hospitalization, death, and ESKD) to define the outcome, which was a clinical endpoint and can give more information than using a surrogate endpoint (albuminuria). Moreover, our study was conducted in the Chinese population and thus makes important contributions to the literature, as previous studies were conducted in other ethnic groups.
In the main analysis, we used a composite outcome that included both eGFR <60 mL/min/1.73 m2 and eGFR decreased more than 30% from baseline. In sensitivity analysis, we explored the association between sitting time and these 2 endpoints separately. We found sitting time was positively associated with the risk of incident eGFR <60 mL/min/1.73 m2, but showed no association with eGFR decreased more than 30% from baseline, which indicates that the main effects come primarily from the former endpoint. Of note, the presence of the latter endpoint needs a certain period of time. In a study that included 1.7 million participants, only 2.3% of the participants showed a more than 30% decrease in eGFR within 3 years [24]. However, the average follow-up time of our study was only 3.8 years, which may have led to limited statistical power to detect the association between sitting time and eGFR decreased more than 30% from baseline. Thus, this association should be reevaluated with longer periods of follow-up.
In our study, we found that age (>60 years) was an important factor affecting the association between sitting time and kidney function decline. The subgroup analysis revealed that the relation between high levels of sitting time and the risk of kidney function decline was particularly pronounced in the elderly population. Of note, the nephron number declines with aging, accompanied by a comparable reduction in GFR [27], which means there is a gradual loss of kidney reserve capacity in elderly people. Given the close relationship between sedentary activities and age-related comorbidities such as diabetes, obesity, and cardiovascular diseases, prolonged sitting time would no doubt exacerbate CKD risk. In recent decades, with population aging, there has been a significant increase in the prevalence of CKD in elderly individuals. Thus, in the aging population who are at high risk for CKD, the risks of sedentary behavior should be emphasized, and interventions should be instituted to reduce overall sitting time.
Physical activity has long been considered a confounder or an effect modifier of sedentary behavior on health outcomes. In the current study, we set physical activity as a covariate in multivariate Cox models and revealed the independent effects of sitting time on the risk of kidney function decline. Moreover, in the subgroup analysis, when stratified by the level of MVPA, among individuals who spent more than 150 min per week on MVPA, the association between sitting time and kidney function decline was still statistically significant, which indicated that achieving currently recommended levels of physical activity may not fully mitigate the CKD risk associated with sedentary behavior. Thus, for the prevention of CKD, reduction in sedentary activities should be emphasized, regardless of whether the individual is physically active.
Our dose-response analysis showed a non-linear relationship between sitting time and kidney function decline. After adjustment for other CKD risk factors and physical activity, significant risk for kidney function decline was observed with long sitting times (>40 h/week). Similarly, previous studies revealed that the relationship between sedentary time and other endpoints such as CVD, cancer, and all-cause mortality were also non-linear [28,29]. In a meta-analysis exploring the dose-response association between sedentary time and risk for all-cause mortality, the increased risk was observed at sedentary times more than 7.5 h/day, which equal to 52 h/week [29]. Meanwhile, for CVD, the increased risk was observed at sedentary times more than 10.4 h/day, which equals 73 h/week [28]. Our study revealed that for the protection of kidney function, the time limit for sedentary behavior may be stricter.
The association between sedentary time and CKD has not been completely elucidated. In our study, individuals with a longer sedentary time tended to have a higher prevalence of obesity, dyslipidemia, and diabetes, which are traditional risk factors for kidney function decline [1]. Thus, these disorders seem to be crucial factors linking sedentary behavior and kidney function decline. After adjusting for these factors, an association still existed, and it is likely that sedentary behavior influences CKD risk through mechanisms that are distinct and independent of these factors. Based on the existing literature, we speculate there are 3 potential mechanisms. (1) By triggering endothelial dysfunction, prolonged sitting can markedly reduce micro- and macrovascular dilator function [30], which can lead to kidney hypoperfusion and cause kidney injury. (2) Being sedentary can lead to a decrease in systemic insulin sensitivity. Stephens et al assessed the acute effect of sitting on insulin sensitivity, and found that insulin action was decreased in the sitting group, even when the energy intake was reduced to match the low expenditure caused by sitting [31]. Insulin resistance is an independent risk factor for CKD [32], and excessive insulin can stimulate the proliferation of vascular smooth muscle cells and growth of mesangial cells, and promote the pathogenesis of kidney fibrosis [33]. (3) By promoting chronic systematic low-grade inflammation, individuals with longer sitting time have significantly higher serum levels of inflammatory markers such as fibrinogen and high-sensitivity CRP (hsCRP) [34]. Persistent low-grade inflammation can lead to kidney injury and facilitate the pathogenesis of CKD [35].
The strengths of our study include the prospective design, the use of a large nationally representative sample, and the measurement of overall sitting time. Moreover, we confirmed the robustness of our results by conducting sensitivity analyses. Potential reverse causality due to pre-existing noncommunicable diseases can have a significant influence on the association between sedentary lifestyle and health outcomes [36]. We excluded participants with major noncommunicable diseases in the sensitivity analysis, which lends additional credibility to our primary results.
Our study has several limitations. First, sitting time was self-reported and may be subject to recall bias and social desirability bias. Differences between reported and objective measured sedentary time can affect estimates of associations with disease outcomes by regression dilution [37]. Second, due to the nature of observational studies, residual confounding by unidentified confounders (such as disease medication, and dietary factors) is still possible, even though we adjusted for several potential confounders at baseline. Third, we used only a single serum creatinine measurement to define the presence of CKD. While serum creatinine can be affected by non-GFR determinants such as dietary factor and muscle mass, multiple serum creatinine measurements may give more accurate assessment of the presence of CKD. Fourth, we had only a single baseline assessment of exposures, and changes in sitting time and other lifestyle factors over time were not considered in our analyses. Fifth, the follow-up period was too short to assess the outcome of a chronic disease, which might have reduced the statistical power. Thus, our estimates are likely underestimations of the true HRs. Sixth, current research suggests that prolonged uninterrupted bouts of sitting have more detrimental health effects than shorter accumulated bouts [38,39]. Thus, patterns of sedentary behavior should also be the focus of such a study. As the data on mean sedentary bout duration were not available for the whole cohort, we could not explore this point. Sixth, as our follow-up period was relatively short, we did not assess the relationship between sitting time and the rate of kidney function decline, and this point needs further study.
Conclusions
In conclusion, our study suggests that longer sitting time was associated with a significantly higher risk of kidney function decline, independent of the baseline CKD risk factor burden and physical activity levels. As a modifiable risk factor for CKD prevention, interventions to reduce sedentary behavior should be recommended, which might contribute to the reduction of CKD incidence.
Supplementary Material 1. The questionnaire used in this study
During the last 7 days, how much time did you spend sitting on a week day (work and leisure)?
Monday to Friday
1 Yes _____ days per week, _____ hours per day
2 No 0 days per week
Saturday and Sunday
1 Yes _____ days per week, _____ hours per day
2 No 0 days per week
Flow chart of sample selection from the China Cardiometabolic Disease and Cancer Cohort (4C) study. Created using Microsoft Office PowerPoint.
Supplementary Table 1.
Baseline characteristics of the study participants according to incident kidney function decline.
| Incident eGFR decline | P value | ||
|---|---|---|---|
| No (n=128 233) | Yes (n=3890) | ||
| Age, years | 56.48±8.94 | 62.11±9.53 | <0.001 |
| Female (%) | 83860 (65.40) | 2461 (63.26) | 0.006 |
| Current smoking (%) | 19434 (15.16) | 506 (13.01) | <0.001 |
| Current drinking (%) | 13685 (10.67) | 303 (7.79) | <0.001 |
| MVPA (hour/week) | 1.40±4.99 | 1.41±4.56 | 0.912 |
| Sitting time (h/week) | 28.97±16.37 | 29.63±16.28 | 0.014 |
| BMI (kg/m2) | 24.63±3.62 | 25.08±3.56 | <0.001 |
| WC (cm) | 83.97±9.83 | 85.41±9.79 | <0.001 |
| SBP (mmHg) | 132.9±20.65 | 141.1±22.72 | <0.001 |
| DBP (mmHg) | 78.45±11.12 | 80.47±11.69 | <0.001 |
| FPG (mmol/L) | 5.94±1.59 | 6.33±2.12 | <0.001 |
| 2hPG (mmol/L) | 8.20±3.78 | 9.40±4.76 | <0.001 |
| HbA1c (%) | 6.00±1.00 | 6.31±1.31 | <0.001 |
| TC (mmol/L) | 4.96±1.13 | 4.84±1.43 | <0.001 |
| TG (mmol/L) | 1.31 (0.93–1.91) | 1.40 (0.96–2.01) | <0.001 |
| HDL-C (mmol/L) | 1.34±0.36 | 1.21±0.39 | <0.001 |
| LDL-C (mmol/L) | 2.88±0.87 | 2.82±1.03 | <0.001 |
| Cr (μmol/L) | 65.57±11.91 | 70.89±17.57 | <0.001 |
| eGFR (mL/min/1.73 m2) | 95.50±11.60 | 86.62±17.26 | <0.001 |
| Prevalence of hypertension (%) | 56731 (44.24) | 2443 (62.80) | <0.001 |
| Prevalence of diabetes (%) | 29319 (22.86) | 1370 (35.22) | <0.001 |
| Prevalence of dyslipidemia (%) | 54163 (42.24) | 2183 (56.12) | <0.001 |
Continuous variables are expressed as the mean (standard deviation) or median (IQR), and categorical variables are expressed as the number (percentage). eGFR – estimated glomerular filtration rate; MVPA – moderate or vigorous intensity physical activity; BMI – body mass index; WC – waist circumference; SBP – systolic blood pressure; DBP – diastolic blood pressure; FPG – fasting blood glucose; 2hPG – 2 hours postprandial blood glucose; TG – triglycerides; TC – total cholesterol; HDL-C – high-density lipoprotein cholesterol; LDL-C – low-density lipoprotein cholesterol; Cr – creatinine.
Supplementary Table 2.
Sensitivity analysis of associations between sitting time and kidney function decline-1 (n=110 721).
| Quartile 1 (n=27 531) | Quartile 2 (n=22 705) | Quartile 3 (n=31 704) | Quartile 4 (n=28 781) | P for trend | |
|---|---|---|---|---|---|
| Cases | 598 (2.2%) | 520 (2.3%) | 765 (2.4%) | 744 (2.6%) | 0.010 |
| Model 1 | 1 | 1.028 (0.914–1.156) | 1.059 (0.952–1.179) | 1.070 (0.961–1.192) | 0.183 |
| Model 2 | 1 | 1.039 (0.921–1.172) | 1.089 (0.976–1.215) | 1.198 (1.074–1.338) | <0.001 |
| Model 3 | 1 | 1.025 (0.906–1.161) | 1.070 (0.955–1.198) | 1.173 (1.048–1.314) | 0.004 |
The outcome was defined as an eGFR <60 mL/min/1.73 m2 at follow-up or more than a 30% decrease in eGFR from baseline, CKD-related hospitalization or death, or the presence of end-stage renal disease. In this analysis, participants with cancer, cardiovascular diseases, stroke, chronic respiratory diseases, and liver cirrhosis at baseline were excluded. Quartiles of sitting time: 1st quartile ≤17.4 h/week, 2nd quartile=17.5–27.9 h/week, 3rd quartile=28.0–36.9 h/week, 4th quartile ≥37 h/week. Model 1: Crude HR. Model 2: Adjusted for age, sex, current smoking, and current drinking. Model 3: Adjusted for covariates in model 2 plus BMI, hypertension, diabetes, dyslipidemia and MVPA. HR – hazard ratio; CI – confidence interval.
Supplementary Table 3.
Sensitivity analysis of associations between sitting time and kidney function decline-2 (n=132 123).
| Quartile 1 (n=32 947) | Quartile 2 (n=27 162) | Quartile 3 (n=37 810) | Quartile 4 (n=34 204) | P for trend | |
|---|---|---|---|---|---|
| Cases | 894 (2.7%) | 767 (2.8%) | 1153 (3.1%) | 1076 (3.2%) | 0.003 |
| Model 1 | 1 | 1.013 (0.920–1.116) | 1.079 (0.989–1.177) | 1.052 (0.963–1.150) | 0.137 |
| Model 2 | 1 | 1.018 (0.924–1.121) | 1.097 (1.005–1.197) | 1.154 (1.056–1.261) | <0.001 |
| Model 3 | 1 | 1.004 (0.911–1.106) | 1.077 (0.987–1.175) | 1.135 (1.038–1.240) | 0.002 |
The outcome was defined as an eGFR <60 mL/min/1.73 m2 and a rate of decline more than 1 mL/min/1.73 m2 per year, CKD-related hospitalization or death, or the presence of end-stage renal disease. Analysis was done after imputing for missing information. Quartiles of sitting time: 1st quartile ≤17.4 h/week, 2nd quartile=17.5–27.9 h/week, 3rd quartile=28.0–36.9 h/week, 4th quartile ≥37 h/week. Model 1: Crude HR. Model 2: Adjusted for age, sex, current smoking, and current drinking. Model 3: Adjusted for covariates in Model 2 plus BMI, hypertension, diabetes, dyslipidemia and MVPA. HR – hazard ratio; CI – confidence interval.
Supplementary Table 4.
Sensitivity analysis of associations between sitting time and kidney function decline-3 (n=132 123).
| Quartile 1 (n=32 947) | Quartile 2 (n=27 162) | Quartile 3 (n=37 810) | Quartile 4 (n=34 204) | P for trend | |
|---|---|---|---|---|---|
| Cases | 592 (1.8%) | 527 (1.9%) | 777 (2.1%) | 692 (2.0%) | 0.018 |
| Model 1 | 1 | 1.054 (0.937–1.185) | 1.101 (0.989–1.225) | 1.028 (0.921–1.147) | 0.486 |
| Model 2 | 1 | 1.065 (0.945–1.201) | 1.124 (1.008–1.253) | 1.151 (1.030–1.287) | 0.008 |
| Model 3 | 1 | 1.044 (0.923–1.182) | 1.106 (0.989–1.238) | 1.138 (1.015–1.277) | 0.016 |
The outcome was defined as an eGFR <60 mL/min/1.73 m2 and a rate of decline more than 1 mL/min/1.73 m2 per year, CKD-related hospitalization or death, or the presence of end-stage renal disease. Quartiles of sitting time: 1st quartile ≤17.4 h/week, 2nd quartile=17.5–27.9 h/week, 3rd quartile=28.0–36.9 h/week, 4th quartile ≥37 h/week. Model 1: Crude HR. Model 2: Adjusted for age, sex, current smoking, and current drinking. Model 3: Adjusted for covariates in Model 2 plus BMI, hypertension, diabetes, dyslipidaemia and MVPA. HR – hazard ratio; CI – confidence interval.
Supplementary Table 5.
Sensitivity analysis of associations between sitting time and kidney function decline-4 (n=132 123).
| Quartile 1 (n=32 947) | Quartile 2 (n=27 162) | Quartile 3 (n=37 810) | Quartile 4 (n=34 204) | P for trend | |
|---|---|---|---|---|---|
| Cases | 624 (1.9%) | 507 (1.9%) | 739 (2.0%) | 736 (2.2%) | 0.013 |
| Model 1 | 1 | 0.960 (0.854–1.079) | 0.990 (0.890–1.102) | 1.033 (0.928–1.149) | 0.465 |
| Model 2 | 1 | 0.957 (0.849–1.079) | 1.001 (0.898–1.115) | 1.099 (0.986–1.226) | 0.062 |
| Model 3 | 1 | 0.948 (0.838–1.072) | 0.994 (0.889–1.111) | 1.078 (0.964–1.205) | 0.126 |
The outcome was defined as more than a 30% decrease in eGFR from baseline, CKD-related hospitalization or death, or the presence of end-stage renal disease. Quartiles of sitting time: 1st quartile ≤17.4 h/week, 2nd quartile=17.5–27.9 h/week, 3rd quartile=28.0–36.9 h/week, 4th quartile ≥37 h/week. Model 1: Crude HR. Model 2: Adjusted for age, sex, current smoking, and current drinking. Model 3: Adjusted for covariates in Model 2 plus BMI, hypertension, diabetes, dyslipidaemia and MVPA. HR – hazard ratio; CI – confidence interval.
Acknowledgments
We thank all members in China Cardiometabolic Disease and Cancer Cohort Study Group for their great efforts in the survey.
Footnotes
Conflict of interest: None declared
Publisher’s note: All claims expressed in this article are solely those of the authors and do not necessarily represent those of their affiliated organizations, or those of the publisher, the editors and the reviewers. Any product that may be evaluated in this article, or claim that may be made by its manufacturer, is not guaranteed or endorsed by the publisher
Ethics Approval Statement
Informed consent was obtained from each study participant. The study protocol was approved by the Medical Ethics Committee of Ruijin Hospital, Shanghai Jiao Tong University.
Declaration of Figures’ Authenticity
All figures submitted have been created by the authors, who confirm that the images are original with no duplication and have not been previously published in whole or in part.
This research was funded by grants from the National Natural Science Foundation of China (82270880, 81570740)
Financial support: None declared
References
- 1.Webster AC, Nagler EV, Morton RL, Masson P. Chronic kidney disease. Lancet (London, England) 2017;389(10075):1238–52. doi: 10.1016/S0140-6736(16)32064-5. [DOI] [PubMed] [Google Scholar]
- 2.Matsushita K, van der Velde M, Astor BC, et al. Association of estimated glomerular filtration rate and albuminuria with all-cause and cardiovascular mortality in general population cohorts: A collaborative meta-analysis. Lancet. 2010;375(9731):2073–81. doi: 10.1016/S0140-6736(10)60674-5. [DOI] [PMC free article] [PubMed] [Google Scholar]
- 3.Lv JC, Zhang LX. Prevalence and disease burden of chronic kidney disease. Adv Exp Med Biol. 2019;1165:3–15. doi: 10.1007/978-981-13-8871-2_1. [DOI] [PubMed] [Google Scholar]
- 4.Jha V, Garcia-Garcia G, Iseki K, et al. Chronic kidney disease: global dimension and perspectives. Lancet (London, England) 2013;382(9888):260–72. doi: 10.1016/S0140-6736(13)60687-X. [DOI] [PubMed] [Google Scholar]
- 5.Global, regional, and national burden of chronic kidney disease, 1990–2017: A systematic analysis for the Global Burden of Disease Study 2017. Lancet (London, England) 2020;395(10225):709–33. doi: 10.1016/S0140-6736(20)30045-3. [DOI] [PMC free article] [PubMed] [Google Scholar]
- 6.Yang C, Wang H, Zhao X, et al. CKD in China: Evolving spectrum and public health implications. Am J Kidney Dis. 2020;76(2):258–64. doi: 10.1053/j.ajkd.2019.05.032. [DOI] [PubMed] [Google Scholar]
- 7.Tonelli M, Riella M. Chronic kidney disease and the aging population. Am J Hypertens. 2014;27(3):287–90. doi: 10.1093/ajh/hpt284. [DOI] [PubMed] [Google Scholar]
- 8.Pate RR, O’Neill JR, Lobelo F. The evolving definition of “sedentary”. Exerc Sport Sci Rev. 2008;36(4):173–78. doi: 10.1097/JES.0b013e3181877d1a. [DOI] [PubMed] [Google Scholar]
- 9.Martens RJH, van der Berg JD, Stehouwer CDA, et al. Amount and pattern of physical activity and sedentary behavior are associated with kidney function and kidney damage: The Maastricht Study. PLoS One. 2018;13(4):e0195306. doi: 10.1371/journal.pone.0195306. [DOI] [PMC free article] [PubMed] [Google Scholar]
- 10.Glavinovic T, Ferguson T, Komenda P, et al. CKD and sedentary time: Results from the Canadian health measures survey. Am J Kidney Dis. 2018;72(4):529–37. doi: 10.1053/j.ajkd.2018.03.031. [DOI] [PubMed] [Google Scholar]
- 11.Lee S, Shimada H, Lee S, et al. Association between sedentary time and kidney function in community-dwelling elderly Japanese people. Geriatr Gerontol Int. 2017;17(5):730–36. doi: 10.1111/ggi.12779. [DOI] [PubMed] [Google Scholar]
- 12.Parsons TJ, Sartini C, Ash S, et al. Objectively measured physical activity and kidney function in older men; A cross-sectional population-based study. Age Ageing. 2017;46(6):1010–14. doi: 10.1093/ageing/afx091. [DOI] [PMC free article] [PubMed] [Google Scholar]
- 13.McClellan WM, Abramson J, Newsome B, et al. Physical and psychological burden of chronic kidney disease among older adults. Am J Nephrol. 2010;31(4):309–17. doi: 10.1159/000285113. [DOI] [PMC free article] [PubMed] [Google Scholar]
- 14.Guo VY, Brage S, Ekelund U, et al. Objectively measured sedentary time, physical activity and kidney function in people with recently diagnosed Type 2 diabetes: A prospective cohort analysis. Diabet Med. 2016;33(9):1222–29. doi: 10.1111/dme.12886. [DOI] [PMC free article] [PubMed] [Google Scholar]
- 15.Volaklis K, Mamadjanov T, Meisinger C. Sedentary behavior and kidney function in adults: A narrative review. Wien Klin Wochenschr. 2021;133(3–4):144–52. doi: 10.1007/s00508-020-01673-2. [DOI] [PubMed] [Google Scholar]
- 16.Lynch BM, White SL, Owen N, et al. Television viewing time and risk of chronic kidney disease in adults: The AusDiab Study. Ann Behav Med. 2010 Dec;40(3):265–74. doi: 10.1007/s12160-010-9209-1. [DOI] [PubMed] [Google Scholar]
- 17.Hawkins M, Newman AB, Madero M, et al. TV watching, but not physical activity, is associated with change in kidney function in older adults. J Phys Act Health. 2015;12(4):561–68. doi: 10.1123/jpah.2013-0289. [DOI] [PMC free article] [PubMed] [Google Scholar]
- 18.Fujii Y, Yamamoto R, Shinzawa M, et al. Occupational sedentary behavior and prediction of proteinuria in young to middle-aged adults: A retrospective cohort study. J Nephrol. 2020;34(3):719–28. doi: 10.1007/s40620-020-00826-w. [DOI] [PubMed] [Google Scholar]
- 19.Wang T, Lu J, Su Q, et al. Ideal cardiovascular health metrics and major cardiovascular events in patients with prediabetes and diabetes. JAMA Cardiol. 2019;4(9):874–83. doi: 10.1001/jamacardio.2019.2499. [DOI] [PMC free article] [PubMed] [Google Scholar]
- 20.Lu J, He J, Li M, et al. Predictive value of fasting glucose, postload glucose, and hemoglobin A(1c) on risk of diabetes and complications in Chinese adults. Diabetes Care. 2019;42(8):1539–48. doi: 10.2337/dc18-1390. [DOI] [PubMed] [Google Scholar]
- 21.Levey AS, Stevens LA, Schmid CH, et al. A new equation to estimate glomerular filtration rate. Ann Intern Med. 2009;150(9):604–12. doi: 10.7326/0003-4819-150-9-200905050-00006. [DOI] [PMC free article] [PubMed] [Google Scholar]
- 22.American Diabetes Association. 2. Classification and Diagnosis of Diabetes: Standards of Medical Care in Diabetes – 2020. Diabetes Care. 2020;43(Suppl 1):S14–S31. doi: 10.2337/dc20-S002. [DOI] [PubMed] [Google Scholar]
- 23.Joint Committee for Guideline Revision. 2016 Chinese guidelines for the management of dyslipidemia in adults. J Geriatr Cardiol. 2018;15(1):1–29. doi: 10.11909/j.issn.1671-5411.2018.01.011. [DOI] [PMC free article] [PubMed] [Google Scholar]
- 24.Coresh J, Turin TC, Matsushita K, et al. Decline in estimated glomerular filtration rate and subsequent risk of end-stage kidney disease and mortality. JAMA. 2014;311(24):2518–31. doi: 10.1001/jama.2014.6634. [DOI] [PMC free article] [PubMed] [Google Scholar]
- 25.van der Velde M, Matsushita K, Coresh J, et al. Lower estimated glomerular filtration rate and higher albuminuria are associated with all-cause and cardiovascular mortality. A collaborative meta-analysis of high-risk population cohorts. Kidney Int. 2011;79(12):1341–52. doi: 10.1038/ki.2010.536. [DOI] [PubMed] [Google Scholar]
- 26.Levey AS, Inker LA, Matsushita K, et al. GFR decline as an end point for clinical trials in CKD: a scientific workshop sponsored by the National Kidney Foundation and the US Food and Drug Administration. Am J Kidney Dis. 2014;64(6):821–35. doi: 10.1053/j.ajkd.2014.07.030. [DOI] [PubMed] [Google Scholar]
- 27.Hommos MS, Glassock RJ, Rule AD. Structural and functional changes in human kidneys with healthy aging. J Am Soc Nephrol. 2017;28(10):2838–44. doi: 10.1681/ASN.2017040421. [DOI] [PMC free article] [PubMed] [Google Scholar]
- 28.Pandey A, Salahuddin U, Garg S, et al. Continuous dose-response association between sedentary time and risk for cardiovascular disease: A meta-analysis. JAMA Cardiol. 2016;1(5):575–83. doi: 10.1001/jamacardio.2016.1567. [DOI] [PubMed] [Google Scholar]
- 29.Ekelund U, Tarp J, Steene-Johannessen J, et al. Dose-response associations between accelerometry measured physical activity and sedentary time and all cause mortality: Systematic review and harmonised meta-analysis. BMJ. 2019;366:l4570. doi: 10.1136/bmj.l4570. [DOI] [PMC free article] [PubMed] [Google Scholar]
- 30.Restaino RM, Holwerda SW, Credeur DP, et al. Impact of prolonged sitting on lower and upper limb micro- and macrovascular dilator function. Exp Physiol. 2015;100(7):829–38. doi: 10.1113/EP085238. [DOI] [PMC free article] [PubMed] [Google Scholar]
- 31.Stephens BR, Granados K, Zderic TW, et al. Effects of 1 day of inactivity on insulin action in healthy men and women: Interaction with energy intake. Metabolism. 2011;60(7):941–49. doi: 10.1016/j.metabol.2010.08.014. [DOI] [PubMed] [Google Scholar]
- 32.Nerpin E, Risérus U, Ingelsson E, et al. Insulin sensitivity measured with euglycemic clamp is independently associated with glomerular filtration rate in a community – based cohort. Diabetes Care. 2008;31(8):1550–55. doi: 10.2337/dc08-0369. [DOI] [PMC free article] [PubMed] [Google Scholar]
- 33.Spoto B, Pisano A, Zoccali C. Insulin resistance in chronic kidney disease: A systematic review. Am J Physiol Renal Physiol. 2016;311(6):F1087–108. doi: 10.1152/ajprenal.00340.2016. [DOI] [PubMed] [Google Scholar]
- 34.Howard BJ, Balkau B, Thorp AA, et al. Associations of overall sitting time and TV viewing time with fibrinogen and C reactive protein: The AusDiab study. Br J Sports Med. 2015 Feb;49(4):255–58. doi: 10.1136/bjsports-2013-093014. [DOI] [PubMed] [Google Scholar]
- 35.Ebert T, Pawelzik SC, Witasp A, et al. Inflammation and premature ageing in chronic kidney disease. Toxins (Basel) 2020;12(4):227. doi: 10.3390/toxins12040227. [DOI] [PMC free article] [PubMed] [Google Scholar]
- 36.Rezende LFM, Lee DH, Ferrari G, Giovannucci E. Confounding due to pre-existing diseases in epidemiologic studies on sedentary behavior and all-cause mortality: A meta-epidemiologic study. Ann Epidemiol. 2020;52:7–14. doi: 10.1016/j.annepidem.2020.09.009. [DOI] [PubMed] [Google Scholar]
- 37.Knuiman MW, Divitini ML, Buzas JS, Fitzgerald PE. Adjustment for regression dilution in epidemiological regression analyses. Ann Epidemiol. 1998;8(1):56–63. doi: 10.1016/s1047-2797(97)00107-5. [DOI] [PubMed] [Google Scholar]
- 38.Diaz KM, Howard VJ, Hutto B, et al. Patterns of sedentary behavior and mortality in U.S. middle-aged and older adults: A national cohort study. Ann Intern Med. 2017;167(7):465–75. doi: 10.7326/M17-0212. [DOI] [PMC free article] [PubMed] [Google Scholar]
- 39.Diaz KM, Goldsmith J, Greenlee H, et al. Prolonged, uninterrupted sedentary behavior and glycemic biomarkers among US Hispanic/Latino adults: The HCHS/SOL (Hispanic Community Health Study/Study of Latinos) Circulation. 2017;136(15):1362–73. doi: 10.1161/CIRCULATIONAHA.116.026858. [DOI] [PMC free article] [PubMed] [Google Scholar]
Associated Data
This section collects any data citations, data availability statements, or supplementary materials included in this article.
Supplementary Materials
Flow chart of sample selection from the China Cardiometabolic Disease and Cancer Cohort (4C) study. Created using Microsoft Office PowerPoint.
Supplementary Table 1.
Baseline characteristics of the study participants according to incident kidney function decline.
| Incident eGFR decline | P value | ||
|---|---|---|---|
| No (n=128 233) | Yes (n=3890) | ||
| Age, years | 56.48±8.94 | 62.11±9.53 | <0.001 |
| Female (%) | 83860 (65.40) | 2461 (63.26) | 0.006 |
| Current smoking (%) | 19434 (15.16) | 506 (13.01) | <0.001 |
| Current drinking (%) | 13685 (10.67) | 303 (7.79) | <0.001 |
| MVPA (hour/week) | 1.40±4.99 | 1.41±4.56 | 0.912 |
| Sitting time (h/week) | 28.97±16.37 | 29.63±16.28 | 0.014 |
| BMI (kg/m2) | 24.63±3.62 | 25.08±3.56 | <0.001 |
| WC (cm) | 83.97±9.83 | 85.41±9.79 | <0.001 |
| SBP (mmHg) | 132.9±20.65 | 141.1±22.72 | <0.001 |
| DBP (mmHg) | 78.45±11.12 | 80.47±11.69 | <0.001 |
| FPG (mmol/L) | 5.94±1.59 | 6.33±2.12 | <0.001 |
| 2hPG (mmol/L) | 8.20±3.78 | 9.40±4.76 | <0.001 |
| HbA1c (%) | 6.00±1.00 | 6.31±1.31 | <0.001 |
| TC (mmol/L) | 4.96±1.13 | 4.84±1.43 | <0.001 |
| TG (mmol/L) | 1.31 (0.93–1.91) | 1.40 (0.96–2.01) | <0.001 |
| HDL-C (mmol/L) | 1.34±0.36 | 1.21±0.39 | <0.001 |
| LDL-C (mmol/L) | 2.88±0.87 | 2.82±1.03 | <0.001 |
| Cr (μmol/L) | 65.57±11.91 | 70.89±17.57 | <0.001 |
| eGFR (mL/min/1.73 m2) | 95.50±11.60 | 86.62±17.26 | <0.001 |
| Prevalence of hypertension (%) | 56731 (44.24) | 2443 (62.80) | <0.001 |
| Prevalence of diabetes (%) | 29319 (22.86) | 1370 (35.22) | <0.001 |
| Prevalence of dyslipidemia (%) | 54163 (42.24) | 2183 (56.12) | <0.001 |
Continuous variables are expressed as the mean (standard deviation) or median (IQR), and categorical variables are expressed as the number (percentage). eGFR – estimated glomerular filtration rate; MVPA – moderate or vigorous intensity physical activity; BMI – body mass index; WC – waist circumference; SBP – systolic blood pressure; DBP – diastolic blood pressure; FPG – fasting blood glucose; 2hPG – 2 hours postprandial blood glucose; TG – triglycerides; TC – total cholesterol; HDL-C – high-density lipoprotein cholesterol; LDL-C – low-density lipoprotein cholesterol; Cr – creatinine.
Supplementary Table 2.
Sensitivity analysis of associations between sitting time and kidney function decline-1 (n=110 721).
| Quartile 1 (n=27 531) | Quartile 2 (n=22 705) | Quartile 3 (n=31 704) | Quartile 4 (n=28 781) | P for trend | |
|---|---|---|---|---|---|
| Cases | 598 (2.2%) | 520 (2.3%) | 765 (2.4%) | 744 (2.6%) | 0.010 |
| Model 1 | 1 | 1.028 (0.914–1.156) | 1.059 (0.952–1.179) | 1.070 (0.961–1.192) | 0.183 |
| Model 2 | 1 | 1.039 (0.921–1.172) | 1.089 (0.976–1.215) | 1.198 (1.074–1.338) | <0.001 |
| Model 3 | 1 | 1.025 (0.906–1.161) | 1.070 (0.955–1.198) | 1.173 (1.048–1.314) | 0.004 |
The outcome was defined as an eGFR <60 mL/min/1.73 m2 at follow-up or more than a 30% decrease in eGFR from baseline, CKD-related hospitalization or death, or the presence of end-stage renal disease. In this analysis, participants with cancer, cardiovascular diseases, stroke, chronic respiratory diseases, and liver cirrhosis at baseline were excluded. Quartiles of sitting time: 1st quartile ≤17.4 h/week, 2nd quartile=17.5–27.9 h/week, 3rd quartile=28.0–36.9 h/week, 4th quartile ≥37 h/week. Model 1: Crude HR. Model 2: Adjusted for age, sex, current smoking, and current drinking. Model 3: Adjusted for covariates in model 2 plus BMI, hypertension, diabetes, dyslipidemia and MVPA. HR – hazard ratio; CI – confidence interval.
Supplementary Table 3.
Sensitivity analysis of associations between sitting time and kidney function decline-2 (n=132 123).
| Quartile 1 (n=32 947) | Quartile 2 (n=27 162) | Quartile 3 (n=37 810) | Quartile 4 (n=34 204) | P for trend | |
|---|---|---|---|---|---|
| Cases | 894 (2.7%) | 767 (2.8%) | 1153 (3.1%) | 1076 (3.2%) | 0.003 |
| Model 1 | 1 | 1.013 (0.920–1.116) | 1.079 (0.989–1.177) | 1.052 (0.963–1.150) | 0.137 |
| Model 2 | 1 | 1.018 (0.924–1.121) | 1.097 (1.005–1.197) | 1.154 (1.056–1.261) | <0.001 |
| Model 3 | 1 | 1.004 (0.911–1.106) | 1.077 (0.987–1.175) | 1.135 (1.038–1.240) | 0.002 |
The outcome was defined as an eGFR <60 mL/min/1.73 m2 and a rate of decline more than 1 mL/min/1.73 m2 per year, CKD-related hospitalization or death, or the presence of end-stage renal disease. Analysis was done after imputing for missing information. Quartiles of sitting time: 1st quartile ≤17.4 h/week, 2nd quartile=17.5–27.9 h/week, 3rd quartile=28.0–36.9 h/week, 4th quartile ≥37 h/week. Model 1: Crude HR. Model 2: Adjusted for age, sex, current smoking, and current drinking. Model 3: Adjusted for covariates in Model 2 plus BMI, hypertension, diabetes, dyslipidemia and MVPA. HR – hazard ratio; CI – confidence interval.
Supplementary Table 4.
Sensitivity analysis of associations between sitting time and kidney function decline-3 (n=132 123).
| Quartile 1 (n=32 947) | Quartile 2 (n=27 162) | Quartile 3 (n=37 810) | Quartile 4 (n=34 204) | P for trend | |
|---|---|---|---|---|---|
| Cases | 592 (1.8%) | 527 (1.9%) | 777 (2.1%) | 692 (2.0%) | 0.018 |
| Model 1 | 1 | 1.054 (0.937–1.185) | 1.101 (0.989–1.225) | 1.028 (0.921–1.147) | 0.486 |
| Model 2 | 1 | 1.065 (0.945–1.201) | 1.124 (1.008–1.253) | 1.151 (1.030–1.287) | 0.008 |
| Model 3 | 1 | 1.044 (0.923–1.182) | 1.106 (0.989–1.238) | 1.138 (1.015–1.277) | 0.016 |
The outcome was defined as an eGFR <60 mL/min/1.73 m2 and a rate of decline more than 1 mL/min/1.73 m2 per year, CKD-related hospitalization or death, or the presence of end-stage renal disease. Quartiles of sitting time: 1st quartile ≤17.4 h/week, 2nd quartile=17.5–27.9 h/week, 3rd quartile=28.0–36.9 h/week, 4th quartile ≥37 h/week. Model 1: Crude HR. Model 2: Adjusted for age, sex, current smoking, and current drinking. Model 3: Adjusted for covariates in Model 2 plus BMI, hypertension, diabetes, dyslipidaemia and MVPA. HR – hazard ratio; CI – confidence interval.
Supplementary Table 5.
Sensitivity analysis of associations between sitting time and kidney function decline-4 (n=132 123).
| Quartile 1 (n=32 947) | Quartile 2 (n=27 162) | Quartile 3 (n=37 810) | Quartile 4 (n=34 204) | P for trend | |
|---|---|---|---|---|---|
| Cases | 624 (1.9%) | 507 (1.9%) | 739 (2.0%) | 736 (2.2%) | 0.013 |
| Model 1 | 1 | 0.960 (0.854–1.079) | 0.990 (0.890–1.102) | 1.033 (0.928–1.149) | 0.465 |
| Model 2 | 1 | 0.957 (0.849–1.079) | 1.001 (0.898–1.115) | 1.099 (0.986–1.226) | 0.062 |
| Model 3 | 1 | 0.948 (0.838–1.072) | 0.994 (0.889–1.111) | 1.078 (0.964–1.205) | 0.126 |
The outcome was defined as more than a 30% decrease in eGFR from baseline, CKD-related hospitalization or death, or the presence of end-stage renal disease. Quartiles of sitting time: 1st quartile ≤17.4 h/week, 2nd quartile=17.5–27.9 h/week, 3rd quartile=28.0–36.9 h/week, 4th quartile ≥37 h/week. Model 1: Crude HR. Model 2: Adjusted for age, sex, current smoking, and current drinking. Model 3: Adjusted for covariates in Model 2 plus BMI, hypertension, diabetes, dyslipidaemia and MVPA. HR – hazard ratio; CI – confidence interval.