

Abstract
Background:
Numerous mechanical biomarkers derived from pulse wave analysis (PWA) have been proposed to predict cardiovascular outcomes. However, whether these biomarkers carry independent prognostic value and clinical utility beyond traditional cardiovascular risk factors hasn’t been systematically evaluated. We aimed to investigate the additive utility of PWA-derived biomarkers in two independent population-based cohorts.
Methods:
PWA on central arterial pressure waveforms obtained from subjects without a prior history of cardiovascular diseases of two studies was conducted based on the wave transmission and reservoir-wave theory: firstly in the Kinmen study (1272 individuals, a median follow-up of 19.8 years); and then in the Cardiovascular Disease Risk Factors Two-Township Study (2221 individuals, median follow-up of 10 years). The incremental value of the biomarkers was evaluated by net reclassification index (NRI).
Results:
In multivariate Cox analyses accounting for age, gender, body mass index, systolic blood pressure, fasting glucose, high-density- and low-density-lipoprotein cholesterol, and smoking, only systolic (SC) and diastolic rate constant (DC) of reservoir pressure could independently and consistently predict cardiovascular mortality in both cohorts and the combined cohort (SC: hazard ratio 1.18 [95% confidence interval 1.08–1.28, p < 0.001; DC: 1.18 [1.09–1.28], p < 0.001]. Risk prediction estimates in traditional risk prediction models were significantly more accurate when incorporating peak of reservoir pressure (NRI = 0.049, p = 0.0361), SC (NRI = 0.043, p = 0.0236) and DC (NRI = 0.054, p = 0.047).
Conclusions:
Of all PWA-derived biomarkers, SC and DC were consistently identified as valuable parameters for incremental cardiovascular risk prediction in two large prospective cohorts.
Keywords: Wave reflection, Pulse wave analysis, Vascular aging, Mortality, Epidemiology, Reservoir pressure
1. Introduction
The arterial system functions both as a conduit and as a reservoir [1]. Vascular aging and its associated arterial stiffening have a major impact on the arterial pressure waveform and cardiovascular risk. The peak and trough of arterial pressure waveforms, systolic and diastolic blood pressure (BP), have been linearly associated with the risk of cardiovascular events [2]. The Windkessel and wave transmission theories have been used to model the complex interactions between the heart and the arterial system, and both distinctively provide explanations on the changes in the arterial pressure waveform with aging and diseases. Based on the wave transmission theory, the arterial pressure waveform is composed of a forward wave and a reflected wave. Increased wave reflection measured by the pulse wave analysis (PWA) is related to the extent of myocardial ischemia in patients with [3] and without [4] obstructive coronary artery disease. The pressure wave reflection is also directly related to left ventricular hypertrophy [5] and its regression with treatment [6], to left atrial size [7], and is inversely related to left ventricular diastolic function at rest [7] and during exercise [8]. An increase in wave reflection has been associated with a decreased renal function [9] and with an impaired outcome following acute ischemic stroke [10]. Using a triangulation method, we were able to decompose the central pressure waveforms derived by tonometry into their forward wave amplitudes and backward wave amplitudes (Pb) and demonstrate that Pb predicts long-term cardiovascular mortality in men and women independent of arterial stiffness [11,12].
Recently, the reservoir function of vascular systems has been modeled by Wang et al. as the volume related pressure changes in arterial [13] and venous vascular systems [14]. Aortic stiffening with advancing age not only leads to an accelerated wave speed and more pronounced wave reflections [11], but also to a reduced reservoir function. Parameters based on the reservoir-wave concept that combines elements of wave transmission and Windkessel models of arterial pressure generation were shown to predict clinical outcomes in hypertensive patients in two randomized control trials, ANBP2 [15] and ASCOT-CAFÉ studies [16].
As a result, current PWA can provide parameters based on both the wave transmission theory and the reservoir-wave analysis. However, whether these biomarkers confer independent prognostic value beyond traditional cardiovascular risk factors, has not been comprehensively and systematically evaluated.
Although numerous novel biomarkers have been proposed in various study populations, reproducibility is vital to assure that previous results are reliable and valid and could be applied to new situations. Results should be repeated in studies with different subjects and experimenters. Therefore, the aim of the present study was to examine the prognostic value and the incremental clinical utilities of these PWA-derived mechanical biomarkers in two independent population based cohorts.
2. Methods
2.1. Study population
The characteristics of participants and patient enrollment process of the first cohort from Kinmen have been detailed elsewhere [17]. In brief, a previous community-based survey was conducted in 1992–1993 in Kinmen [18], from which a total of 1272 normotensive and untreated hypertensive Taiwanese subjects (47.0% women, mean age 52 ± 13 years old, range 30–79 years) were drawn after excluding participants with a previous history of diabetes mellitus, angina pectoris, peripheral vascular disease, and any clinical or echocardiographic evidence of other significant cardiac diseases. The study protocol was approved by the institutional review board at the Johns Hopkins University and Informed consent was obtained from all participants.
To demonstrate the reproducibility, the prognostic value of all PWA-derived biomarkers was then examined in the second cohort from the “Cardiovascular Disease Risk Factors Two-Township Study” (CVDFACTS), a community-based follow-up study focusing on risk factor evaluation and cardiovascular disease development in Taiwan [19, 20]. Of the participants in CVDFACTS, a total of 2211 individuals without a prior history of cardiovascular diseases had undergone measurements of arterial tonometry during their cycle 4 examination (1997–1999).
2.2. Data collection
After being seated for at least 5 min, measurements of brachial systolic BP (SBP) and diastolic BP (DBP) from the right arm of subjects were manually taken with a mercury sphygmomanometer and a standard-sized cuff (13 cm × 50 cm). Reported blood pressures represent the average of at least two consecutive measurements separated by at least 5 min. Brachial pulse pressure (PP) was calculated as [brachial SBP – brachial DBP]. Overnight fasting serum and plasma samples were drawn for blood chemistry analysis.
2.3. Central arterial pulse wave analysis (Fig. 1)
Fig. 1.
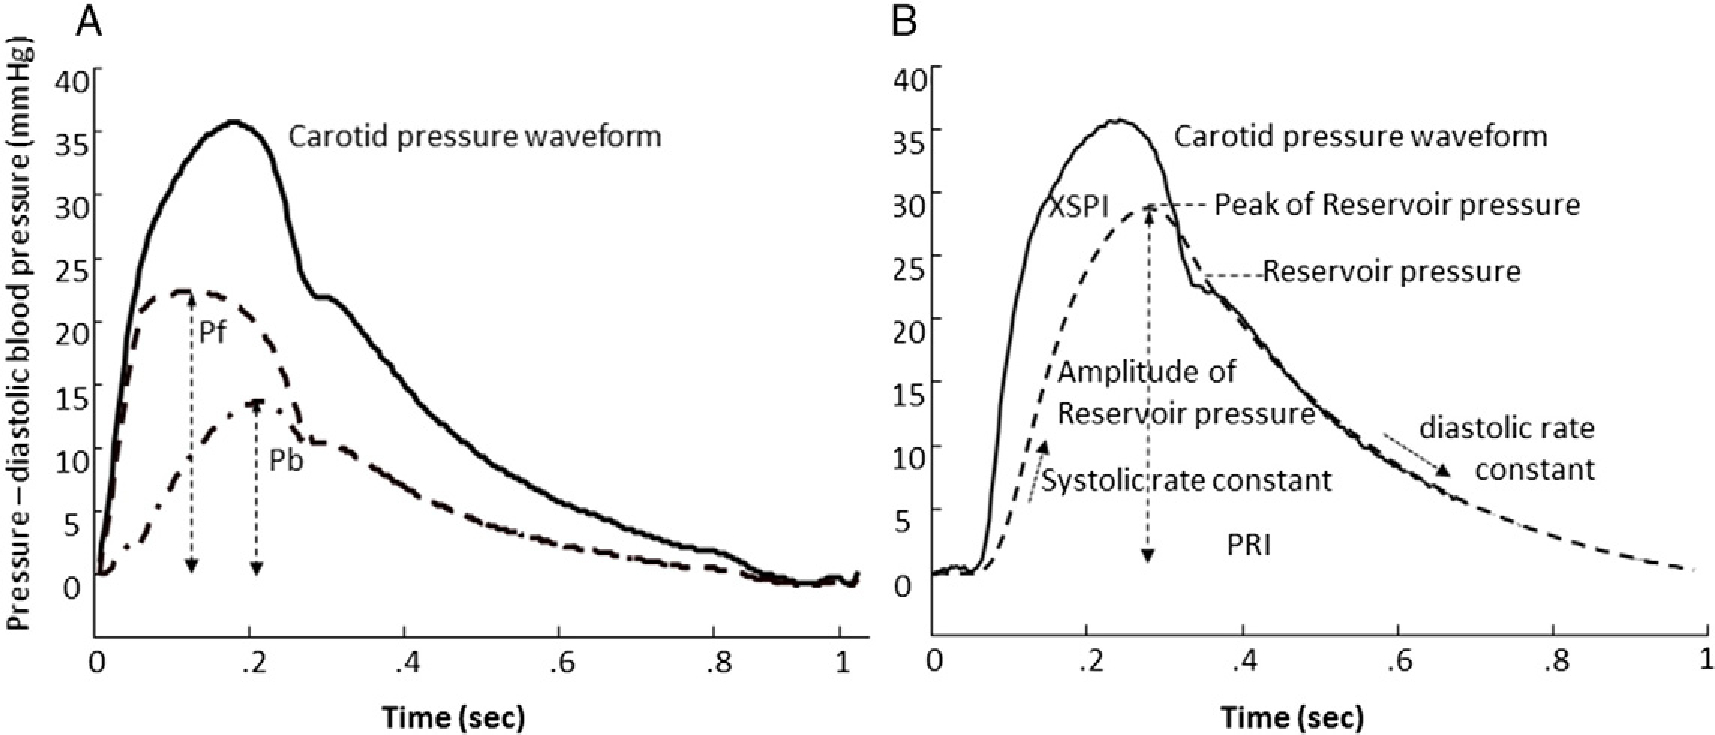
(A) Parameters obtained from the triangulation method for wave separation. Dashed line: forward pressure wave; dash-dotted line: backward pressure wave. (B) Parameters obtained from the arterial reservoir model. Solid line: carotid pressure waveform; dashed line: reservoir pressure. XSPI = excess pressure integral; PRI = reservoir pressure integral. Solid line: carotid pressure waveform; dashed line: forward pressure wave (Pf); dashed-dot line: back pressure wave (Pb).
In the Kinmen study, right carotid artery pressure waveforms, which have been demonstrated to closely resemble central aortic pressure waveforms [21–23], were registered noninvasively with a tonometer [18,24]. The common carotid artery pressure waveforms were calibrated with brachial mean BP (MBP) and DBP to obtain the carotid BP [21]. Recently, it has been argued that MBP should be estimated as brachial DBP along with 40% of brachial artery pulse pressure [25]. We therefore conducted a sensitivity analysis by using a brachial form factor of either 0.33 or 0.4 to evaluate the impact of different calibrating methods on the prognostic significance of these mechanical biomarkers (Appendix I). Because the prognostic value (hazard ratio and Wald Chi2) were comparable between these two methods, we therefore only present the results of a traditional calibrating method with a form factor of 0.33. In the CVDFACTS study, central aortic pressure waveforms were obtained with a SphygmoCor device (AtCor Medical, Sydney, Australia) using radial arterial pressure waveforms and a validated generalized transfer function according to the manufacturer’s instructions [26]. Radial arterial pressure waveforms, obtained by applanation tonometry using a solid-state high-fidelity external Millar transducer, were calibrated with cuff SBP and DBP values, and then mathematically transformed by the validated transfer function [26] into corresponding central aortic pressure waveforms. Central PP was calculated as central SBP – central DBP.
Digitized central arterial pressure waveform signals were analyzed using custom-designed software on a commercial software package (Matlab®, version 4.2 and 7.0, The MathWorks, Inc.). To avoid inter- and intra-observer variations, we performed a fully automatic batch analysis for all processed individual signals. The inflection point was recognized on the calibrated central arterial pressure waveform using the zero-crossing timings of the fourth derivative of the pressure wave [27]. Augmentation index (AI) was calculated accordingly [23]. Forward and reflected components of the central arterial pressure waveform were separated using the triangulation method based on the following equations [28]:
where is the central arterial pressure wave, is the approximated triangular-shaped flow wave, is the characteristic impedance, is the forward pressure wave, and is the backward pressure component. and are the pressure amplitudes of and , respectively. The accuracy of the triangulation method in obtaining the magnitude of and has been validated previously [11,28]. Reflection magnitude (RM) was calculated as .
2.4. Reservoir-wave analysis
Reservoir-wave analysis is a time-domain analysis, based on the understanding that the arterial system not only functions as a conduit system, conducting waves to periphery, but also as a hydraulic integrator, by which the arterial system charges during systole as inflow exceeding outflow, and discharges during diastole, through recoiling of the elastic arteries, continuously supplying blood to vital organs, notably the brain, heart and kidney [13]. In reservoir-wave analysis, central arterial pressure is presumed to be the instantaneous sum of a pressure associated with aortic blood volume and compliance (Preservoir), and a pressure due to propagation characteristics (Pexcess) [13]. Reservoir pressure was calculated from the ensemble averaged central arterial tonometric waveforms. Reservoir pressure is assumed to vary temporally in the same way throughout the aorta and large elastic arteries, but with a time lag that depends on the location and wave propagation characteristics of the arteries [29,30]. Details of the calculations of parameters of reservoir pressure are presented in Appendix II. In the present study, we also provided (in Table S2) the reference value of these parameters obtained previously [13,29,30] with invasive central aortic pressure and flow waveforms (Appendix III). Parameters calculated by using the pressure alone reservoir-wave analysis have been compared with those calculated by using the true aortic flow wave derived from Doppler echocardiography in another randomly selected 202 subjects in our laboratory (Appendix IV). Calculations of these parameters were in good agreement between these two approaches, with intra-class correlation coefficients ranging from 0.77 to 0.99 (Table S4 and Fig. S1: Bland–Altman plots in Appendix IV). The systolic rate constant (SC) of the reservoir pressure waveform represents the rate constant for reservoir filling and is inversely related to the product of aortic characteristic impedance and total arterial compliance. In contrast, diastolic rate constant (DC) represents reservoir emptying and is inversely related to the product of systemic arterial resistance and total arterial compliance. As shown in Fig. 2, an increase in SC would increase the magnitude and the rate of upstroke of reservoir pressure. Here we demonstrated that when an aortic reservoir is charged to a level (arbitrary), a decrease in DC would decrease the rate of discharging of aortic reservoir.
Fig. 2.
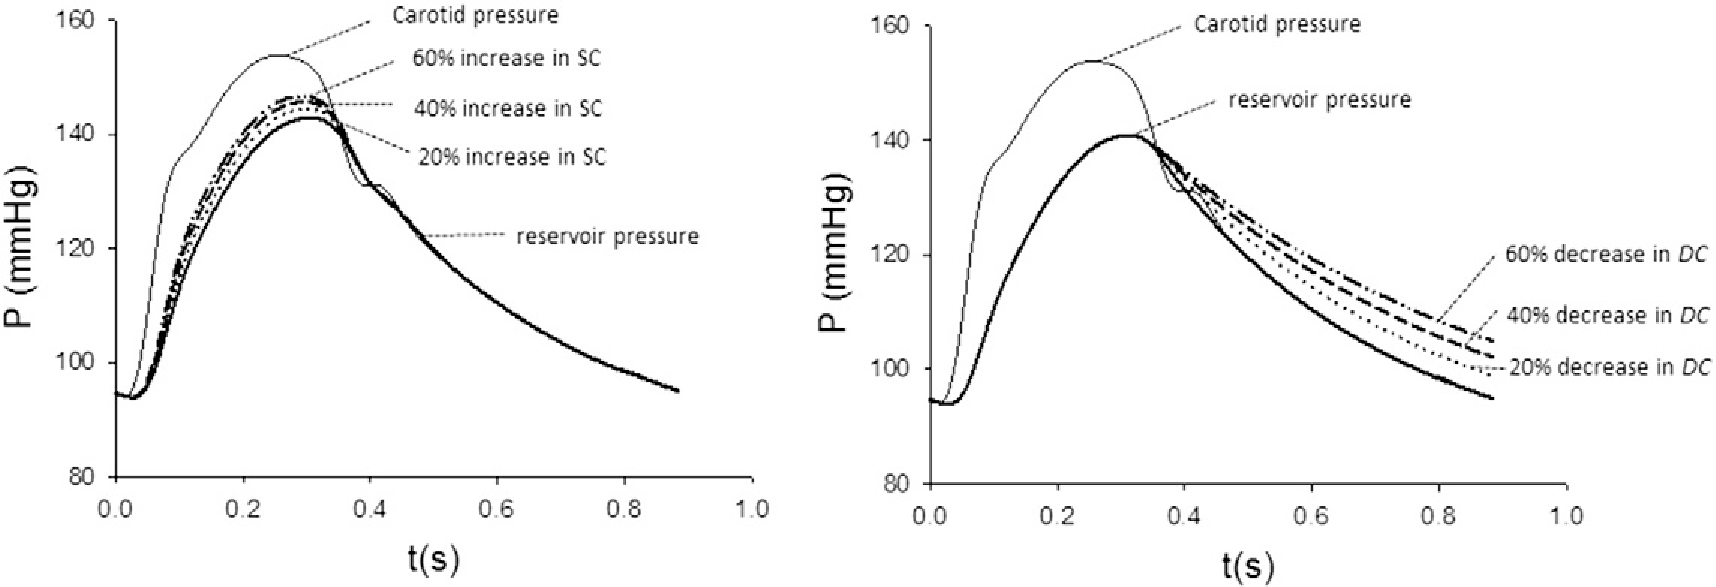
Effect of changes in systolic rate constant (SC) and diastolic rate constant (DC) on reservoir pressure waveform. The reservoir pressure waveform is represented by the bold solid line. (A) An increase in SC results in an upward shift of the ascending portion of the pressure waveform. (B) In contrast, a decrease in DC results in upward shift of the descending portion of the pressure waveform.
2.5. Follow-up
By linking our databases with the National Death Registry, we retrieved the dates and causes of death of all participants in our cohort from the National Death Registry database based on the certified death certificates coded according to the International Classification of Diseases, Ninth Revision (ICD-9). Cardiovascular deaths were identified with the ICD-9 codes 390–459. The accuracy of cause-of-death coding in Taiwan’s National Death Registry database has been validated. Individuals that did not appear in the National Death Registry on censoring dates were considered to be survivors.
2.6. Statistical analysis
Data are presented as percent or mean ± standard deviation. To evaluate the prognostic value of all PWA-derived biomarkers, we first categorized all subjects into quartiles by the biomarker values and calculated their corresponding cardiovascular mortalities. Then we used Cox proportional hazard regression analyses to identify predictors of cardiovascular mortality in these two population-based cohorts, respectively. A baseline multivariate model was then constructed by including conventional cardiovascular risk factors: age, sex, systolic BP, body mass index, fasting glucose, triglycerides, low-density-lipoprotein cholesterol, high-density-lipoprotein cholesterol, smoking, and alcohol. Based on the baseline multivariate model, parameters of all PWA-derived biomarkers were then examined for their adjusted hazard ratios and 95% confidence intervals per one-standard deviation increment in the specific cohort and in combination. We employed net reclassification index (NRI) to evaluate the reclassification effects of the independent prognostic biomarkers identified from the combined analyses for predicting future cardiovascular events [31–33]. Statistical analyses were performed using SAS 9.1 software. A two-tailed p < 0.05 was considered statistically significant.
3. Results
A total of 3483 subjects with 1272 subjects in the Kinmen study and 2211 subjects in the CVDFACTS study were included. The baseline characteristics of the participants and results of the central pressure waveform analysis are presented in Table 1. Cardiovascular mortality was higher in Kinmen due to a higher hypertension prevalence and more male participants in the Kinmen cohort than in the CVDFACTS cohort (4.0/1000 person-year vs. 1.6/1000 person-year). In the Kinmen study, during a median follow-up of 19.8 years, 315 (26.9%) deaths occurred (84 of cardiovascular origin). In the CVDFACTS study, a total of 171 deaths occurred (34 of cardiovascular origin) during a median follow-up of 10 years.
Table 1.
Characteristics of study population.
| Kinmen study (N = 1272) | CVDFACTS study (N = 2211) | |
|---|---|---|
|
| ||
| Age, years | 52.3 ± 12.8 | 53.4 ± 12.0 |
| Men, % | 54% | 45.8% |
| Brachial SBP, mm Hg | 139.0 ± 23.3 | 122.2 ± 17.0 |
| Brachial DBP, mm Hg | 88.2 ± 15.1 | 68.1 ± 10.3 |
| Central SBP, mm Hg | 126.4 ± 23.9 | 111.6 ± 16.2 |
| Central PP, mm Hg | 42.0 ± 16.1 | 41.5 ± 10.9 |
| BMI, kg/m2 | 24.7 ± 3.6 | 24.2 ±3.2 |
| FBS, mg/dl | 99.8 ± 22.6 | 96.5 ± 9.4 |
| LDL-C, mg/dl | 122.4 ± 34.1 | 122.0 ± 37.2 |
| HDL-C, mg/dl | 50.8 ± 12.8 | 47.9 ± 16.8 |
| Triglyceride, md/dl | 125.3 ± 96.5 | 117.7 ± 77.4 |
| Pf, mm Hg | 36.3 ± 12.7 | 25.5 ± 6.1 |
| Pb, mm Hg | 18.6 ± 8.7 | 16.4 ± 5.1 |
| Augmented pressure, mm Hg | 14.9 ± 10.4 | 12.4 ± 6.6 |
| AI | 0.25 ± 0.21 | 0.40 ± 0.16 |
| RM | 0.51 ± 0.14 | 0.64 ± 0.11 |
| Peak reservoir pressure | 115.6 ± 21.8 | 104.9 ± 14.9 |
| Amplitude of reservoir pressure | 31.2 ± 13.1 | 33.0 ± 9.3 |
| XSPI, mmHg-s−1 | 3.4 ± 1.6 | 2.1 ± 0.8 |
| PRI, mm Hg-s−1 | 11.2± 4.8 | 12.6 ± 4.0 |
| Systolic rate constant, s−1 | 18.6 ± 9.4 | 16.2 ± 5.8 |
| Diastolic rate constant, s−1 | 4.3 ± 0.50 | 2.8 ± 1.1 |
BMI = body mass index; FBS = fasting blood sugar; LDL-C = low density lipoprotein cholesterol; HDL-C = high density lipoprotein cholesterol; Pf = forward pressure amplitude; Pb = backward wave amplitudes; SBP = systolic blood pressure; PP = pulse pressure; XSPI = excess pressure integral; PRI = reservoir pressure integral; AI = augmentation index; RM = reflection magnitude.
Increased brachial systolic BP, pulse pressure, Pb, and AI were significantly associated with increased cardiovascular mortality in both studies. Similarly, biomarkers derived from reservoir pressure-wave analysis were also positively associated with cardiovascular mortality. In Table 2, the age and gender adjusted hazard ratios for predicting cardiovascular mortality were examined firstly in Kinmen and then in CVDFACTS studies (Table 2). In the age and gender adjusted multivariate model, all parameters derived from the central pulse wave analysis in the Kinmen study had significant associations with cardiovascular mortality. In the CVDFACTS study, only peak of reservoir pressure and DC remained significant in predicting cardiovascular mortality (Table 2).
Table 2.
The hazard ratios of various hemodynamic parameters for predicting cardiovascular mortality in age and gender adjusted model.
| Kinmen study |
CVDFACTS study |
|||||||||
|---|---|---|---|---|---|---|---|---|---|---|
| Hazard ratio, per SD | 95% confidence intervals | X2 | p-Value | Hazard ratio, per SD | 95% confidence intervals | X2 | p-Value | |||
|
| ||||||||||
| Brachial PP | 1.46 | 1.31 | 1.62 | 49.39 | <0.0001 | 1.359 | 0.951 | 1.941 | 2.8322 | 0.0924 |
| Pf | 1.322 | 1.091 | 1.601 | 8.1115 | 0.0044 | 1.092 | 0.788 | 1.514 | 0.2795 | 0.5970 |
| Pb | 1.655 | 1.362 | 2.011 | 25.685 | <0.0001 | 1.152 | 0.831 | 1.597 | 0.7162 | 0.3974 |
| Augmented pressure | 1.684 | 1.373 | 2.065 | 25.0715 | <0.0001 | 0.956 | 0.726 | 1.260 | 0.1006 | 0.7511 |
| AI | 1.701 | 1.278 | 2.264 | 13.241 | 0.0003 | 1.288 | 0.783 | 2.120 | 0.9915 | 0.3194 |
| RM | 1.455 | 1.194 | 1.774 | 13.7741 | 0.0002 | 1.298 | 0.807 | 2.087 | 1.1596 | 0.2815 |
| Peak of reservoir pressure | 1.953 | 1.599 | 2.386 | 42.9522 | <0.0001 | 1.502 | 1.055 | 2.139 | 5.0819 | 0.0242 |
| Amplitude of reservoir pressure | 1.450 | 1.224 | 1.718 | 18.4218 | <0.0001 | 1.184 | 0.857 | 1.637 | 1.0503 | 0.3054 |
| PRI | 1.273 | 1.093 | 1.482 | 9.6269 | 0.0019 | 1.011 | 0.751 | 1.362 | 0.0053 | 0.9418 |
| XSPI | 1.147 | 1.017 | 1.293 | 5.0300 | 0.0249 | 0.949 | 0.687 | 1.312 | 0.0996 | 0.7523 |
| Systolic rate constant | 1.573 | 1.325 | 1.866 | 26.8654 | <0.0001 | 1.298 | 0.973 | 1.733 | 3.1403 | 0.0764 |
| Diastolic rate constant | 1.762 | 1.475 | 2.104 | 38.9680 | <0.0001 | 1.363 | 1.001 | 1.856 | 3.8751 | 0.0490 |
SD = standard deviation; Pf = forward pressure amplitude; Pb = backward wave amplitudes; SBP = systolic blood pressure; PP = pulse pressure; XSPI = excess pressure integral; PRI = reservoir pressure integral; AI = augmentation index; RM = reflection magnitude.
The associations between all mechanical biomarkers derived from pulse wave analysis and cardiovascular mortality was then examined in the multivariate Cox proportional hazards models that took into account cardiovascular risk factors including age, sex, systolic BP, body mass index, fasting glucose, triglycerides, low-density-lipoprotein cholesterol, and high-density-lipoprotein cholesterol, and smoking. As illustrated in Figs. 3 and 4, Pb, augmented pressure, AI, RM, peak of reservoir pressure, amplitude of reservoir pressure, SC, and DC were significant prognostic biomarkers in the Kinmen study when each of these parameters was incorporated into the above multivariate model. In the CVDFACTS cohort, only SC and DC remained significant in predicting cardiovascular mortality after accounting for the above covariates. In the combined cohort, AI, RM, SC, and DC were independent predictors, even after adjusting for the widely used cardiovascular risk factors.
Fig. 3.
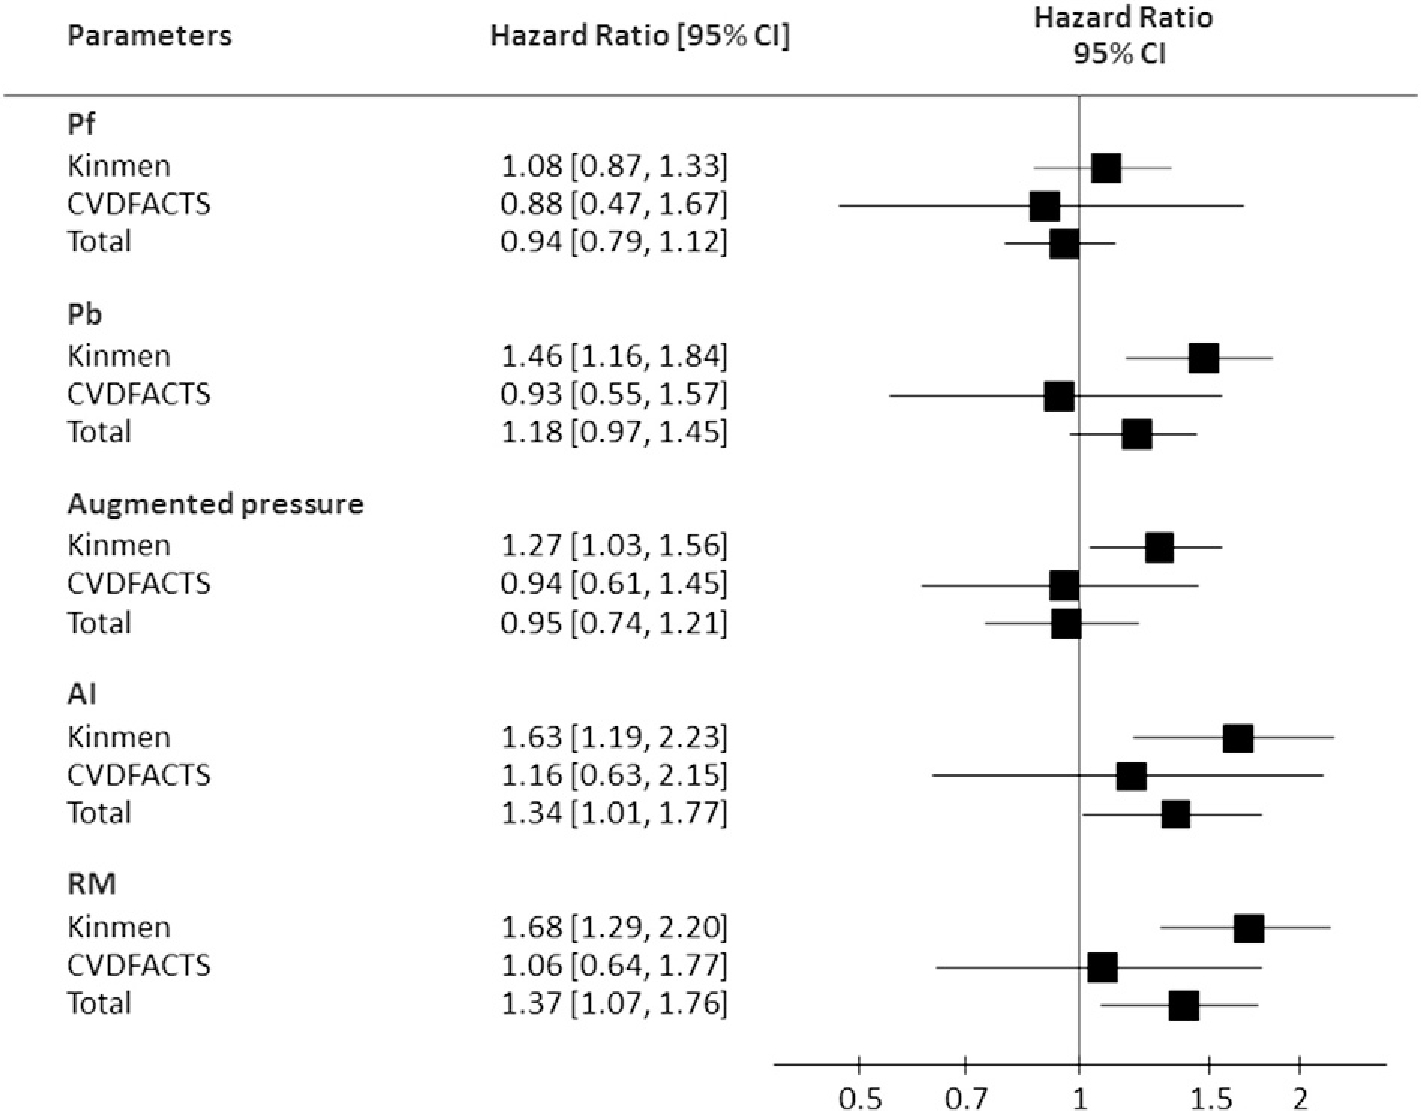
The hazard ratio (per standard deviation) of each pulse-wave-analysis derived mechanical biomarker by the wave transmission model in the multivariate Cox proportional hazards model accounting for age, gender, body mass index, systolic blood pressure, triglycerides, HDL-cholesterol, glucose, and smoking. AI = augmentation index; Pf = forward pressure amplitude; Pb = backward wave amplitude; RM = reflection magnitude.
Fig. 4.
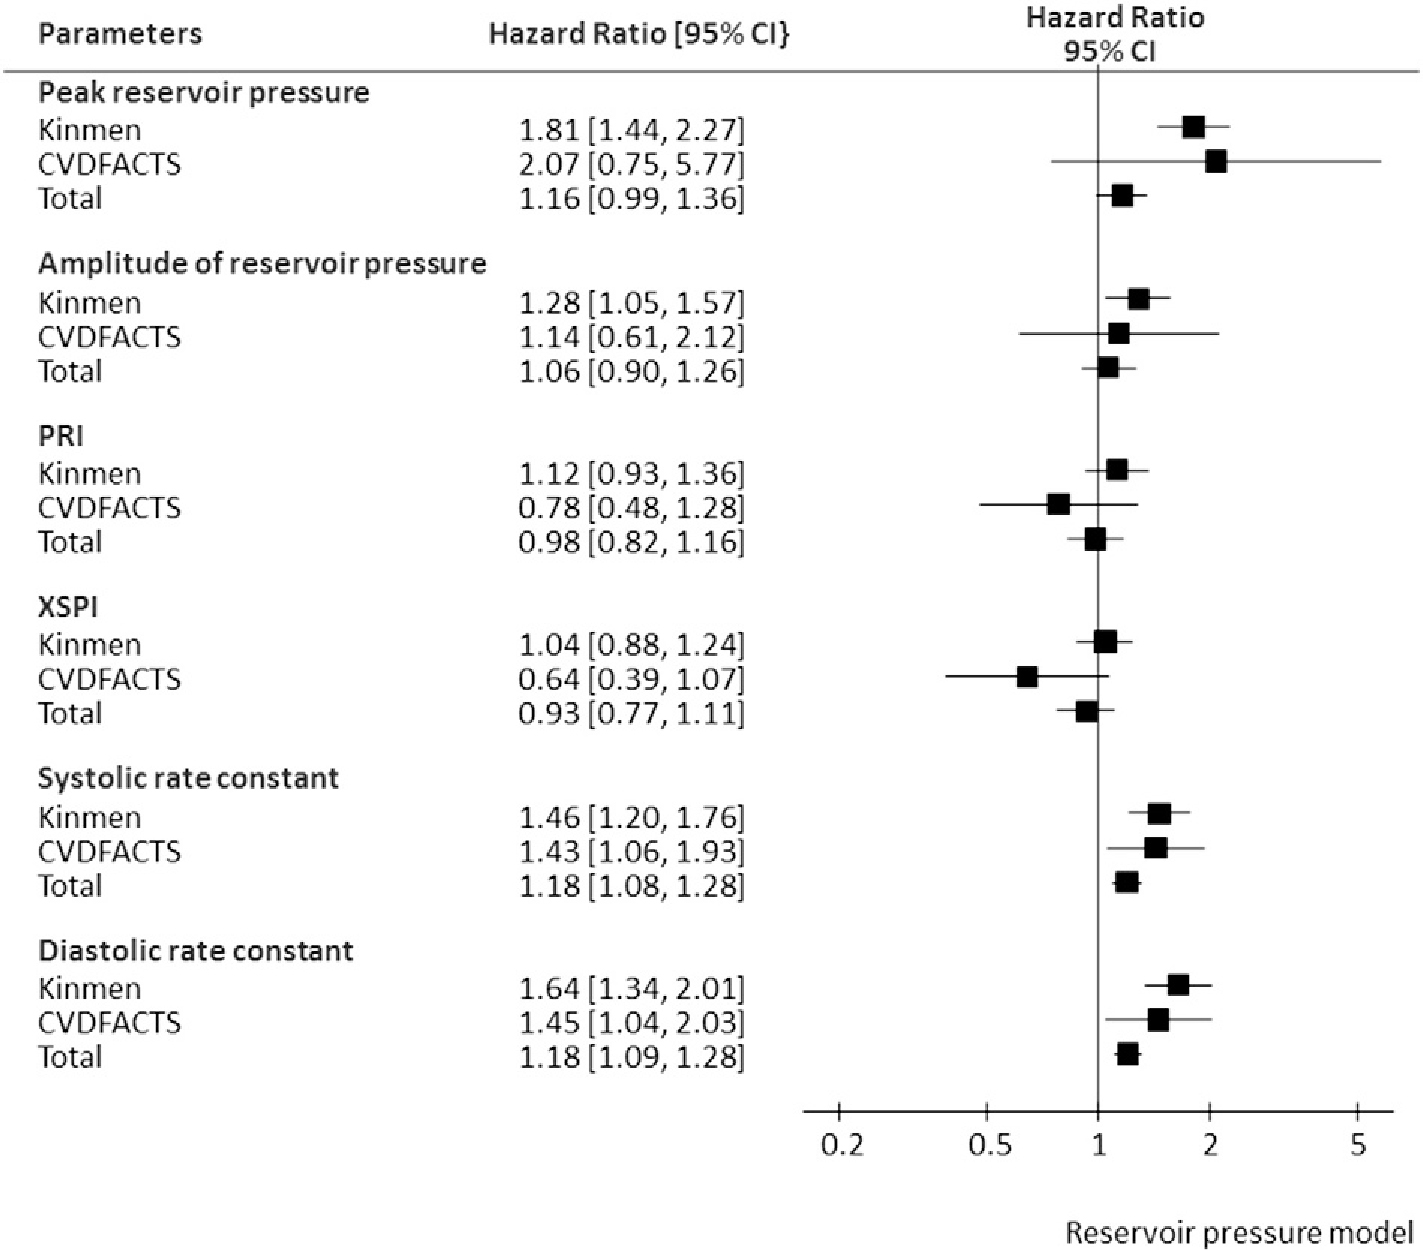
The hazard ratio (per standard deviation) of each pulse-wave-analysis derived mechanical biomarker by the reservoir pressure model in the multivariate Cox proportional hazards model accounting for age, gender, body mass index, systolic blood pressure, triglycerides, HDL-cholesterol, glucose, and smoking. PRI = reservoir pressure integral; XSPI = excess pressure integral.
The clinical utility of the PWA-derived biomarkers was then evaluated with NRI in the combined cohort. In the risk assessment for cardiovascular mortality, adding peak of reservoir pressure, SC, and DC into the above multivariate model resulted in significant net incremental improvement (Table 3).
Table 3.
The reclassification and discrimination of the risk prediction models by incorporating individual pulse-wave-analysis derived mechanical biomarkers in the combined cohort.
| Event NRI | No event NRI | Overall NRI | 95% confidence interval | p-Value | |
|---|---|---|---|---|---|
|
| |||||
| Pf | 0.000 | − 0.010 | −0.010 | −0.047–0.028 | 0.6164 |
| Pb | 0.009 | − 0.003 | 0.007 | −0.025–0.039 | 0.6848 |
| Augmented pressure | 0.000 | − 0.002 | −0.002 | − 0.006–0.001 | 0.1615 |
| AI | −0.019 | − 0.007 | −0.026 | − 0.053–0.001 | 0.0589 |
| RM | − 0.019 | − 0.007 | −0.026 | − 0.053–0.001 | 0.0621 |
| Peak of reservoir pressure | 0.037 | 0.011 | 0.049 | 0.003–0.094 | 0.0361 |
| Amplitude of reservoir pressure | 0.019 | − 0.002 | 0.017 | − 0.035–0.069 | 0.5249 |
| PRI | 0.000 | − 0.004 | −0.004 | − 0.063–0.054 | 0.8825 |
| XSPI | 0.028 | 0.004 | 0.032 | −0.017–0.081 | 0.2033 |
| Systolic rate constant | 0.037 | 0.005 | 0.043 | 0.006–0.080 | 0.0236 |
| Diastolic rate constant | 0.037 | 0.016 | 0.054 | 0.001–0.107 | 0.0469 |
NRI= net reclassification index.
Models were adjusted for age, sex, systolic blood pressure, body mass index, fasting glucose, triglycerides, low density-lipoprotein cholesterol, and high density-lipoprotein, alcohol, and smoking.
AI=augmentation index; Pf=forward pressure amplitude; Pb=backward wave amplitudes; PRI = reservoir pressure integral; RI = reflection index; RM = reflection magnitude; SBP = systolic blood pressure; SD = standard deviation; XSPI = excess pressure integral.
The subjects were classified by risk of less 2% for low, between 2% and 6% for middle and more than 6% for high CVD death risk group. Net reclassification index was test by 95% confidence intervals with two tails.
4. Discussion
In these two large prospective cohorts, the prognostic value and clinical utility of the mechanical biomarkers derived from pulse wave analysis based on wave transmission theory and arterial reservoir pressure model were systematically and comprehensively evaluated in an objective manner. These two studies are inception cohorts as subjects of the present study were free from any cardiovascular diseases and were not taking any cardiovascular medications at enrollment into the studies. Moreover, without the knowledge of the outcomes, all parameters for evaluation were obtained with a batch pulse wave analysis. In the combined cohort after accounting from the widely used cardiovascular risk factors, AI, RM, SC and DC of the reservoir pressure remained significantly for predicting cardiovascular mortality. Of all the PWA-derived biomarkers, only SC and DC could significantly predict cardiovascular mortality in both cohorts, and demonstrated significant reclassification clinical utility in the combined cohort.
4.1. Wave transmission theory
Although the prognostic significance of parameters derived from wave transmission theory has been evaluated in many studies, few studies addressed the clinical utility of these parameters. A previous systematic review has demonstrated that, despite the high heterogeneity, a 10% increase of central AI was associated with a RR of 1.264 for cardiovascular events and 1.384 for total mortality [34]. Our study findings agree with this review by showing that AI was associated with a hazard ratio of 1.34 (95% CI 1.01–1.77) in Fig. 3.
Conventional pulse wave analysis, based on wave transmission theory, involves investigation of pressure waves alone from the carotid artery, or radial and brachial artery with or without the use of a transfer function. In a recent position statement from the European Society of Cardiology Working group on peripheral circulation [35], using the surrogate endpoint criteria with 7 items, wave reflection by classic pulse wave analysis or wave separation analysis has been graded as Recommendation: IIb and Level of evidence: B. It was noted that the incremental prognostic value was less consistent in broader populations; some studies presented positive promising results [11,36], while there were still some negative associations being reported [37]. Our findings are in line with the above speculations: all wave reflection parameters were positively associated with adverse cardiovascular outcomes in the Kinmen study, but failed to reach statistical significance in the multivariate model in the CVDFACTS study. This position statement, however, had not addressed the usefulness of the arterial reservoir model, probably because it is presently a newly emerging and highly debated concept [38–42].
4.2. Arterial reservoir pressure
The arterial reservoir pressure was initially proposed to resolve the waveform differences between the pressure and flow waves of the human vascular system [13,38]. It is a time-domain approach based on the rationale that the volume-related pressure change (reservoir) is the major contributing factor to such waveform differences. Subsequently, this assertion was supported in a clinical study which invasively measured the arterial pressure waveform and Doppler flow velocity of the central aorta [43].
Two previous trials on hypertensive patients, ANBP2 [15] and ASCOT-CAFÉ studies [16], had examined the prognostic utility of the reservoir function. These studies demonstrated that the SC and XSPI could provide incremental prognostic value to conventional cardiovascular risk factors. In addition, in a heterogeneous high risk patient population, the amplitude of the reservoir pressure was shown to be a significant predictor for cardiovascular events [44]. Our study extended the prognostic utility of the arterial reservoir function to two community based population with long-term follow-up. Besides the very long-term follow-up duration, the strength of our study is that the independent prognostic value of the reservoir-wave model was not only noted in the Kinmen study, but also could be reproduced in another independent CVDFACTS cohort. These findings are physiologically plausible because deterioration of the arterial reservoir function is expected to produce a larger reservoir pressure wave with accelerated reservoir filling rate (increased SC) and faster reservoir emptying rate (increased DC) as presented in Fig. 2. In other words, with a constant inflow and outflow, the reduced arterial compliance should be characterized by a faster upslope and downslope change of the reservoir pressure wave. Moreover, the incremental prognostic value demonstrated by the reclassification analysis lends solid support to its clinical application of the arterial reservoir model. These findings suggest that the arterial reservoir function, as assessed by the reservoir pressure wave from the arterial reservoir model, contains important prognostic information that should be considered in arterial risk factors for CV mortality.
Although the arterial reservoir model provides a physiological interpretation for the central aortic pressure waveforms, it was argued in recent computer modeling studies [42,45], that the arterial reservoir model or the three-element Windkessel model is too simplified a model to be useful in complex clinical setting. In spite of the data presented above, the opponents of this concept also suggested that the discrepancy noted in the simulation studies does not necessarily preclude the application of the Windkessel or reservoir-wave paradigm from a clinical perspective [42]. Being inspired by the famous quote “Remember that all models are wrong; but some are useful” by Prof. George E.P. Box, we conducted the present study based on the concept of pragmatism. Indeed, through an objective, neutral, and rigorous analytic framework for all the PWA-derived biomarkers, we have demonstrated the incremental prognostic value and independent clinical utility of SC and DC in the two large prospective cohorts. Therefore, although refinement for the modeling to fit the complex clinical conditions might be warranted, we suggest that the reservoir-wave paradigm can be complimentary to the conventional wave transmission theory to refine the description of vascular conditions.
4.3. Clinical utility of PWA-derived mechanical biomarkers
Tremendous efforts have been made to introduce hemodynamic parameters beyond SBP and DBP into clinical practice [35]. With the acquisition of central pressure waveforms alone, our study supported the clinical application of the PWA technique to derive biomarkers that contain clinical imperative information. Moreover, as shown in Table 3, peak of reservoir pressure, SC and DC were useful to reclassify or discriminate the subjects with intermediate risk, predicted by the conventional multivariate model, into correct risk categorizations.
4.4. Disagreement with previous study findings
Disagreement between our results and that of previous studies is noted but may be apparent rather than real. In the ASCOT-CAFÉ study [16], XSPI was identified as the only independent predictor for cardiovascular events with a median 3.4 years of follow-up. The study, however, did not report the analysis on SC and DC. In addition, the arterial reservoir model in the ASCOT-CAFÉ study used radial pressure waveform for analysis, of which the XSPI is different from that of central aortic or central pressure curves. In the ANBP2 study, SC was found to be independently predictive of clinical outcome [15], but in a protective manner (hazard ratio, 0.33, 95% confidence interval 0.13–0.82). Moreover, the lack of association between DC and cardiovascular outcomes was also noted in the ANBP2 study. Such a disagreement is intriguing and hard to explicate. Theoretically, SC is inversely related to the product of aortic characteristic impedance and total arterial compliance, and DC is inversely related to the product of systemic arterial resistance and total arterial compliance (Appendix II). With vascular aging, the arterial system stiffens and is associated with decreased total arterial compliance and increased aortic characteristic impedance. Similarly, systematic arterial resistance and total arterial compliance may also have opposite changes with increasing blood pressure. Consequently, it is difficult to separate individual contributions of each constituent parameter, and SC and DC may reflect and represent the integrated characteristics of the vascular system, the arterial reservoir function. With a worsening reservoir function, faster filling and emptying of the arterial reservoir may result in poorer accommodation ability of the vascular system to physiological stress. In this regard, it is a reasonable speculation that the worsening reservoir function should be associated with a higher SC and the resultant higher peak and amplitude of reservoir pressure (Figs. 2 and 4), as well as a higher DC and the resultant lower DBP and poorer perfusion pressure to end organs (Fig. 2). Further studies should be conducted to confirm the above speculations.
4.5. Potential limitations of the present study
We calibrated the carotid pressure waveforms by using MBP and DBP obtained from the seated brachial BP measured with a standardized protocol. We have previously demonstrated that the measured brachial SBP and PP and the derived central SBP and PP were predictive of all-cause and cardiovascular mortality and were independent of traditional cardiovascular risk factors, pulse wave velocity, left ventricular mass index, carotid intima–media thickness, and estimated glomerular filtration rate [17], suggesting the validity of the blood pressure measurements. In addition, we also conducted a sensitivity analysis to evaluate the impact of different calibrating methods on the prognostic significance of these PWA-derived biomarkers, in which comparable results are shown (see Table S1).
4.6. Conclusion
Our study demonstrated that, in the combined cohorts, AI, RM, SC and DC were independent predictors of cardiovascular mortality even accounting for the widely used cardiovascular risk factors. However, of all PWA-derived mechanical biomarkers, the reservoir function related SC and DC were consistently identified as useful parameters for cardiovascular risk prediction in two independent prospective cohorts. These findings suggested that mechanical biomarkers derived from pulse wave analysis could not only independently predict the long-term cardiovascular risks beyond the traditional risk factors, but also provide a more accurate risk stratification by incorporating these mechanical biomarkers into the risk prediction models. The utilization of pulse wave analysis could therefore be a reasonable procedure in the daily clinical practice in future.
Supplementary Material
Acknowledgment
We are especially grateful to Prof. Kim H. Parker for providing the Matlab function to conduct the reservoir-wave analysis and his corresponding instructions regarding the data interpretation.
Source(s) of funding
This work was supported in part by a grant from the Ministry of Science and Technology (MOST 103–2314-B-010–012 -), an intramural grant from the Taipei Veterans General Hospital (Grant No. V104C-140), and the Intramural Research Program of the National Institute on Aging, National Institutes of Health (NO1-AG-1–2118).
Footnotes
Conflict(s) of interest/disclosure(s)
None.
Appendix A. Supplementary data
Supplementary data to this article can be found online at http://dx.doi.org/10.1016/j.ijcard.2016.04.070.
References
- [1].Cavalcante JL, Lima JA, Redheuil A, Al-Mallah MH, Aortic stiffness: current understanding and future directions, J. Am. Coll. Cardiol. 57 (2011) 1511–1522. [DOI] [PubMed] [Google Scholar]
- [2].Lewington S, Clarke R, Qizilbash N, Peto R, Collins R, Prospective Studies C, Age-specific relevance of usual blood pressure to vascular mortality: a meta-analysis of individual data for one million adults in 61 prospective studies, Lancet 360 (2002) 1903–1913. [DOI] [PubMed] [Google Scholar]
- [3].Kingwell BA, Waddell TK, Medley TL, Cameron JD, Dart AM, Large artery stiffness predicts ischemic threshold in patients with coronary artery disease, J. Am. Coll. Cardiol. 40 (2002) 773–779. [DOI] [PubMed] [Google Scholar]
- [4].Nichols WW, Denardo SJ, Johnson BD, Sharaf BL, Bairey Merz CN, Pepine CJ, Increased wave reflection and ejection duration in women with chest pain and nonobstructive coronary artery disease: ancillary study from the Women’s Ischemia Syndrome Evaluation, J. Hypertens. 31 (2013) 1447–1454 (discussion 54–5). [DOI] [PMC free article] [PubMed] [Google Scholar]
- [5].Hashimoto J, Nichols WW, O’Rourke MF, Imai Y, Association between wasted pressure effort and left ventricular hypertrophy in hypertension: influence of arterial wave reflection, Am. J. Hypertens. 21 (2008) 329–333. [DOI] [PubMed] [Google Scholar]
- [6].Hashimoto J, Imai Y, O’Rourke MF, Indices of pulse wave analysis are better predictors of left ventricular mass reduction than cuff pressure, Am. J. Hypertens. 20 (2007) 378–384. [DOI] [PubMed] [Google Scholar]
- [7].Weber T, Wassertheurer S, O’Rourke MF, Haiden A, Zweiker R, Rammer M, et al. , Pulsatile hemodynamics in patients with exertional dyspnea: potentially of value in the diagnostic evaluation of suspected heart failure with preserved ejection fraction, J. Am. Coll. Cardiol. 61 (2013) 1874–1883. [DOI] [PubMed] [Google Scholar]
- [8].Holland DJ, Sacre JW, Leano RL, Marwick TH, Sharman JE, Contribution of abnormal central blood pressure to left ventricular filling pressure during exercise in patients with heart failure and preserved ejection fraction, J. Hypertens. 29 (2011) 1422–1430. [DOI] [PubMed] [Google Scholar]
- [9].Verbeke F, Marechal C, Van Laecke S, Van Biesen W, Devuyst O, Van Bortel LM, et al. , Aortic stiffness and central wave reflections predict outcome in renal transplant recipients, Hypertension 58 (2011) 833–838. [DOI] [PubMed] [Google Scholar]
- [10].Gasecki D, Rojek A, Kwarciany M, Kubach M, Boutouyrie P, Nyka W, et al. , Aortic stiffness predicts functional outcome in patients after ischemic stroke, Stroke 43 (2012) 543–544. [DOI] [PubMed] [Google Scholar]
- [11].Wang KL, Cheng HM, Sung SH, Chuang SY, Li CH, Spurgeon HA, et al. , Wave reflection and arterial stiffness in the prediction of 15-year all-cause and cardiovascular mortalities: a community-based study, Hypertension 55 (2010) 799–805. [DOI] [PMC free article] [PubMed] [Google Scholar]
- [12].Zamani P, Jacobs DR Jr., Segers P, Duxprez DA, Brumback L, Kronmal RA, et al. , Reflection magnitude as a predictor of mortality: the Multi-Ethnic Study of Atherosclerosis, Hypertension 64 (2014) 958–964. [DOI] [PMC free article] [PubMed] [Google Scholar]
- [13].Wang JJ, O’Brien AB, Shrive NG, Parker KH, Tyberg JV, Time-domain representation of ventricular-arterial coupling as a windkessel and wave system, Am. J. Physiol. Heart Circ. Physiol. 284 (2003) H1358–H1368. [DOI] [PubMed] [Google Scholar]
- [14].Wang JJ, Flewitt JA, Shrive NG, Parker KH, Tyberg JV, Systemic venous circulation. Waves propagating on a windkessel: relation of arterial and venous windkessels to systemic vascular resistance, Am. J. Physiol. Heart Circ. Physiol. 290 (2006) H154–H162. [DOI] [PubMed] [Google Scholar]
- [15].Narayan O, Davies JE, Hughes AD, Dart AM, Parker KH, Reid C, et al. , Central aortic reservoir-wave analysis improves prediction of cardiovascular events in elderly hypertensives, Hypertension 65 (2015) 629–635. [DOI] [PMC free article] [PubMed] [Google Scholar]
- [16].Davies JE, Lacy P, Tillin T, Collier D, Cruickshank JK, Francis DP, et al. , Excess pressure integral predicts cardiovascular events independent of other risk factors in the conduit artery functional evaluation substudy of Anglo-Scandinavian Cardiac Outcomes Trial, Hypertension 64 (2014) 60–68. [DOI] [PMC free article] [PubMed] [Google Scholar]
- [17].Wang KL, Cheng HM, Chuang SY, Spurgeon HA, Ting CT, Lakatta EG, et al. , Central or peripheral systolic or pulse pressure: which best relates to target organs and future mortality? J. Hypertens. 27 (2009) 461–467. [DOI] [PMC free article] [PubMed] [Google Scholar]
- [18].Chen CH, Ting CT, Lin SJ, Hsu TL, Ho SJ, Chou P, et al. , Which arterial and cardiac parameters best predict left ventricular mass? Circulation 98 (1998) 422–428. [DOI] [PubMed] [Google Scholar]
- [19].Chuang SY, Bai CH, Chen JR, Yeh WT, Chen HJ, Chiu HC, et al. , Common carotid end-diastolic velocity and intima-media thickness jointly predict ischemic stroke in Taiwan, Stroke 42 (2011) 1338–1344. [DOI] [PubMed] [Google Scholar]
- [20].Chuang SY, Bai CH, Chen WH, Lien LM, Pan WH, Fibrinogen independently predicts the development of ischemic stroke in a Taiwanese population: CVDFACTS study, Stroke 40 (2009) 1578–1584. [DOI] [PubMed] [Google Scholar]
- [21].Benetos A, Tsoucaris-Kupfer D, Favereau X, Corcos T, Safar M, Carotid artery tonometry: an accurate non-invasive method for central aortic pulse pressure evaluation, J. Hypertens. 9 (Suppl. 6) (1991) S144–S145. [PubMed] [Google Scholar]
- [22].Kelly RP, Karamanoglu M, Gibbs H, Avolio AP, O’Rourke MF, Noninvasive carotid pressure wave registration as an indicator of ascending aortic pressure, J. Vasc. Med. Biol. 1 (1989) 241–247. [Google Scholar]
- [23].Chen CH, Ting CT, Nussbacher A, Nevo E, Kass DA, Pak P, et al. , Validation of carotid artery tonometry as a means of estimating augmentation index of ascending aortic pressure, Hypertension 27 (1996) 168–175. [DOI] [PubMed] [Google Scholar]
- [24].Roman MJ, Devereux RB, Kizer JR, Lee ET, Galloway JM, Ali T, et al. , Central pressure more strongly relates to vascular disease and outcome than does brachial pressure: the Strong Heart Study, Hypertension 50 (2007) 197–203. [DOI] [PubMed] [Google Scholar]
- [25].Mahieu D, Kips J, Rietzschel ER, De Buyzere ML, Verbeke F, Gillebert TC, et al. , Noninvasive assessment of central and peripheral arterial pressure (waveforms): implications of calibration methods, J. Hypertens. 28 (2010) 300–305. [DOI] [PubMed] [Google Scholar]
- [26].Pauca AL, O’Rourke MF, Kon ND, Prospective evaluation of a method for estimating ascending aortic pressure from the radial artery pressure waveform, Hypertension 38 (2001) 932–937. [DOI] [PubMed] [Google Scholar]
- [27].Takazawa K, Tanaka N, Takeda K, Kurosu F, Ibukiyama C, Underestimation of vasodilator effects of nitroglycerin by upper limb blood pressure, Hypertension 26 (1995) 520–523. [DOI] [PubMed] [Google Scholar]
- [28].Westerhof BE, Guelen I, Westerhof N, Karemaker JM, Avolio A, Quantification of wave reflection in the human aorta from pressure alone: a proof of principle, Hypertension 48 (2006) 595–601. [DOI] [PubMed] [Google Scholar]
- [29].Wang JJ, Shrive NG, Parker KH, Hughes AD, Tyberg JV, Wave propagation and reflection in the canine aorta: analysis using a reservoir-wave approach, Can. J. Cardiol. 27 (2011) 389.e1–389.e10. [DOI] [PubMed] [Google Scholar]
- [30].Wang JJ, Bouwmeester JC, Belenkie I, Shrive NG, Tyberg JV, Alterations in aortic wave reflection with vasodilation and vasoconstriction in anaesthetized dogs, Can. J. Cardiol. 29 (2013) 243–253. [DOI] [PubMed] [Google Scholar]
- [31].Pencina MJ, D’Agostino RB Sr., D’Agostino RB Jr., Vasan RS, Evaluating the added predictive ability of a new marker: from area under the ROC curve to reclassification and beyond, Stat. Med. 27 (2008) 157–172 (discussion 207–12). [DOI] [PubMed] [Google Scholar]
- [32].Kerr KF, McClelland RL, Brown ER, Lumley T, Evaluating the incremental value of new biomarkers with integrated discrimination improvement, Am. J. Epidemiol. 174 (2011) 364–374. [DOI] [PMC free article] [PubMed] [Google Scholar]
- [33].Leening MJ, Vedder MM, Witteman JC, Pencina MJ, Steyerberg EW, Net reclassification improvement: computation, interpretation, and controversies: a literature review and clinician’s guide, Ann. Intern. Med. 160 (2014) 122–131. [DOI] [PubMed] [Google Scholar]
- [34].Vlachopoulos C, Aznaouridis K, O’Rourke MF, Safar ME, Baou K, Stefanadis C, Prediction of cardiovascular events and all-cause mortality with central haemodynamics: a systematic review and meta-analysis, Eur. Heart J. 31 (2010) 1865–1871. [DOI] [PubMed] [Google Scholar]
- [35].Vlachopoulos C, Xaplanteris P, Aboyans V, Brodmann M, Cifkova R, Cosentino F, et al. , The role of vascular biomarkers for primary and secondary prevention. A position paper from the European Society of Cardiology Working Group on peripheral circulation: endorsed by the Association for Research into Arterial Structure and Physiology (ARTERY) Society, Atherosclerosis 241 (2015) 507–532. [DOI] [PubMed] [Google Scholar]
- [36].Chirinos JA, Kips JG, Jacobs DR Jr., Brumback L, Duprez DA, Kronmal R, et al. , Arterial wave reflections and incident cardiovascular events and heart failure: MESA (Multiethnic Study of Atherosclerosis), J. Am. Coll. Cardiol. 60 (2012) 2170–2177. [DOI] [PMC free article] [PubMed] [Google Scholar]
- [37].Mitchell GF, Hwang SJ, Vasan RS, Larson MG, Pencina MJ, Hamburg NM, et al. , Arterial stiffness and cardiovascular events: the Framingham Heart Study, Circulation 121 (2010) 505–511. [DOI] [PMC free article] [PubMed] [Google Scholar]
- [38].Tyberg JV, Bouwmeester JC, Parker KH, Shrive NG, Wang JJ, The case for the reservoir-wave approach, Int. J. Cardiol. 172 (2014) 299–306. [DOI] [PubMed] [Google Scholar]
- [39].Borlotti A, Park C, Parker KH, Khir AW, Reservoir and reservoir-less pressure effects on arterial waves in the canine aorta, J. Hypertens. 33 (2015) 564–574 (discussion 74). [DOI] [PubMed] [Google Scholar]
- [40].Westerhof N, Westerhof BE, The reservoir wave paradigm discussion, J. Hypertens. 33 (2015) 458–460. [DOI] [PubMed] [Google Scholar]
- [41].Westerhof N, Segers P, Westerhof BE, Wave separation, wave intensity, the reservoir-wave concept, and the instantaneous wave-free ratio: presumptions and principles, Hypertension 66 (2015) 93–98. [DOI] [PubMed] [Google Scholar]
- [42].Segers P, Taelman L, Degroote J, Bols J, Vierendeels J, The aortic reservoir-wave as a paradigm for arterial haemodynamics: insights from three-dimensional fluid–structure interaction simulations in a model of aortic coarctation, J. Hypertens. 33 (2015) 554–563 (discussion 63). [DOI] [PubMed] [Google Scholar]
- [43].Schultz MG, Davies JE, Hardikar A, Pitt S, Moraldo M, Dhutia N, et al. , Aortic reservoir pressure corresponds to cyclic changes in aortic volume: physiological validation in humans, Arterioscler. Thromb. Vasc. Biol. 34 (2014) 1597–1603. [DOI] [PubMed] [Google Scholar]
- [44].Hametner B, Wassertheurer S, Hughes AD, Parker KH, Weber T, Eber B, Reservoir and excess pressures predict cardiovascular events in high-risk patients, Int. J. Cardiol. 171 (2014) 31–36. [DOI] [PubMed] [Google Scholar]
- [45].Mynard JP, Penny DJ, Davidson MR, Smolich JJ, The reservoir-wave paradigm introduces error into arterial wave analysis: a computer modelling and in-vivo study, J. Hypertens. 30 (2012) 734–743. [DOI] [PubMed] [Google Scholar]
Associated Data
This section collects any data citations, data availability statements, or supplementary materials included in this article.