Abstract
The expression of alkaline phosphatase in response to phosphate starvation was shown to be spatially and temporally heterogeneous in bacterial biofilms and colonies. A commercial alkaline phosphatase substrate that generates a fluorescent, insoluble product was used in conjunction with frozen sectioning techniques to visualize spatial patterns of enzyme expression in both Klebsiella pneumoniae and Pseudomonas aeruginosa biofilms. Some of the expression patterns observed revealed alkaline phosphatase activity at the boundary of the biofilm opposite the place where the staining substrate was delivered, indicating that the enzyme substrate penetrated the biofilm fully. Alkaline phosphatase accumulated linearly with time in K. pneumoniae colonies transferred from high-phosphate medium to low-phosphate medium up to specific activities of 50 μmol per min per mg of protein after 24 h. In K. pneumoniae biofilms and colonies, alkaline phosphatase was initially expressed in the region of the biofilm immediately adjacent to the carbon and energy source (glucose). In time, the region of alkaline phosphatase expression expanded inward until it spanned most, but not all, of the biofilm or colony depth. In contrast, expression of alkaline phosphatase in P. aeruginosa biofilms occurred in a thin, sharply delineated band at the biofilm-bulk fluid interface. In this case, the band of activity never occupied more than approximately one-sixth of the biofilm. These results are consistent with the working hypothesis that alkaline phosphatase expression patterns are primarily controlled by the local availability of either the carbon and energy source or the electron acceptor.
Biofilms are known for their recalcitrance to antimicrobial agents. One of the mechanisms proposed to explain the enhanced resistance of microbial cells within biofilms is the existence of physiological differences between biofilm and planktonic cells (1). One physiological difference, starvation, is thought to play an important role in resistance to antimicrobial treatment. Jenkins et al. (6) reported that starvation protected planktonic Escherichia coli against a lethal dose of hydrogen peroxide. Another group of workers suggested that oxygen limitation reduced the efficacy of β-lactam antibiotics against agar-entrapped E. coli (18). Recently, McLeod and Spector (11) found that starved Salmonella serovars exhibited 200- to 1,500-fold-higher resistance to challenge with the antimicrobial peptide polymyxin B compared to nonstarving cells. Other workers (14, 21) have suggested that more extracellular polysaccharides are produced under starvation conditions. It is understandable that greater extracellular polysaccharide production may lead to more resistant biofilms. Although the observations described above were based on planktonic or agar-entrapped cells, it is plausible to postulate that microorganisms deep within a biofilm, where the chemical and physical microenvironment might be quite different from that in bulk liquid fluid, are physiologically distinct and less susceptible to disinfection. In particular, microorganisms in the interior of the biofilm might display reduced susceptibility since these bacteria grow more slowly than cells at the interface with bulk fluid (20). It is the link between starvation and biofilm resistance to disinfection that motivated this investigation of starvation responses in biofilms.
The structural and physiological heterogeneity of biofilms is now widely recognized (2, 5, 12, 17, 20). However, it is a significant challenge to document and visualize starving cells within biofilms. Reporter genes are commonly used to monitor gene expression. Starvation genes can be mutagenized by insertion of promoterless reporter genes, such as lacZ or lux, and environmentally regulated gene expression can then be studied by the detection of β-galactosidase or bioluminescence (8, 15). Unfortunately, reporter gene fusions, which are useful in studies of genetically engineered microorganisms, are not feasible in experiments performed with wild-type microorganisms. Using flow cytometry and membrane potential-sensitive dyes, López-Amorós et al. (10) monitored starvation of wild-type E. coli suspended in seawater. Flow cytometry is a promising tool for investigation and analysis of the complicated phenomena implicated in the starvation process when planktonic bacteria are studied. Comparable experiments might be done with biofilms by using cryoembedding and sectioning techniques (22) since this approach has been used to demonstrate physiological heterogeneities in sessile communities (5, 20). Radiolabeling and autoradiography have been used to determine spatial patterns of protein synthesis within bacterial colonies and immobilized cells (7, 16).
The goal of the work reported here was to investigate spatial patterns of starvation gene expression within bacterial biofilms. We hypothesized that such gene expression would be spatially and temporally heterogeneous and that it would be largely controlled by the local availability of an energy source and electron acceptor. Phosphate starvation was selected for this study because suitable fluorescent stains and substrates for the detection of the enzyme alkaline phosphatase (APase) are available. This enzyme is known to be a good indicator of phosphate deprivation.
MATERIALS AND METHODS
Bacterial strains and media.
Pure cultures of Klebsiella pneumoniae Kp1 were used in colony experiments. Pseudomonas aeruginosa ERC1 and K. pneumoniae KP1 were both used in pure-culture biofilm experiments. Both strains were isolated from the environment and obtained from the collection at the Center for Biofilm Engineering. MOPS (morpholinopropanesulfonic acid) minimal medium prepared as described by Neidhardt et al. (13) was used throughout this study. High-phosphate medium contained 1 g of Na2HPO4 per liter, while low-phosphate medium contained 0.01 g of Na2HPO4 per liter. Glucose at concentrations of 1 and 0.1 g/liter was used as the sole carbon source in solid and liquid media, respectively. Solid medium contained 1.5% Bacto Agar (Difco Laboratories, Detroit, Mich.).
Colony growth procedure.
Colonies were used for several reasons, including their fast growth, the fact that there was no sample number limitation, and the ease of switching between low- and high-phosphate media. Colonies were used to develop APase staining techniques. One 5-μl drop of K. pneumoniae from an overnight culture was inoculated onto each sterile black polycarbonate membrane filter (pore size, 0.2 μm; Poretics Corp., Livermore, Calif.), and the filters were placed on high-phosphate agar plates. The inoculated membrane filters were incubated at 35°C for 12 h to allow colonies to grow and then exposed to phosphate starvation conditions by moving them to low-phosphate agar plates. The nutrient diffused into the colony from the bottom, while oxygen came from the top (Fig. 1A). The colonies were sampled periodically for analysis.
FIG. 1.
Schematic diagram of the experimental setup for colony (A) and drip flow plate (B) biofilm reactors.
Biofilm growth procedure.
Drip flow plate reactors were used to cultivate biofilms. The reactor design used is illustrated in Fig. 1B. Stainless steel slides in a petri dish (100 by 15 mm) were bathed continuously with medium that dripped onto the slides at a flow rate of 50 ml per h. After inoculation with an overnight culture of K. pneumoniae or P. aeruginosa, the reactor was fed for 96 h with high-phosphate medium, which was then replaced with low-phosphate medium. Figure 1B shows that both nutrient and oxygen came from the top in the biofilm reactor system.
APase activity and total protein assay.
Colonies that accumulated on membrane filters were scraped into 1 ml of TEP solution (10 mM Tris-Cl [pH 8.0], 1 mM EDTA [pH 8.0], 1 mM phenylmethylsulfonyl fluoride). After the cells were disrupted by ultrasonication and after centrifugation, the supernatant was used for enzyme and total-protein assays. APase activity was determined by monitoring the rate of hydrolysis of the fluorogenic substrate fluorescein diphosphate (Molecular Probes, Eugene, Oreg.). The fluorescence intensity was measured with a model TD-700 fluorometer (Turner Designs, Sunnyvale, Calif.), and 10 μM fluorescein was used to standardize 500 fluorescent signal units. Changes in fluorescent signal units were monitored over a 5-min interval with a type c filter (excitation at 300 to 400 nm, emission at 410 to 600 nm). One unit of APase activity was defined as the quantity of APase that produced 1 μmol of fluorescein per min. Total protein was determined with a diagnostic kit (catalog no. 690; Sigma Chemical Co., St. Louis, Mo.).
ELF staining.
ELF-97 phosphatase substrate (Molecular Probes) is a water-soluble weakly blue fluorescent stain. Upon cleavage by APase, this substrate yields a bright yellow-green fluorescent precipitate, ELF-97 alcohol, that exhibits excellent photostability. Therefore, bacterial cells expressing APase and bacterial cells not expressing APase can be simultaneously visualized (yellow-green and blue fluorescence, respectively) by epifluorescence microscopy. For colony staining, membrane filters with colonies were placed on cellulose pads (3 by 3 cm) saturated with 1 ml of enzyme-labeled fluorescence (ELF) solution which was prepared as recommended by the manufacturer. The colonies were incubated in the dark at 37°C for 30 min and then fixed by placing the membranes on different pads containing 1% formaldehyde for 5 min. For biofilm staining, slides with accumulated sessile growth were submerged in ELF solution, kept in the dark at 37°C for 30 min, and then fixed with 1% formaldehyde.
Cryoembedding and cryosectioning.
Colony or biofilm samples were cryoembedded with Tissue-Tek OCT compound (Miles Inc., Elkhart, Ind.) as described previously (20, 22). Embedded samples were sectioned with a model CM 1800 cryostat (Leica Inc., Deerfield, Ill.). The 5-μm-thick sections were mounted on Superfrost Plus microscopic slides (Fisher Scientific, San Francisco, Calif.).
Microscopy.
A model BH-2 microscope (Olympus, Lake Success, N.Y.) with epifluorescence illumination was used to examine biofilm or colony sections. After ELF staining, weak blue fluorescence and intense yellow-green fluorescence were visualized with an Olympus type U filter cubic unit equipped with an excitation filter (type UG-1), a dichroic mirror (type DM-400), and a barrier filter (type L-420). Due to the great difference between blue fluorescence intensity and yellow-green fluorescence intensity, biofilm sections were counterstained with 5 μl of a solution containing 10 mg of propidium iodide per liter to improve the contrast in the photographs. After propidium iodide counterstaining, cells with APase activity exhibited yellow-green fluorescence, while the control cells appeared red under the type U filter.
Image analysis.
The excitation spectrum of tetramethylrhodamine (TMR) dyes is quite different from the excitation spectrum of the ELF-97 alcohol (4). Thus, ELF signals and the red fluorescence of TMR can be visualized sequentially with the appropriate optical filter sets. After sections were counterstained with 5 μl of TMR ethyl ether (1 mg per liter; Molecular Probes) for 1 min, only cells containing APase could be captured with an Olympus type U filter cubic unit, while cells with APase and cells without APase were captured with an Olympus type G filter cubic unit. The type G filter cubic unit contains an excitation filter (type BP-545), a dichroic mirrortype (DM-570), and a barrier filtertype (O-590). The images captured at the same spot by the different filters were digitized with a cooled color charge-coupled device camera (Optronics, Goleta, Calif.) and were saved as 8-bit gray scale TIFF files. Half-tone images were created by overlapping the two images with Corel Draw 5.0 software (Corel Corporation, Ottawa, Ontario, Canada). The fluorescence intensity was also determined with MARK image analysis software (3).
RESULTS
APase activity of K. pneumoniae colonies.
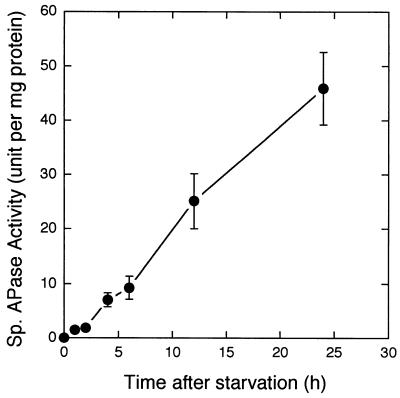
APase accumulated after 12-h-old K. pneumoniae colonies were moved from high-phosphate agar plates to low-phosphate agar plates. APase activity increased approximately linearly with time during prolonged phosphate starvation (Fig. 2). Pulse-chase-pulse experimental results (data not shown) also indicated that APase activity increased during low-phosphate growth, then decreased when the organisms were moved back to high-phosphate medium, and then increased when they were exposed to low-phosphate medium again. These results demonstrated that phosphate starvation induced APase expression.
FIG. 2.
APase activity within K. pneumoniae colonies in response to phosphate starvation.
APase expression within K. pneumoniae colonies.
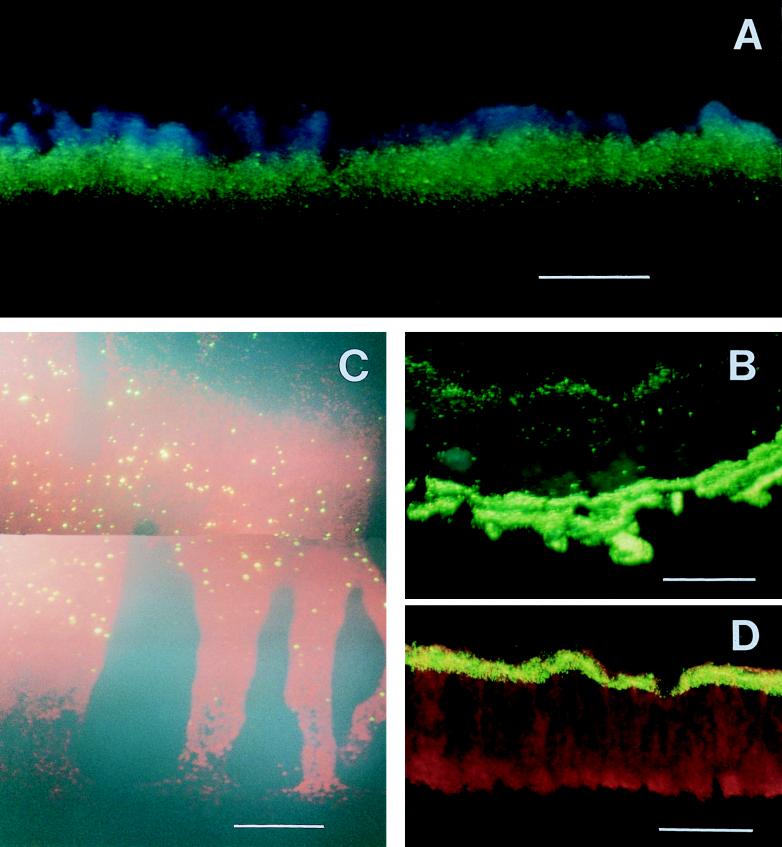
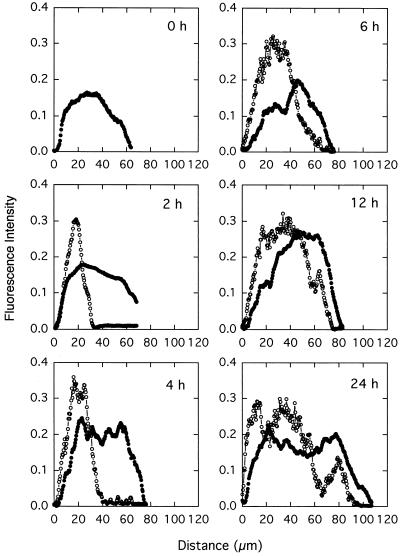
Temporally and spatially nonuniform patterns of APase expression were observed when K. pneumoniae colonies were subjected to phosphate starvation. A representative color photomicrograph of phosphatase expression within a K. pneumoniae colony is shown in Fig. 3A. APase activity was visualized as a band of green fluorescence. APase activity in this case was detected in the one-half or two-thirds of the colony biomass adjacent to the agar. Time sequences of the spatial patterns of phosphatase expression within K. pneumoniae colonies during starvation are presented as half-tone images in Fig. 4. The gray areas indicate cells without APase activity, while the black areas represent cells with APase activity. There were no cells containing APase before the colonies were exposed to phosphate starvation. As starvation proceeded, a band of APase activity started to appear near the substratum (agar side). The band of APase expression expanded toward the tops of colonies with increasing starvation time. Image analysis was used to define this progression in a quantitative rather than visual format (Fig. 5). The biofilm thickness, as determined by the dimension of the TMR-stained region, increased from about 60 to 110 μm during starvation. The band of yellow-green fluorescence (APase-positive cells) increased from about 30 μm thick after 2 h of starvation until it spanned almost the entire colony at the end of experiment. The yellow appearance is thought to occur as a result of combined red and green emissions of similar intensities.
FIG. 3.
Photomicrographs of biofilm cross sections stained for APase activity (green or yellow). (A) K. pneumoniae colony after 4 h of starvation. (B) K. pneumoniae colony after pulse-chase-pulse experiment. (C) K. pneumoniae biofilm after 24 h of starvation. (D) P. aeruginosa biofilm after 12 h of starvation. The images are orientated with the substratum at the bottom. Bars = 50 μm.
FIG. 4.
Half-tone images of APase expression in cross sections of K. pneumoniae colonies in response to phosphate starvation for 0 h (A), 2 h (B), 4 h (C), 6 h (D), 12 h (E), and 24 h (F). The black areas indicate cells containing APase activity, while the gray areas indicate cells without APase expression. In each image the substratum is at the bottom and the air side is at the top.
FIG. 5.
Image analysis of APase expression at representative locations within cross sections of K. pneumoniae colonies in response to phosphate starvation. Symbols: ○, APase-positive cells; •, all cells. A distance of zero indicates the interface of the colony and the agar substratum.
One possible explanation for the nonuniform staining pattern observed is that the fluorogenic enzyme substrate was simply not penetrating the colony fully. This explanation cannot account for the observation that K. pneumoniae colonies subjected to prolonged (24-h) phosphate starvation developed APase activity throughout most of the depth of the colony. Colonies exposed to 24 h of phosphate starvation and colonies exposed to 2 h of phosphate starvation were stained by an identical protocol, but exhibited different activity patterns. To further investigate whether spatial patterns of phosphatase activity like those shown in Fig. 3 through 5 were due to restricted diffusion of the fluorogenic stain, pulse-chase-pulse experiments were carried out. Colonies were grown on high-phosphate agar plates for 12 h, transferred to low-phosphate agar for 6 h, moved back to high-phosphate agar for 18 h, and then finally exposed to low-phosphate agar again for 6 h. Assuming that induction occurred preferentially in actively growing cells at the colony edge, this protocol should have generated two bands of APase activity separated by a region of low or no APase activity (7, 16). The presence of distinct fluorescent bands along both boundaries of a pulse-chase-pulse-treated colony (Fig. 3B) showed that there was no diffusion limitation of the phosphatase staining substrate in the K. pneumoniae system.
APase expression within K. pneumoniae biofilms.
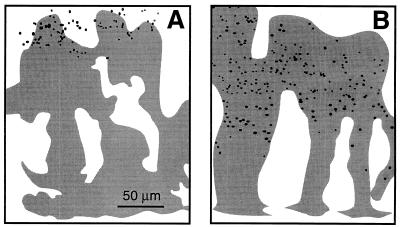
APase was induced after K. pneumoniae biofilms grown in high-phosphate medium for 96 h were transferred to low-phosphate medium. APase-positive cells appeared near the biofilm-bulk fluid interface within 8 h (Fig. 6A) and were present in most of the biofilm after 24 h (Fig. 3C and 6B). After 24 h under low-phosphate growth conditions, APase activity was distributed approximately uniformly throughout the biofilm except near the substratum, where activity was not detected. This pattern is similar to that observed in K. pneumoniae colonies, except that in the case of the biofilm the development of APase activity proceeded from the biofilm-fluid interface down rather than from the substratum up. In both cases, APase activity first developed at the edge of the microbial aggregate that was exposed to glucose and in 24 h spread outward from this edge through most, but not all, of the microbial aggregate. In the biofilm, APase activity extended to a greater depth but appeared to be less intense than in the colonies.
FIG. 6.
Half-tone images of APase expression within cross sections of K. pneumoniae real biofilms in response to phosphate starvation for 8 h (A) and 24 h (B). The black areas indicate cells containing APase activity, while the gray areas indicate cells without APase. In each image the substratum is at the bottom and the bulk liquid phase is at the top.
APase expression within P. aeruginosa biofilms.
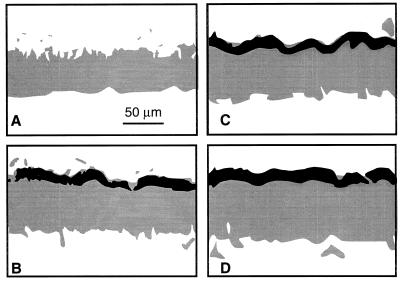
When P. aeruginosa biofilms were subjected to low-phosphate medium, APase activity was expressed in a well-defined band immediately adjacent to the biofilm-bulk fluid interface (Fig. 3D and 7). The thickness of this band increased slightly with prolonged starvation, but even after 36 h of exposure to low-phosphate medium, the band of APase activity represented only approximately one-sixth of the biofilm thickness (Fig. 7D).
FIG. 7.
Half-tone images of APase expression within cross sections of P. aeruginosa real biofilms in response to phosphate starvation for 0 h (A), 12 h (B), 24 h (C), and 36 h (D). The black areas indicate cells containing APase activity, while the gray areas indicate cells without APase activity. In each image the substratum is at the bottom and the bulk liquid phase is at the top.
DISCUSSION
Distinct spatial patterns of APase expression developed in bacterial colonies and biofilms in response to phosphate starvation. The patterns of expression observed depended on the microorganism used and on the location of the nutrient. We hypothesize that these patterns and the differences between them are explained largely by the local availability of a carbon and energy source or electron acceptor.
Expression of APase requires phosphate limitation and de novo protein synthesis, a process that consumes carbon and energy in significant quantities (19). A bacterium within a biofilm that experiences phosphate starvation but does not have access to the nutrient and/or electron acceptors necessary to fuel protein synthesis is not able to express APase in significant quantities. On the other hand, a bacterium within a region of a biofilm with sufficient carbon and energy expresses APase very strongly in response to phosphate starvation.
The spatial patterns of APase expression observed in our biofilm and colony experiments are qualitatively consistent with the known metabolic activities of the organisms used and with the widely recognized phenomenon of mass transfer limitation of nutrient delivery in microbial aggregates. K. pneumoniae is a facultative microorganism that can conserve energy by either fermentation or respiration. Provided that no nitrate is present, P. aeruginosa is an obligate aerobe.
In the case of K. pneumoniae colonies, the nutrients (in particular, glucose) were provided from the bottom (agar side), while air came from the top (air side). When colonies were moved from a high-phosphate environment to a low-phosphate environment, all of the cells within colonies experienced phosphate starvation. Hence, the production of APase started near the agar substratum due to the immediately reduced availability of exogenous phosphate, while the organism was exposed to other nutrients, including a carbon source, in the agar medium. Oxygen limitation was probably not important in this case since the energy required for APase biosynthesis could be provided through fermentation. In time, nutrients diffused upward, and the band of APase expression expanded toward the tops of the colonies. This progression was probably controlled by the mass transfer-limited penetration of the carbon and energy source (glucose) into the colony.
A qualitatively identical progression was observed in K. pneumoniae biofilms. In this case the development started at the biofilm-bulk fluid interface rather than at the substratum. In both cases, however, the development of APase activity in the biofilms was consistent with a mass transfer-limited supply of glucose. The differences observed in the staining intensities and the dimensions of the stained regions between K. pneumoniae biofilms and colonies may have been due to lower cell densities in the biofilms, which should have allowed greater penetration of glucose but also resulted in less intense staining. Nutrients may also penetrate into a biofilm more effectively via water channels that facilitate convective transport. Putative water channels are evident in Fig. 3C.
In the case of P. aeruginosa biofilms, we hypothesize that the sharply delinated band of APase activity induced after phosphate starvation was determined by oxygen limitation rather than glucose limitation. This hypothesis is based on the known growth stoichiometry of P. aeruginosa cultures and the previous findings that there are oxygen concentration gradients in similar biofilms (2, 9). This band of activity was thinner than the bands of activity observed with K. pneumoniae, perhaps because the limited solubility of oxygen in water reduced the thickness of the growing zone in the biofilm.
We developed methods to map patterns of APase expression in biofilms following a period of phosphate starvation and found that these patterns are spatially and temporally heterogeneous. Our results support the working hypothesis that the pattern of gene expression is largely controlled by the metabolic activity of the microorganisms and the local availability of carbon and energy sources. Our particular interest in this information is further elucidation of the mechanisms causing biofilm-reduced susceptibility to antimicrobial agent challenge, but the results have broad significance for the microbial ecology of biofilm communities as well. The APase staining technique could also be readily adapted for use with strains carrying phoA reporter gene fusions.
ACKNOWLEDGMENTS
This work was supported through cooperative agreement EEC-8907039 between the National Science Foundation and Montana State University and by the industrial partners of the Center for Biofilm Engineering.
REFERENCES
- 1.Brown M R W, Gilbert P. Sensitivity of biofilms to antimicrobial agents. J Appl Bacteriol Symp Suppl. 1993;74:87S–97S. doi: 10.1111/j.1365-2672.1993.tb04345.x. [DOI] [PubMed] [Google Scholar]
- 2.de Beer D, Stoodley P, Lewandowski Z. Effects of biofilm structures on oxygen distribution and mass transport. Biotechnol Bioeng. 1994;43:1131–1138. doi: 10.1002/bit.260431118. [DOI] [PubMed] [Google Scholar]
- 3.Harkin G, Shope P. The Mark image analysis system. Technical report. Bozeman: Center for Biofilm Engineering, Montana State University; 1993. [Google Scholar]
- 4.Haugland R P. Handbook of fluorescent probes and research chemicals. 6th ed. Eugene, Oreg: Molecular Probes, Inc.; 1996. p. 118. [Google Scholar]
- 5.Huang C-T, Yu F P, McFeters G A, Stewart P S. Nonuniform spatial patterns of respiratory activity within biofilms during disinfection. Appl Environ Microbiol. 1995;61:2252–2256. doi: 10.1128/aem.61.6.2252-2256.1995. [DOI] [PMC free article] [PubMed] [Google Scholar]
- 6.Jenkins D E, Schultz J E, Martin A. Starvation-induced cross protection against heat or H2O2 challenge in Escherichia coli. J Bacteriol. 1988;170:3910–3914. doi: 10.1128/jb.170.9.3910-3914.1988. [DOI] [PMC free article] [PubMed] [Google Scholar]
- 7.Karel S F, Robertson C R. Autoradiographic determination of mass-transfer limitations in immobilized cell reactors. Biotechnol Bioeng. 1989;34:320–336. doi: 10.1002/bit.260340307. [DOI] [PubMed] [Google Scholar]
- 8.Kragelund L, Christoffersen B, Nybroe O, de Bruijn F J. Isolation of lux reporter gene fusion in Pseudomonas fluorescens DF57 inducible by nitrogen or phosphorus starvation. FEMS Microbiol Ecol. 1995;17:95–106. [Google Scholar]
- 9.Lewandowski Z. Dissolved oxygen gradients near microbially colonized surfaces. In: Geesey G G, Lewandowski Z, Flemming H C, editors. Biofouling and biocorrosion in industrial water systems. Boca Raton, Fla: Lewis Publisher; 1994. pp. 175–188. [Google Scholar]
- 10.López-Amorós R, Mason D J, Lloyd D. Use of two oxonols and a fluorescent tetrazolium dye to monitor starvation of Escherichia coli in seawater by flow cytometry. J Microbiol Methods. 1995;22:165–176. [Google Scholar]
- 11.McLeod G I, Spector M P. Starvation- and stationary-phase-induced resistance to the antimicrobial peptide polymyxin B in Salmonella typhimurium is RpoS (ς(S)) independent and occurs through both phoP-dependent and -independent pathways. J Bacteriol. 1996;178:3683–3688. doi: 10.1128/jb.178.13.3683-3688.1996. [DOI] [PMC free article] [PubMed] [Google Scholar]
- 12.Murga R, Stewart P S, Daly D. Quantitative analysis of biofilm thickness variability. Biotechnol Bioeng. 1995;45:503–510. doi: 10.1002/bit.260450607. [DOI] [PubMed] [Google Scholar]
- 13.Neidhardt F C, Bloch P L, Smith D F. Culture medium for enterobacteria. J Bacteriol. 1974;119:736–747. doi: 10.1128/jb.119.3.736-747.1974. [DOI] [PMC free article] [PubMed] [Google Scholar]
- 14.Schlictman D, Kavanaugh-Black A, Shankar S, Chakrabarty A M. Energy metabolism and alginate biosynthesis in Pseudomonas aeruginosa: role of the tricarboxylic acid cycle. J Bacteriol. 1994;176:6023–6029. doi: 10.1128/jb.176.19.6023-6029.1994. [DOI] [PMC free article] [PubMed] [Google Scholar]
- 15.Shin P K, Seo J-H. Analysis of E. coli pho-lacZ fusion gene expression inserted into a multicopy plasmid and host cell’s chromosome. Biotechnol Bioeng. 1990;36:1097–1104. doi: 10.1002/bit.260361104. [DOI] [PubMed] [Google Scholar]
- 16.Stewart P S, Karel S F, Robertson C R. Characterization of immobilized cell growth rates using autoradiography. Biotechnol Bioeng. 1991;37:824–833. doi: 10.1002/bit.260370906. [DOI] [PubMed] [Google Scholar]
- 17.Stewart P S, Camper A K, Handran S D, Huang C-T, Warnecke M. Spatial distribution and coexistence of Klebsiella pneumoniae and Pseudomonas aeruginosa in biofilms. Microb Ecol. 1997;33:2–10. doi: 10.1007/s002489900002. [DOI] [PubMed] [Google Scholar]
- 18.Tresse O, Jouenne T, Junter G-A. The role of oxygen limitation in the resistance of agar-entrapped, sessile-like Escherichia coli to aminoglycoside and beta-lactam antibiotics. J Antimicrob Chemother. 1995;36:521–526. doi: 10.1093/jac/36.3.521. [DOI] [PubMed] [Google Scholar]
- 19.Wanner B L. Phosphorus assimilation and control of the phosphate regulation. In: Neidhardt F C, editor. Escherichia coli and Salmonella: cellular and molecular biology. Washington, D.C: ASM Press; 1996. pp. 1357–1381. [Google Scholar]
- 20.Wentland E J, Stewart P S, Huang C-T, McFeters G A. Spatial variations in growth rate within Klebsiella pneumoniae colonies and biofilm. Biotechnol Prog. 1996;12:316–321. doi: 10.1021/bp9600243. [DOI] [PubMed] [Google Scholar]
- 21.Wrangstadh M, Szewzyk U, Ostling J, Kjelleberg S. Starvation-specific formation of a peripheral exopolysaccharide by a marine Pseudomonas sp., strain S9. Appl Environ Microbiol. 1990;56:2065–2072. doi: 10.1128/aem.56.7.2065-2072.1990. [DOI] [PMC free article] [PubMed] [Google Scholar]
- 22.Yu F P, Callis G M, Stewart P S, Griebe T, McFeters G A. Cryosectioning of biofilm for microscopic examination. Biofouling. 1994;8:85–91. [Google Scholar]


