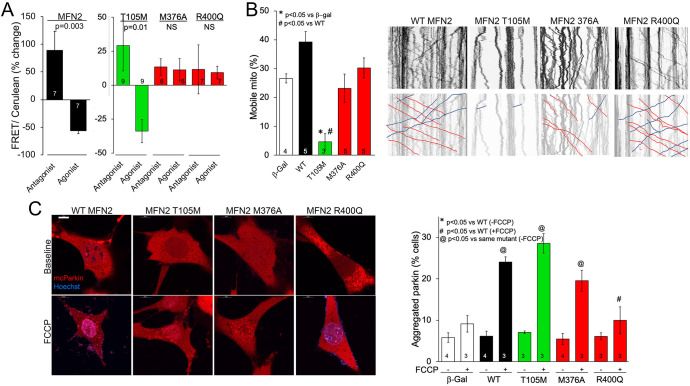
Figure 3. MFN2 R400Q impairs conformational shifting and suppresses mitochondrial Parkin recruitment, but not mitochondrial motility in neuronal axons.
(A) Forster resonance energy transfer (FRET) studies of conformational switching in disease-linked MFN2 mutants expressed in MFN double knockout (DKO) murine embryonic fibroblasts (MEFs). Antagonist peptide normally induces closed conformation (increase in FRET) and agonist peptide open conformation (decrease in FRET). (B) Mitochondrial motility in cultured mouse dorsal root ganglion neuronal processes: representative kymographs are to the right (raw data above; motile mitochondrial emphasized below [red, antegrade; blue, retrograde]).Scale bar 10 μm, Data are n~3 5 DRGs for each independent experiment, statistic is one-way ANOVA. (C) mcParkin (red) recruitment to mitochondria in MFN DKO MEFs expressing MFN2 mutants before (baseline) and after FCCP (left, representative confocal micrographs; right, group quantitative data). p-Values calculated using ANOVA and Tukey’s test.


