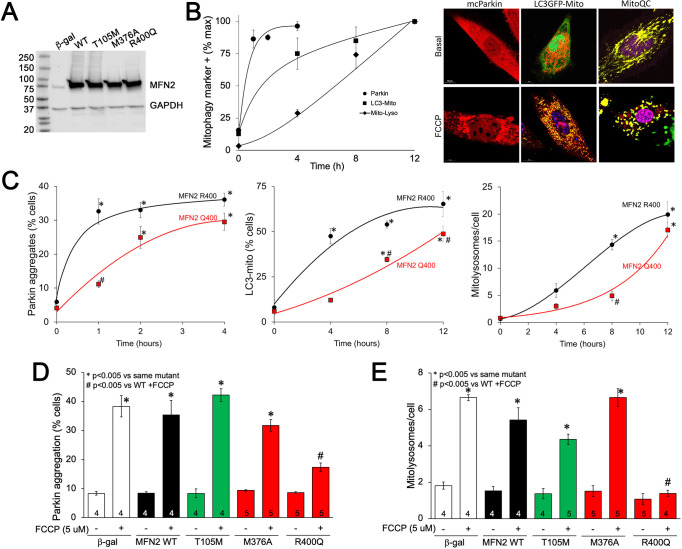
Figure 6. MFN2 Q400 uniquely suppresses early and late mitophagy in cardiomyoblasts.
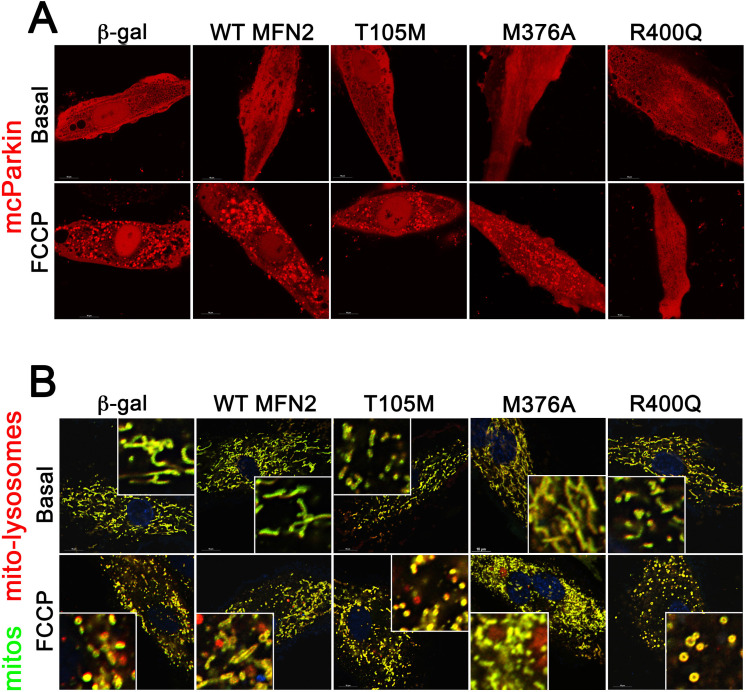
(A) Adenoviral expression of MFN2s in H9c2 cells. (B) Time courses of mitochondrial Parkin aggregation (circles), mitochondrial engulfment by autophagosomes (squares), and mitochondrial delivery to lysosomes (diamonds) in WT MFN2-expressing H9c2 cells after FCCP stimulation. Representative images are to the right. (C) Comparative time courses for mitochondrial Parkin aggregation (left), mitochondrial engulfment by autophagosomes (middle), and mitochondrial delivery to lysosomes (right) in MFN2 WT (black) and Q400 (red) expressing H9c2 cells. n = 3–4, *p<0.05 vs. pre-FCCP (time 0); #p<0.05 vs. WT at same time point (two-way ANOVA). (D, E) mcParkin aggregation 1 hr after FCCP treatment (D) and mitolysosome formation 8 hr after FCCP treatment (E) of H9c2 cells transduced with MFNs. Experimental n is shown in bars; stats by two-way ANOVA. Representative confocal images are shown in Figure 6—figure supplement 1.


