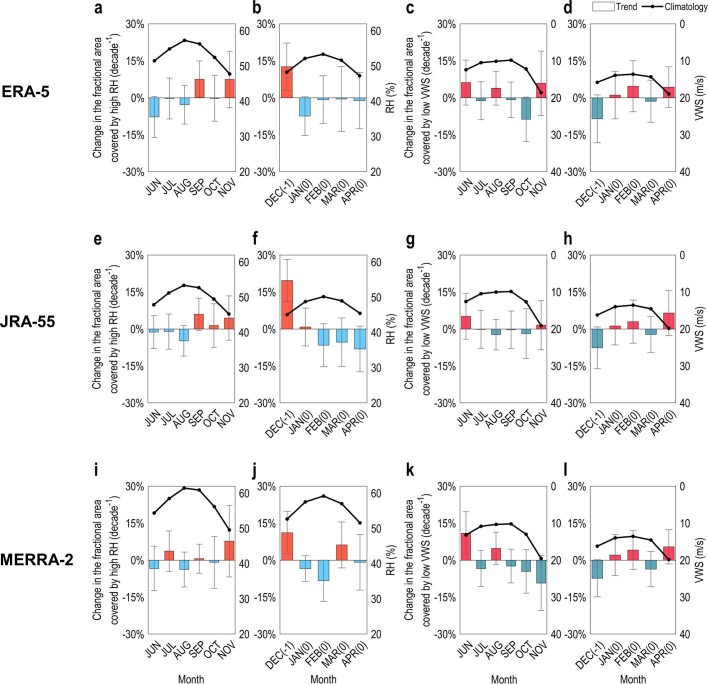
Extended Data Fig. 4. Observed changes in the seasonal cycle of atmospheric conditions based on different reanalyses.
For (up) with the atmospheric variables from the ERA-5, (middle) JRA-55, and (bottom) MERRA-2 datasets. a, b, The climatological mean value of relative humidity (RH; solid line) and the linear trend of the fractional area covered by high RH (bar; see Environmental factors of the Methods) in each month during the active season during 1981–2017 obtained from the ERA-5 reanalysis dataset in the (a) NH, and (b) SH. The error bars indicate the 95% confidence intervals in the linear regression analysis. c, d, The climatological mean value of vertical wind shear (VWS; solid line) and the linear trend of the fractional area covered by low VWS (bar; “Environmental factors”) in each month during the active season during 1981–2017 obtained from the ERA-5 reanalysis dataset in the (c) NH, and (d) SH. e–h, Same as in a–d, respectively, but based on the JRA-55 dataset. i–l, Same as in a–d, respectively, but based on the MERRA-2 dataset.

