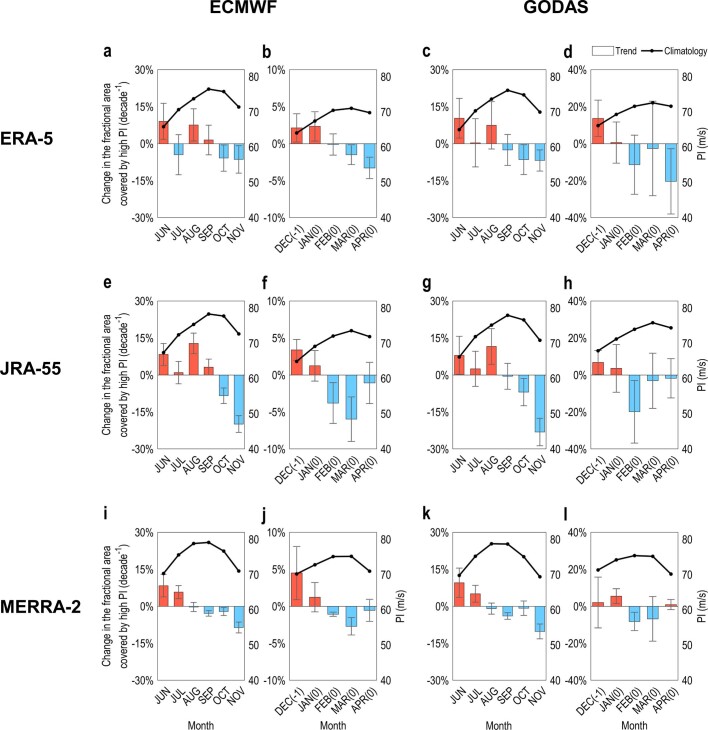
Extended Data Fig. 5. Changes in the fractional area covered by high PI based on different reanalyses.
For (left) with the oceanic variables from the ECMWF, and (right) GODAS datasets. For (up) with the atmospheric variables from the ERA-5, (middle) JRA-55, and (bottom) MERRA-2 datasets. a, b, The climatological value of PI (solid line) and the linear trend of the fractional area covered by high PI during the active season during 1981–2017 in the (a) NH, and (b) SH based on the oceanic variables from the ECMWF dataset and the atmospheric variables from the ERA-5 dataset. The error bars indicate the standard deviation. c-d, Same as in a-b, respectively, but based on the oceanic variables from the GODAS dataset. e–h, Same as in a–d, respectively, but based on the atmospheric variables from the JRA-55 dataset. i–l, Same as in a–d, respectively, but based on the atmospheric variables from the MERRA-2 dataset.

