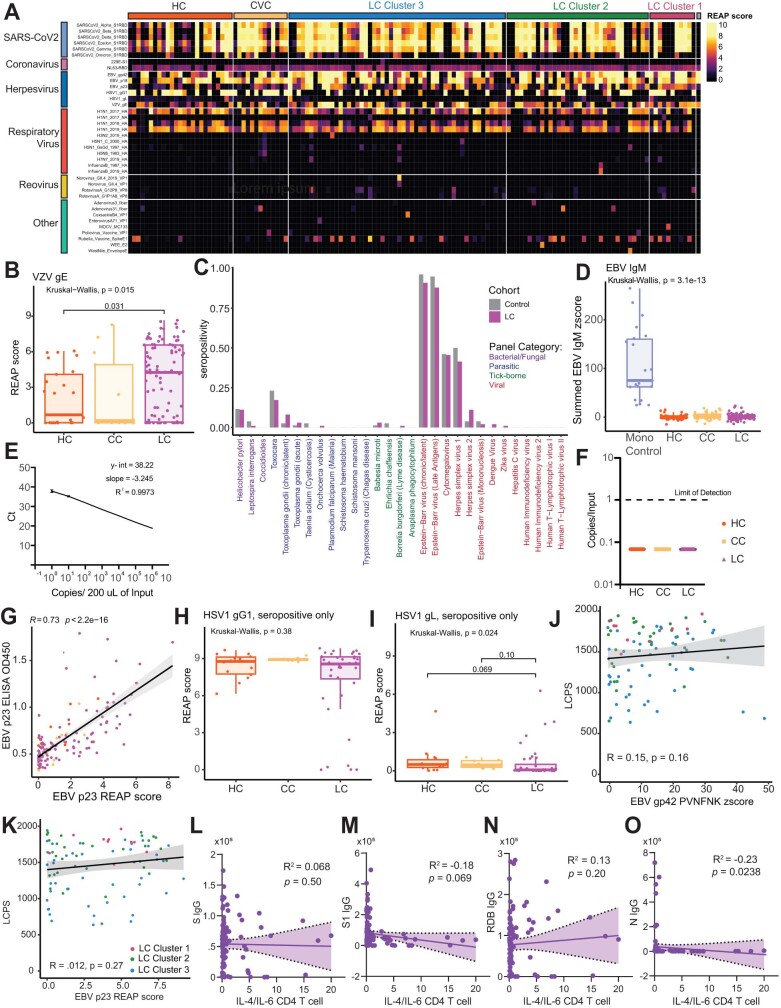
Extended Data Fig. 8. Non-SARS-CoV-2 humoral responses among participants with Long COVID.
(A) Heatmap depicting REAP reactivities to viral antigens across the MY-LC cohort. Each column is one participant, grouped by control or LCPS cluster. Column clustering within groups performed by K-means clustering. Each row is one viral protein. Reactivities depicted have at least one participant with a REAP score >= 2. (B) REAP scores for VZV gE by group (HC = healthy control; CC = convalescent control; LC = Long COVID). Statistical significance determined by Kruskal Wallis with correction for multiple comparison using Bonferroni-Holm. Each dot represents one individual (n = 25 HC, n = 13 CC, n = 98 LC). Bottom and top lines depict 25th to 75th percentile of the data, with the middle line representing the median. Whiskers represent 1.5x the inter-quartile range (IQR). (C) Proportion of each group (LC: n = 99, control: n = 78) seropositive for each of 30 common pathogen panels as determined by SERA, grouped by pathogen-type (LC = Long COVID). Statistical significance determined by Fisher’s exact test corrected with FDR (Benjamini Hochberg). (D) Sum of SERA-derived z-scores for IgM reactivity to EBV antigens plotted by group. Statistical significance determined by Kruskal-Wallis with correction for multiple comparison using Bonferroni-Holm. Each dot represents one individual (n = 22 Mono-control, n = 40 HC, n = 38 CC, n = 98 LC). Boxplot coloured box depicts 25th to 75th percentile of the data, with the middle line representing the median. Whiskers represent 1.5× the inter-quartile range (IQR). (E) Standard curve for Taqman PCR of EBV BNRF1. Serial dilutions of EBV standard ranging from 1 to 106 copies per 200 μL input material were made. Ct values are plotted against standard copy number, demonstrating ability to detect 1 genome copy. (F) Copies of EBV genome detected in participant serum by Taqman PCR for EBV BNRF1 plotted by group. All samples were below the limit of detection. (G) Correlation plot depicting the relationship between EBV p23 REAP score and EBV p23 ELISA O.D. 450 nm. Correlation assessed by Spearman. Black line depicts linear regression with 95% CI shaded. Colours depict group (purple, LC; yellow, CC; orange, HC). Each dot represents one individual. (H,I) REAP scores for HSV1 gD1 (H) and HSV1 gL (I) amongst HSV1 seropositive individuals only, separated by group (HC = healthy control; CC = convalescent control; LC = Long COVID). Statistical significance determined by Kruskal Wallis with correction for multiple comparison using Bonferroni-Holm. Each dot represents one individual. Boxplot coloured box depicts 25th to 75th percentile of the data, with the middle line representing the median. Whiskers represent 1.5× the inter-quartile range (IQR). Each dot represents one individual. (J,K) Correlation plot depicting the relationship between Long COVID Propensity Score (LCPS) and EBV gp42 PVXF[ND]K (J) or EBV p23 REAP score (K). Correlation assessed by Spearman. Each dot represents one individual. Colours depict Long COVID cluster (cluster 1, blue; cluster 2, green; cluster 3, red). Black line depicts the linear regression, with the 95% CI shaded. (L-O) Linear regressions of various SARS-CoV-2 antigens and IL-4/IL-6 double positive CD4 T cells. Spearman’s correlation were calculated for each pair of variables, with corresponding p-values reported. Black lines depict linear regressions with the shaded area representing the 95% CI.

