

Abstract
The occurrence of plant disease is determined by interactions among host, pathogen, and environment. Air humidity shapes various aspects of plant physiology and high humidity has long been known to promote numerous phyllosphere diseases. However, the molecular basis of how high humidity interferes with plant immunity to favor disease has remained elusive. Here we show that high humidity is associated with an “immuno‐compromised” status in Arabidopsis plants. Furthermore, accumulation and signaling of salicylic acid (SA), an important defense hormone, are significantly inhibited under high humidity. NPR1, an SA receptor and central transcriptional co‐activator of SA‐responsive genes, is less ubiquitinated and displays a lower promoter binding affinity under high humidity. The cellular ubiquitination machinery, particularly the Cullin 3‐based E3 ubiquitin ligase mediating NPR1 protein ubiquitination, is downregulated under high humidity. Importantly, under low humidity the Cullin 3a/b mutant plants phenocopy the low SA gene expression and disease susceptibility that is normally observed under high humidity. Our study uncovers a mechanism by which high humidity dampens a major plant defense pathway and provides new insights into the long‐observed air humidity influence on diseases.
Keywords: air humidity, disease resistance, NPR1, plant immunity, salicylic acid
Subject Categories: Microbiology, Virology & Host Pathogen Interaction; Plant Biology
Humidity acts directly on host plants to make them more susceptible to disease.
Introduction
Plant diseases caused by a variety of microbial pathogens pose a major threat to plant survival and crop yield across the globe. In addition to susceptibility of host plants and pathogen virulence, plant diseases are greatly influenced by environmental conditions such as temperature, humidity, and light, as described in the “disease triangle” principle fundamental for understanding plant epidemics (Stevens, 1960). Over the past decades, a great amount of efforts have been devoted to unravel the convoluted interplay between plant immunity and pathogen virulence. A well‐established notion of the plant immune system is that plants perceive danger signals from pathogens, through cell surface receptors and intracellular receptors, to activate downstream signaling cascades called pattern triggered immunity (PTI) and effector triggered immunity (ETI; Yu et al, 2017; Wang et al, 2020; Zhou & Zhang, 2020; Ngou et al, 2022). Pathogen recognition further induces defense‐related hormone pathways, such as salicylic acid (SA), jasmonic acid (JA), and ethylene pathways, which amplify immune responses and enhance resistance against pathogens (Burger & Chory, 2019).
The phytohormone SA is a beta‐hydroxy phenolic acid and plays an essential role in resistance against a variety of bacterial, fungal, or viral pathogens in plants (An & Mou, 2011; Fu & Dong, 2013; Ding & Ding, 2020; Peng et al, 2021). SA is rapidly synthesized upon pathogen attack, mainly through the isochorismate (ICS) pathway (Dempsey et al, 2011; Wu et al, 2022). SA is perceived by the nonexpressor of pathogenesis‐related gene 1 (NPR1) and NPR3/4 proteins, which triggers downstream defense gene expression via transcription factors (i.e., TGA2/5/6; Yan & Dong, 2014; Zhang & Li, 2019; Kumar et al, 2022). The NPR1 receptor functions as a transcriptional co‐activator of TGA transcription factors and is one of the first identified key regulators of the SA signaling pathway (Cao et al, 1997). SA perception leads to an oligomer‐to‐monomer transition and nuclear entry of monomeric NPR1 protein to activate gene expression (Mou et al, 2003). NPR1 protein is under dynamic control of post‐translational modifications, including phosphorylation, sumoylation, and ubiquitination, which modulate both NPR1 protein activity and stability (Saleh et al, 2015; Skelly et al, 2019; Zavaliev et al, 2020). Interestingly, NPR1 protein undergoes processive ubiquitination and Cullin 3 E3 ligase‐mediated ubiquitination is proposed to be important for NPR1's transcriptional activity and SA gene expression (Skelly et al, 2019). Poly‐ubiquitination also triggers NPR1 protein turnover through the 26S proteasome (Spoel et al, 2009; Shen et al, 2020). A recent study shows that NPR1 protein forms SA‐induced “condensates” to promote stress‐related protein degradation and cell survival (Zavaliev et al, 2020).
In contrast to the extensively studied plant immunity and pathogen virulence mechanisms, our understanding of the environmental influence on plant diseases is rather limited and is just gaining attention in recent years (Mwimba et al, 2018; Cheng et al, 2019). For example, high ambient temperature inhibits nucleotide‐binding, leucine‐rich repeat receptor (NLR) protein activity and SA production in Arabidopsis (Zhu et al, 2010; Huot et al, 2017; Kim et al, 2022) and differentially affects PTI and ETI (Cheng et al, 2013). Air humidity is another factor that has long been recognized to profoundly affect disease. It is well documented that high air humidity, a condition that typically occurs after rain falls or in tropical/coastal regions, strongly promotes a variety of diseases, caused by bacteria, fungi, or oomycete, in the aerial parts of plants (i.e., phyllosphere; De Wolf & Isard, 2007; Schwartz, 2011; Abrahamian et al, 2021; Romero et al, 2022). Previous studies showed that high humidity promotes the virulence of bacterial pathogens such as Pseudomonas syringae, by facilitating the formation of a water‐rich environment in the leaf tissue (Xin et al, 2016; Hu et al, 2022; Roussin‐Leveillee et al, 2022), and is important for fungal spores to germinate (Guzman‐Plazola et al, 2003). High humidity also impedes stomatal closure and ETI‐associated cell death in plants (Wang et al, 2005; Panchal et al, 2016), and daily humidity oscillation improves plant fitness‐related traits and enhances ETI at night (Mwimba et al, 2018). Despite this progress, how high humidity affects plant immunity was not known at the mechanistic level.
In this study, we investigated the effects of air humidity on several canonical immune pathways in Arabidopsis. Our results show that SA production and signaling are significantly inhibited at high humidity, compared to low humidity. We found that high humidity inhibits the ubiquitination level of NPR1 protein, which is associated with a lower binding affinity of NPR1 to the target gene promoter. Furthermore, we show that downregulation of Cullin 3‐based E3 ligase and cellular ubiquitination pathway is responsible for the low NPR1 protein ubiquitination and activity as well as disease susceptibility under high humidity. Overall, our study provides new insight into the humidity influence on plant diseases that has been documented for decades.
Results
High humidity triggers a range of plant physiological responses
To investigate humidity effect on plant responses, we set up an experimental system in which plants were first grown under ambient humidity (i.e., ~60% relative humidity, RH) till 4 weeks old and then placed under low (~45% RH), moderate (~60% RH), or high humidity (~95% RH) in environmentally controlled chambers. Plants appeared to grow bigger (based on rosette size), with a higher fresh weight but similar dry weight several days after high humidity treatment (Fig 1A and B). High humidity also induces petiole elongation and upward movement (i.e., hyponasy) of Arabidopsis leaves, compared to low and moderate humidity. To obtain a comprehensive understanding of humidity‐induced responses, we conducted a transcriptome analysis of plants after different humidity treatments by RNAseq. Results showed that high humidity induces a rapid (1 h after treatment) and significant change in Arabidopsis transcriptome, compared to moderate and low humidity (Fig 1C and Appendix Fig S1A–D, Dataset EV1). Gene Ontology (GO) analysis demonstrated that multiple plant hormone pathways, including ethylene, gibberellin, abscisic acid, auxin, and brassinosteroid, as well as processes related to “cell wall biogenesis” and “defense responses,” are significantly affected under high humidity (Fig 1D). In contrast, the transcriptomes are similar between moderate and low humidity (Fig 1C and E). We also observed a dramatic accumulation of reactive oxygen species (ROS) under high humidity, compared to moderate and low humidity, as shown by diaminobenzidine (DAB) staining (Fig 1F). These results indicate that high humidity modulates a range of plant physiological responses.
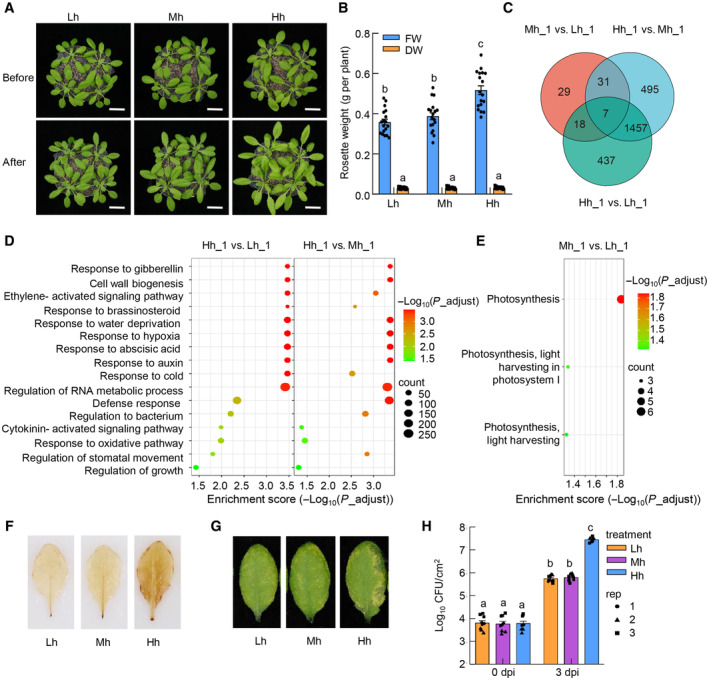
Figure 1. High humidity leads to a range of plant physiological responses.
-
AThree‐to‐four‐week‐old Col‐0 plants (grown under moderate humidity) were treated with low humidity (Lh, 45% RH), moderate humidity (Mh, 60% RH), or high humidity (Hh, 95% RH) for 2 days. Pictures were taken before and after humidity treatment. Scare bar = 2 cm.
-
BFresh and dry weight of Arabidopsis rosettes after different humidity treatments. Data are shown as mean ± SEM (n = 16 plants). Different letters indicate statistically significant differences, as analyzed by two‐way ANOVA with Tukey's HSD post hoc test (P < 0.05). FW, fresh weight; DW, dry weight.
-
CA Venn diagram illustrating the overlap of the differentially regulated genes under low, moderate or high humidity. Col‐0 plants were treated under high, moderate, or low humidity for 1 h and the transcriptomes were analyzed by RNAseq.
-
D, EGO enrichment analysis of the differentially regulated genes under different humidity levels. The differentially regulated genes were selected with the cutoff of gene expression fold change > 2 and adjusted P value < 0.05.
-
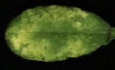
FDAB staining of Col‐0 plant leaves after treatment of high, moderate, or low humidity for 2 days.
-
G, HHigh humidity strongly promotes P. syringae infection in Arabidopsis. Four‐week‐old Col‐0 plants (grown under ~60% RH) were infiltrated with Pst DC3000 at 1 × 10⁶ cfu/ml and placed under different humidity levels. Disease symptoms (G) and bacterial population (H) were recorded 3 days later. Data represent mean ± standard error of the mean (SEM) (n = 3 biological replicates; all data points from three experimental repeats are shown). Different letters indicate statistically significant differences, as analyzed by two‐way ANOVA with Tukey's HSD post hoc test (P < 0.05).
Source data are available online for this figure.
High humidity, which typically occurs after rain falls in nature, promotes numerous plant diseases. We then performed a bacterial infection assay, using P. syringae pv. tomato (Pst) DC3000 bacteria, in Arabidopsis leaves that were exposed to different humidity levels. Our results showed that high humidity significantly enhanced Pst DC3000‐associated disease development and bacterial multiplication, compared to moderate and low humidity (Fig 1G and H). In contrast, there was almost no visible disease symptom, and bacteria grew to a low level under moderate and low humidity conditions. Taken together, our results suggest that high humidity alters a variety of plant growth programs and responses to pathogens.
Plant immunity is impaired under high humidity
We then used this system to understand the basis of high plant disease under high humidity. Our RNAseq results suggest that high humidity changes the basal defense status of plants (Fig 1D). We then examined whether the profound disease‐promoting effect of high humidity is associated with an altered plant immunity during bacterial infection under this condition. Because plants behaved similarly under moderate and low humidity in our tested responses and disease assays (Fig 1), we used high and low humidity for the rest of the study. The Col‐0 plants were treated with different humidity levels and infiltrated with Pst DC3000 bacteria at a high dose (so that the bacterial populations were similar at sampling time; Appendix Fig S1E), and the expression of immune‐related genes was examined. We found that the induction of resistance‐associated genes, such as WRKY29, NHL10, FRK1, PR2, EDS5, and EDS1, was dramatically suppressed under high humidity (Fig 2A), suggesting that high humidity places plants to an “immune‐compromised” status, presumably contributing to severity of diseases.
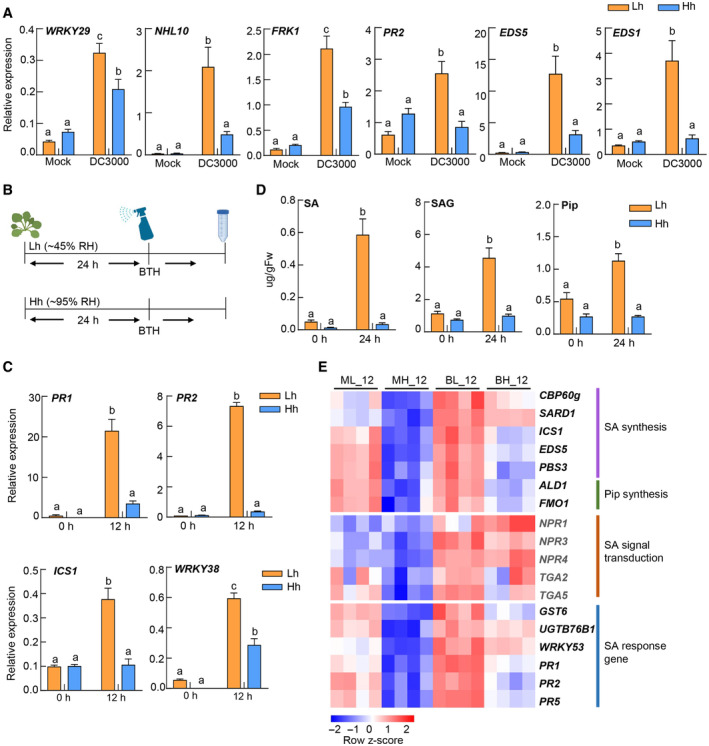
Figure 2. The SA responses and production are significantly inhibited under high humidity.
-
ART‐qPCR analysis of WRKY29, NHL10, FRK1, PR2, EDS5, and EDS1 transcript levels in Col‐0 plants under low or high humidity. Col‐0 plants (grown under ~60% RH) were infiltrated with Pst DC3000 at 1 × 10⁸ cfu/ml and placed under high or low humidity. Leaf tissues were sampled 5 h after infiltration for RNA extraction and RT‐qPCR. Data represent mean ± SEM (n = 4 biological replicates).
-
BA schematic diagram showing the humidity and BTH treatment on plants for results in (C–E). Four‐week‐old Col‐0 plants grown under ambient humidity (60% RH) were pre‐treated with high or low humidity for 24 h, sprayed with100 μM BTH and placed back in different humidity settings before sampling. Lh, low humidity. Hh, high humidity.
-
CRT‐qPCR analysis of PR1, PR2, ICS1 and WRKY38 expression levels in plants under Lh or Hh, at 0 and 12 h after BTH treatment. Data represent mean ± SEM (n = 3 biological replicates).
-
DQuantification of SA, SAG, and Pip levels under Lh or Hh, at 0 and 24 h after BTH treatment. Data represent mean ± SEM (n = 4 biological replicates).
-
EA heatmap of SA pathway‐related genes under Lh or Hh, at 12 h after BTH/mock treatment, in the RNAseq results. ML_12, 12 h after mock treatment under low humidity; MH_12, 12 h after mock treatment under high humidity; BL_12, 12 h after BTH treatment under low humidity; BH_12, 12 h after BTH treatment under high humidity. The color key (blue to red) represents TPM (log2) of genes as z‐scores.
Data information: For results in (A, C, and D), different letters indicate statistically significant differences, as analyzed by two‐way ANOVA with Tukey's HSD post hoc test (P < 0.05). Experiments were repeated three times with similar results.
Source data are available online for this figure.
High humidity does not exert consistent effects on the PTI or JA pathway
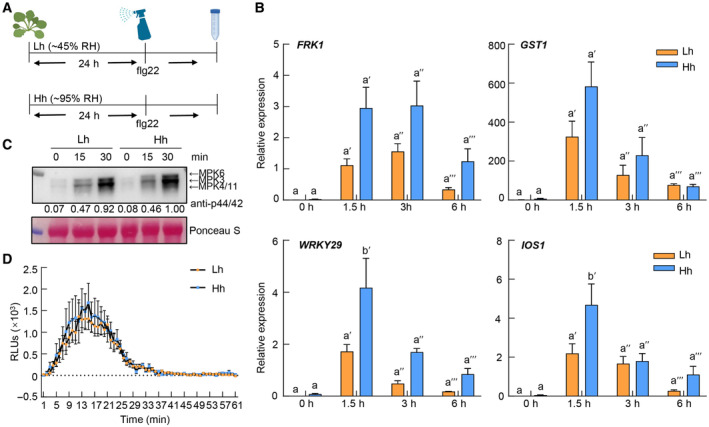
Infection of pathogenic microorganisms like Pst DC3000 simultaneously activates multiple plant immune signaling pathways, including PTI, SA, JA, and ethylene pathways. Furthermore, these pathways show extensive crosstalk with each other (Burger & Chory, 2019; Aerts et al, 2021), making it difficult to dissect humidity influence on individual pathways. We therefore applied elicitors to induce specific pathways and analyzed which immune pathway(s) is altered under high humidity. As shown in Fig EV1A, plants were treated with flg22, a bacterial flagellin‐derived peptide‐inducing PTI (Felix et al, 1999), and we examined PTI responses of plants under different humidity settings. We observed an increase in the expression of flg22‐responsive genes, such as WRKY29 and IOS1, but similar MPK3/6 phosphorylation and ROS production under high humidity (Fig EV1B–D). We next examined whether humidity affects the JA pathway, another important defense hormone pathway (Howe et al, 2018). We found that the expression of MeJA‐induced genes such as JAZ8, PDF1.2, LOX2, and VSP2 shows different or opposite regulation patterns under high humidity (Fig EV2). Overall, these data indicate that high humidity affects different PTI and JA responses in different manners.
Figure EV1. High humidity does not exert a consistent effect on flg22‐induced PTI responses.
-
AA schematic diagram showing humidity and flg22 treatment for experiments in this figure.
-
BRT‐qPCR analysis of 200 nM flg22‐induced FRK1, GST1, WRKY29, and IOS1 expression level in Col‐0 plants under Lh or Hh. Samples were taken at 0, 1.5, 3, and 6 h after flg22 treatment. Data represent mean ± SEM (n = 3 biological replicates). Different letters indicate statistically significant differences, as analyzed by two‐way ANOVA with Tukey's HSD post hoc test (P < 0.05).
-
CFlg22‐induced MAPK Phosphorylation in Col‐0 plants under Lh or Hh. An equal amount of total protein was loaded in each lane.
-
DFlg22‐induced ROS production in Col‐0 plants under different humidity levels, measured by luminol‐HRP approach. Data are shown as mean ± SEM (n = 6 leaf discs).
Data information: Experiments were repeated at least three times with similar trends.
Source data are available online for this figure.
Figure EV2. High humidity shows an inconsistent effect on JA response gene expression.
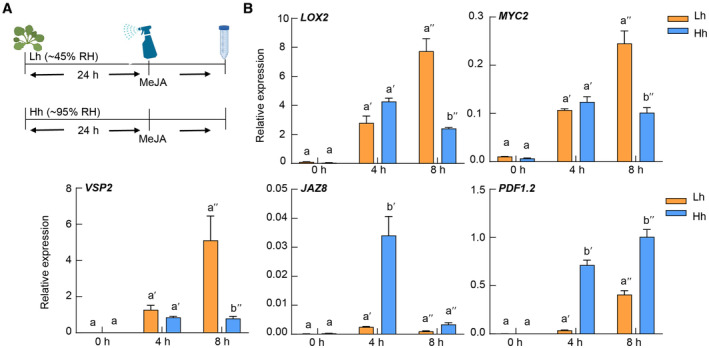
- A schematic diagram showing humidity and MeJA treatment for experiments in this figure.
- RT‐qPCR analysis of JA‐responsive gene expression in Col‐0 plants under Lh or Hh, after 100 μM MeJA treatment. Data represent mean ± SEM (n = 3 biological replicates). Different letters indicate statistically significant differences, as analyzed by two‐way ANOVA with Tukey's HSD post hoc test (P < 0.05). Experiments were repeated three times with similar results.
Source data are available online for this figure.
SA responses and production are significantly inhibited under high humidity
We next analyzed whether SA pathway, which plays an essential role in resistance against a variety of bacterial, fungal and viral pathogens in plants (Fu & Dong, 2013; Ding & Ding, 2020; Peng et al, 2021), is affected by high humidity. SA pathway can be activated by the treatment of benzothiadiazole (BTH), an SA analog without toxicity to plant cells. We found that the expression of BTH‐induced SA response genes, including PR1, PR2, ICS1, and WRKY38, was consistently and significantly lower under high humidity (Fig 2B and C). We also checked the SA gene expression under high, moderate, or low humidity, and found that there is no significant change between moderate and low humidity (Appendix Fig S2). Furthermore, the accumulation of SA, salicylic acid beta‐glucoside (SAG), a storage form of SA, and pipecolic acid (Pip), a chemical synergistic to SA in activating plant defense (Huang et al, 2020), induced by BTH treatment, was strongly suppressed in plants under high humidity (Fig 2D). Consistently, when plants were inoculated with Pst DC3000 and placed under different humidity levels, SA response genes, such as PR2 and EDS5, were also inhibited under high humidity (Fig 2A), validating the results of BTH treatment.
To investigate the effect of high humidity on the Arabidopsis transcriptome and whether high humidity targets specific branches of the SA pathway, we performed an RNAseq experiment. Col‐0 plants were pretreated with high or low humidity for 24 h, sprayed with BTH (water as control) and sampled 12 h later for total RNA extraction and sequencing. We found that high humidity led to 4,005 and 2,515 differentially regulated genes (fold change > 2; adjusted P value < 0.01), under mock and BTH treatment, respectively (Appendix Fig S3A–C and Dataset EV2). Gene Ontology analysis of differentially regulated genes by high humidity, under mock or BTH treatment, indicated that “response to bacteria, SA, water deprivation or temperature”‐related pathways were enriched in humidity‐regulated genes (Appendix Fig S3D and E). Notably, more than half of BTH‐responsive genes (474/927) showed differential expression (fold change > 2; adjusted P value < 0.01) under different humidity settings (Appendix Fig S3F), suggesting that high humidity broadly affects SA responses. Furthermore, we found that many SA/Pip biosynthesis‐related genes, including ICS1, CBP60g, PBS3, ALD1, and FMO1, and SA‐responsive marker genes, including PR1, PR2, and PR5, were significantly suppressed under high humidity, under both mock and BTH treatment (Fig 2E and Table EV1). However, genes involved in SA signal transduction, such as NPR1, NPR3/4, and TGA2/5 (Peng et al, 2021), were not transcriptionally regulated by humidity (Fig 2E and Table EV1).
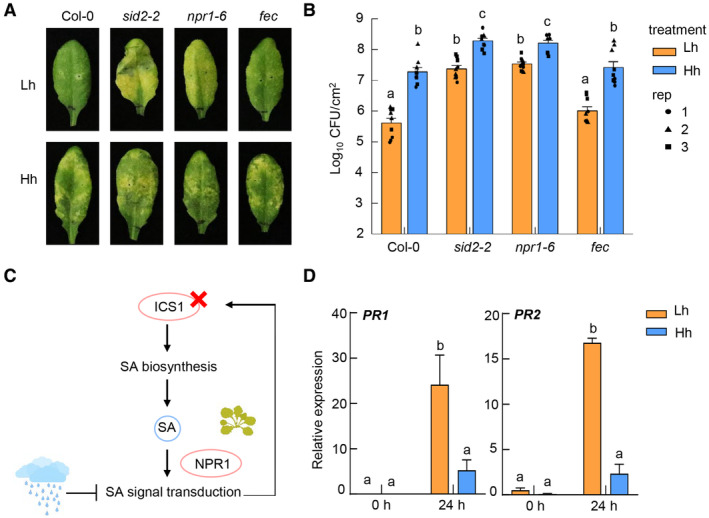
To determine the biological relevance of high humidity suppression of SA pathway, we performed Pst bacterial infection assay under different humidity levels in the sid2‐2 mutant (Wildermuth et al, 2001), which lacks the key SA biosynthesis enzyme, isochorismate synthase 1 (ICS1), and npr1‐6 mutant (Huot et al, 2017), which lacks the SA receptor NPR1. While Pst DC3000 grew poorly and did not cause visible disease symptoms on Col‐0 plants under low humidity, it caused obvious disease symptoms and multiplied significantly higher in the sid2‐2 and npr1‐6 plants under low humidity, almost to the level observed in Col‐0 plant under high humidity (Fig 3A and B). As a control, this disease restoration under low humidity was not observed in the PTI receptor/co‐receptor mutant plant, fls2/efr/cerk1 (Gimenez‐Ibanez et al, 2009). However, both sid2‐2 and npr1‐6 mutants still supported higher Pst growth under high humidity compared to low humidity, likely due to the high humidity's role in promoting the formation of a watery apoplast in the leaf which is driven by pathogen effectors and strongly facilitates bacterial multiplication (Xin et al, 2016). Altogether, these results suggest that suppression of SA pathway is a major determinant of the enhanced Arabidopsis susceptibility to Pst infection under high humidity.
Figure 3. High humidity impairs SA signal transduction.
-
A, BSA pathway mutation partially rescued disease susceptibility under low humidity. Col‐0, sid2‐2, npr1‐6, and fec plants were pre‐treatment with low or high humidity for 24 h, infiltrated with Pst DC3000 at 1 × 10⁶ cfu/ml and placed back in different humidity settings. Disease symptoms (A) and bacterial population (B) were recorded 3 days post infiltration. Data in (B) represent mean ± SEM (n = 3 biological replicates; all data points from three experimental repeats are shown).
-
CA schematic illustration of examination of humidity effect on SA signaling in plants.
-
DRT‐qPCR analysis of BTH‐induced PR1 and PR2 expression level in the sid2‐2 mutant plant under Lh or Hh, at 0 and 24 h after 100 μM BTH spray. Plants were pre‐treated with Lh or Hh for 24 h before BTH treatment. Data represent mean ± SEM (n = 3 biological replicates).
Data information: For results in (B and D), different letters indicate statistically significant differences, as analyzed by two‐way ANOVA with Tukey's HSD post hoc test (P < 0.05). Experiments were repeated three times with similar results.
Source data are available online for this figure.
High humidity impairs SA signal transduction
Previous studies showed that activation of SA signaling leads to transcriptional induction of ICS1 and CBP60g/SARD1, two master regulators of SA synthesis, and SA production (Zhang et al, 2010; Wang et al, 2011), making the pathway a positive‐feedback loop. We, therefore, attempted to determine the effect of high humidity on SA biosynthesis or signaling, by using SA pathway mutants. To determine whether high humidity affects SA biosynthesis (e.g., in the absence of SA signaling), we measured synthesis‐related gene expression and SA level in the npr1‐6 mutant, which is severely blocked in SA signaling, under high or low humidity. As shown in Fig EV3A–C, the expression of ICS1 and CBP60g genes and the basal levels of SA and SAG were still inhibited under high humidity in the npr1‐6 mutant, suggesting that high humidity possibly inhibits SA biosynthesis independently of NPR1‐mediated signaling.
Figure EV3. High humidity inhibits SA biosynthesis gene expression and the basal level of SA in the npr1‐6 mutant.
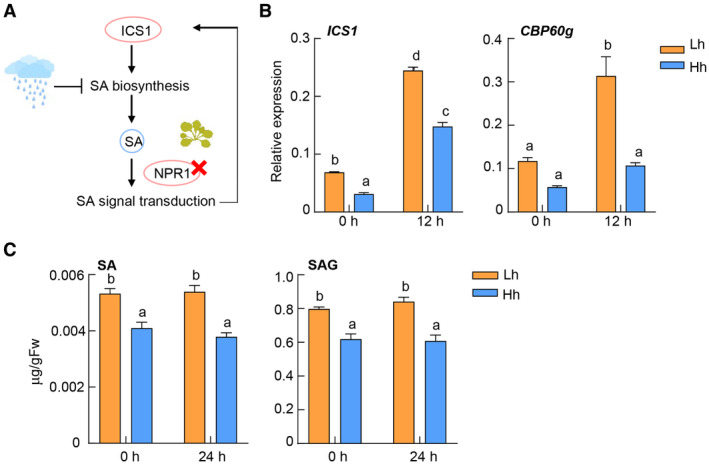
- A schematic diagram illustrating examination of humidity effect on SA biosynthesis.
- RT‐qPCR analysis of ICS1 and CBP60g expression level in the npr1‐6 mutant under different humidity levels, at 0 and 12 h after 100 μM BTH treatment. Plants were pre‐treated with Lh or Hh for 24 h. Data represent mean ± SEM (n = 3 biological replicates).
- The SA and SAG levels in the npr1‐6 mutant under different humidity levels. Plants were treated the same as in (B). Data represent mean ± SEM (n = 4 biological replicates).
Data information: For results in (B and C), different letters indicate statistically significant differences, as analyzed by two‐way ANOVA with Tukey's HSD post hoc test (P < 0.05). Experiments were repeated three times with similar results.
Source data are available online for this figure.
Next, we used sid2‐2, the SA biosynthesis mutant, to examine whether SA signaling induced by exogenous (and presumably saturating) BTH treatment is affected by high humidity. Our results showed that BTH‐induced expression of downstream genes, such as PR1 and PR2, was still dramatically suppressed under high humidity (Fig 3C and D), indicating that high humidity inhibits SA signal transduction.
NPR1 protein ubiquitination and activity are decreased under high humidity
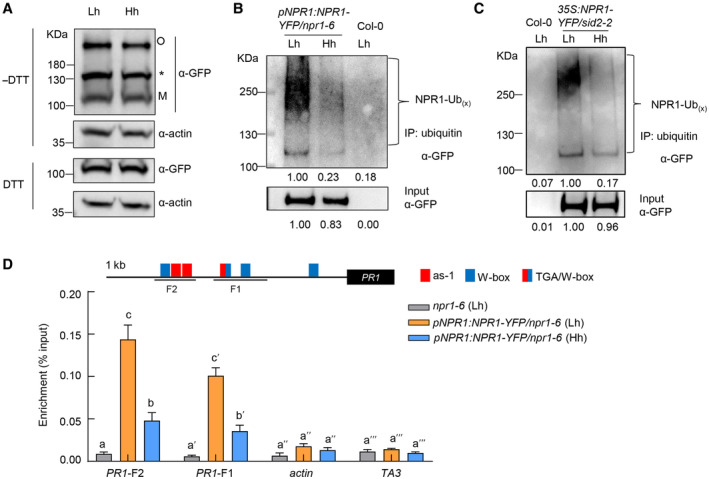
We next focused on investigating how high humidity inhibits SA signaling. Our RNAseq results show that key signaling components such as NPR1, NPR3/4, and TGAs are not transcriptionally regulated by high humidity (Fig 2E and Table EV1). We, therefore, hypothesized that high humidity may affect the protein or activity level of signaling components. The broad suppression of SA response genes under high humidity suggests that high humidity targets upstream elements of the SA pathway. We thus investigated whether the function of NPR1, an SA receptor and central transcriptional co‐activator that works together with TGA transcription factors in the nucleus to activate SA response genes (Cao et al, 1997; Wu et al, 2012; Ding et al, 2018; Kumar et al, 2022), was affected by high humidity. Previous studies showed that NPR1 protein forms oligomers in the cytosol when SA level is low and SA treatment triggers its monomerization and entry into the nucleus to activate gene expression (Mou et al, 2003; Tada et al, 2008). We examined the level of NPR1 protein in the monomer or oligomer form under different humidity levels in the pNPR1:NPR1‐YFP/npr1‐6 plants, and no significant difference was found (Fig 4A). We propose that the high concentration of exogenously applied BTH likely overrides the difference in endogenous SA level observed under different humidity levels. We also generated the 35S:NPR1‐YFP/sid2‐2 plant, in which the endogenous SA synthesis is almost abolished and NPR1 gene is driven by the 35S promoter, so that humidity regulation of BTH‐induced NPR1 protein level can be assessed. A similar trend of NPR1 monomer/oligomer level was observed in this line (Fig EV4A). These results suggest that high humidity does not affect the oligomer‐to‐monomer transition of NPR1 protein.
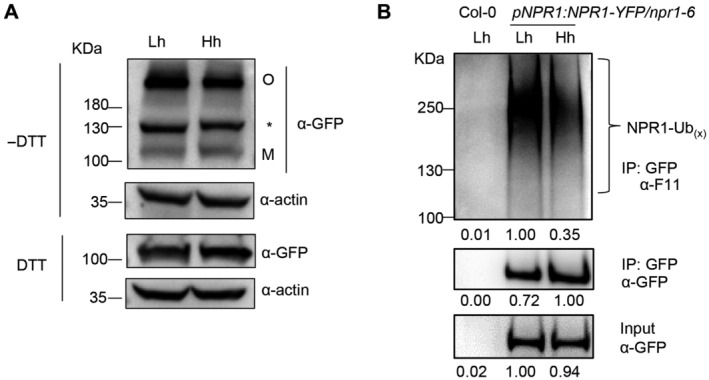
Figure 4. NPR1 protein ubiquitination and activity are decreased under high humidity.
-
AHigh humidity does not affect the oligomer/monomer ratio of NPR1 protein in pNPR1:NPR1‐YFP/npr1‐6 plants. The plants were pre‐treated with Lh or Hh for 24 h, sprayed with 100 μM BTH and sampled 12 h after BTH treatment. Proteins were extracted with (+) or without (−) DTT (50 mM) in the sample buffer and subject to SDS–PAGE. NPR1 was detected by immunoblot using monoclonal anti‐GFP antibody. Both oligomeric (O) and monomeric (M) forms of NPR1‐YFP were detected. Asterisk indicates non‐specific band. Actin was used as loading control.
-
B, CNPR1 protein ubiquitination level under different humidity levels in the pNPR1:NPR1‐YFP/npr1‐6 plants (B) and 35S:NPR1‐YFP/sid2‐2 plants (C). The plants were pre‐treated with Lh or Hh for 24 h, infiltrated with 50 μM MG132 solution, air‐dried for ~0.5 h, and then sprayed with 100 μM BTH. Samples were taken 12 h after BTH treatment. Ubiquitinated proteins were enriched using anti‐ubiquitin beads, and NPR1‐YFP (NPR1‐Ubx) in input and IP samples were detected by western blot with anti‐GFP antibody. Band intensity was quantified by Image J.
-
DNPR1 protein has a lower binding affinity to PR1 gene promoter under high humidity, as shown by ChIP‐qPCR. The pNPR1:NPR1‐YFP/npr1‐6 plants were treated the same as in (C). Samples were taken 12 h after BTH treatment. The npr1‐6 plants was used as negative control. ChIP was performed using anti‐GFP antibody and qPCR was performed to amplify different regions of PR1 gene promoter. The actin and TA3 genes were used as negative control. Results from three experimental repeats are shown. Data represent mean ± SEM (n = 3 experimental replicates). Different letters indicate statistically significant differences, as analyzed by two‐way ANOVA with Tukey's HSD post hoc test (P < 0.05).
Source data are available online for this figure.
Figure EV4. High humidity does not affect the oligomer/monomer ratio of NPR1 protein and suppresses NPR1 ubiquitination level.
- The 35S:NPR1‐YFP/sid2‐2 plants were pre‐treated with Lh or Hh for 24 h, sprayed with 100 μM BTH and sampled 12 h after BTH treatment. Proteins were extracted with (+) or without (−) DTT (50 mM) in the sample buffer and subject to SDS–PAGE. NPR1 was detected by immunoblot using monoclonal anti‐GFP antibody. Both oligomeric (O) and monomeric (M) forms of NPR1‐YFP were detected. Asterisk indicates non‐specific band. Actin was used as loading control.
- NPR1 protein ubiquitination level under different humidity levels in pNPR1:NPR1‐YFP/npr1‐6 plants. The plants were pre‐treated with Lh or Hh for 24 h, infiltrated with 50 μM MG132 solution, air‐dried for ~0.5 h, and then sprayed with 100 μM BTH. Samples were taken 12 h after BTH treatment. NPR1‐YFP protein was enriched using anti‐GFP beads, and the ubiquitinated NPR1 (NPR1‐Ubx) was detected by anti‐F11 antibody. NPR1‐YFP proteins in input and IP samples were detected by anti‐GFP antibody.
Source data are available online for this figure.
Previous studies show that NPR1 protein undergoes multiple post translational modifications, including phosphorylation, sumoylation and ubiquitination, which regulate its activity and degradation (Spoel et al, 2009; Saleh et al, 2015; Skelly et al, 2019). We, therefore, carried out NPR1 protein pull‐down, using the pNPR1:NPR1‐YFP/npr1‐6 transgenic plants, coupled with mass spectrometry to identify NPR1 phosphorylation sites under different humidity levels. Multiple phosphorylation sites, including Y330, S354, and T373, were detected, but the phosphorylation level seemed similar under high or low humidity (Table 1), suggesting that the differential SA responses under high humidity is unlikely due to altered phosphorylation level at these sites of NPR1. We further tested if high humidity affects the ubiquitination level of NPR1 protein, which regulates both NPR1 activity and stability (Spoel et al, 2009; Skelly et al, 2019). Interestingly, NPR1‐YFP protein displayed a much lower ubiquitination level under high humidity compared to low humidity (Fig 4B). We further confirmed this result using anti‐GFP protein pull downs (Fig EV4B). In addition, a similar trend was observed in the 35S:NPR1‐YFP/sid2‐2 plants (Fig 4C). Therefore, high humidity inhibits the ubiquitination of NPR1 protein.
Table 1.
Phosphorylation sites of NPR1 protein under different humidity levels, as detected by mass spectrometry.
| Position of phosphorylated amino acid | Phosphorylated peptide sequence | 45% RH | 95% RH |
|---|---|---|---|
| 276 | ALDpSDDIELVK | 1/7 a | 1/8 |
| 310 | pTATDLLKLDLADVNHR | 0/3 | 2/12 |
| 312 | TApTDLLKLDLADVNHR | 0/3 | 2/12 |
| 330 | GpYTVLHVAAMR | 3/14 | 2/13 |
| 331 | GYpTVLHVAAMR | 1/14 | 2/13 |
| 354 | GApSASEATLEGR | 4/17 | 4/16 |
| 373 | QApTMAVECNNIPEQCK | 3/13 | 4/12 |
| 425 | MpTLLDLENR | 1/22 | 1/17 |
| 456 | GpTCEFIVTSLEPDR | 1/5 | 2/10 |
| 476 | RTpSPGVK | 1/2 | 1/2 |
| 545 | pYMEIQETLKK | 0/14 | 1/22 |
| 557 | AFpSEDNLELGNSSLTDSTSSTSK | 1/8 | 6/30 |
| 566 | AFSEDNLELGNpSSLTDSTSSTSK | 0/8 | 3/30 |
| 567 | AFSEDNLELGNSpSLTDSTSSTSK | 0/8 | 1/30 |
| 572 | AFSEDNLELGNSSLTDSpTSSTSK | 0/8 | 1/30 |
| 575 | AFSEDNLELGNSSLTDSTSSpTSK | 0/8 | 1/30 |
| 573 | AFSEDNLELGNSSLTDSTpSSTSK | 0/8 | 1/30 |
| 574 | AFSEDNLELGNSSLTDSTSpSTSK | 0/8 | 1/30 |
The ratio represents the number of phosphorylated peptides versus total number of this peptide detected in this experiment. This experiment was repeated twice with similar results.
The ubiquitination of NPR1 protein has been suggested to play an important role in NPR1's transcriptional activity and SA gene expression (Skelly et al, 2019). Ubiquitination also positively regulates the activity of transcription activators/co‐activators, independently of proteolysis, in yeast and animal cells (Adhikary et al, 2005; Archer et al, 2008; Geng et al, 2012). We, therefore, examined the binding affinity of NPR1 protein to the target gene promoter under different humidity levels by chromatin immunoprecipitation (ChIP)‐qPCR. The nuclei fractions of the pNPR1:NPR1‐YFP/npr1‐6 plants after BTH treatment and under different humidity levels were isolated for ChIP. The amount of DNA fragments associated with PR1 gene promoter and pulled down by NPR1‐YFP protein was analyzed. Intriguingly, NPR1 protein displayed a significantly reduced binding to different regions of the PR1 promoter under high humidity, compared to low humidity (Fig 4D), suggesting that NPR1 proteins in plants under high humidity are poorly active.
NPR1 protein turnover is reduced under high humidity
Protein ubiquitination level could affect protein degradation. We then tested NPR1 protein turnover by cell‐free degradation assay using protein extracts from the pNPR1:NPR1‐YFP/npr1‐6 plants. Results showed that the degradation of NPR1 protein under high humidity was delayed, compared to that under low humidity (Fig 5A). We also monitored NPR1 degradation rate in leaves treated with cycloheximide (CHX), a protein synthesis inhibitor. Consistently, a slower degradation rate of NPR1 protein was observed under high humidity (Fig 5B).
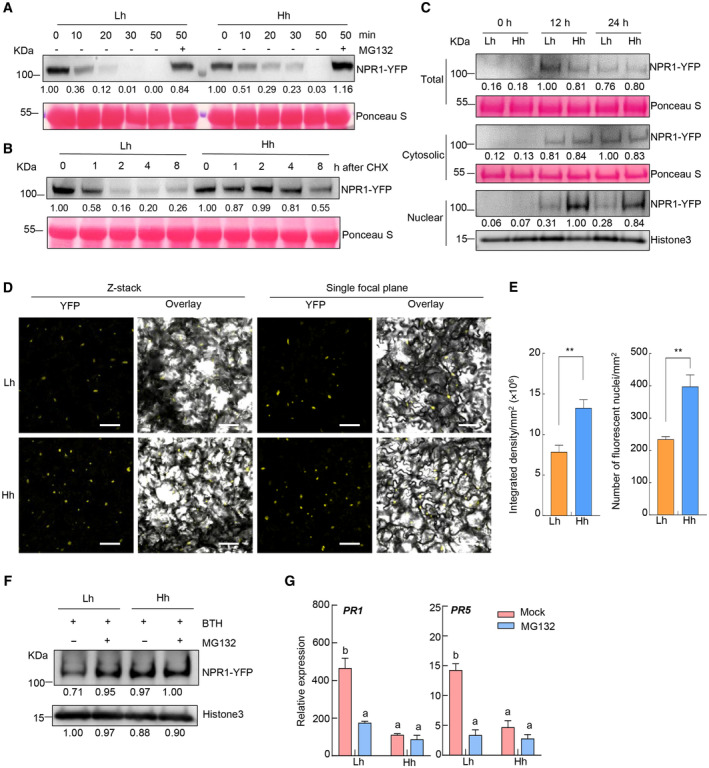
Figure 5. NPR1 protein is over‐accumulated in the nucleus of the plant cell under high humidity.
-
AIn vitro cell‐free degradation assay. The pNPR1:NPR1‐YFP/npr1‐6 plants were pre‐treated with Lh or Hh for 24 h, sprayed with 100 μM BTH and sampled 12 h later. Total proteins were extracted and incubated for indicated time, with or without 50 μM MG132. NPR1‐YFP protein was detected by western blotting using anti‐GFP antibody.
-
BNPR1 protein degradation in vivo. The pNPR1:NPR1‐YFP/npr1‐6 plants were treated the same as in (A), except that, after BTH treatment for 12 h, plants were dipped with 100 μM cycloheximide (CHX) solution and sampled at the indicated time after CHX treatment. NPR1‐YFP protein was detected by western blot using anti‐GFP antibody. Rubisco indicates equal loading.
-
CWestern blot of NPR1‐YFP protein in the total, cytosolic, and nuclear fractions from the pNPR1:NPR1‐YFP/npr1‐6 plant. Plants were treated the same as in (A), and sampled at different time points after BTH treatment. Anti‐GFP antibody was used to detect NPR1‐YFP protein in each fraction. Rubisco and Histone3 protein were used as loading controls.
-
D, EConfocal microscopy images (D) and quantification (E) of NPR1‐YFP fluorescence in the pNPR1:NPR1‐YFP/npr1‐6 plant under high or low humidity. Plants were treated the same as in (A), and images were taken 24 h after BTH treatment. Scale bar = 50 μm. The fluorescence intensity and nucleus number per mm2 on z‐stacked images were quantified by Image J. Data represent mean ± SEM (n = 8 plants), and analyzed by Student's t‐test (**, P < 0.01).
-
F, GMG132 treatment on plants under low humidity phenocopies high humidity effect. The pNPR1:NPR1‐YFP/npr1‐6 plants were pre‐treated with Lh or Hh for 24 h, infiltrated with 50 μM MG132 solution, air‐dried for ~0.5 h, and then sprayed with 100 μM BTH. Samples were taken 12 h after BTH treatment. (F) Nuclear proteins were extracted and subject to SDS–PAGE and NPR1‐YFP protein was detected by anti‐GFP antibody (with Histone3 as loading control). (G) The PR gene expression was analyzed by qRT‐PCR. Data represent mean ± SEM (n = 3 biological replicates). Different letters indicate statistically significant differences, as analyzed by two‐way ANOVA with Tukey's HSD post hoc test (P < 0.05).
Data information: The NPR1‐YFP band intensity in (A, B, C, and F) was quantified by Image J. Experiments were repeated at least three times with similar results.
Source data are available online for this figure.
When we monitored NPR1 protein level in the total extracts of plants, it was similar under high or low humidity (Fig 5C). However, after the total protein extracts were separated into cytosol and nucleus fractions, a higher level of NPR1 protein in the nucleus under high humidity was observed (Fig 5C). This is in line with NPR1 protein working as a transcriptional co‐activator and its degradation mainly occurring in the nucleus (Spoel et al, 2009). We also monitored the fluorescence signal of nucleus‐localized NPR1‐YFP protein by confocal microscopy (Appendix Fig S4A). Similarly, a stronger fluorescence intensity and a higher number of fluorescent nuclei were detected in plants under high humidity, 24 h after BTH treatment (Fig 5D and E). Similar trends were observed in the 35S:NPR1‐YFP/sid2‐2 plants (Appendix Fig S4B–D).
To explore whether the reduced NPR1 protein degradation is biologically relevant to the impairment of SA responses under high humidity, we treated plants with MG132, a 26S proteasome inhibitor (Lee & Goldberg, 1998), and examined SA response. MG132 treatment increased the nuclear NPR1‐YFP protein level under low humidity, but not under high humidity, and NPR1 protein level under high humidity was comparable to that under low humidity after MG132 treatment (Fig 5F and Appendix Fig S4E). We found that MG132 treatment led to a significant inhibition of SA gene expression (i.e., PR1 and PR5) under low humidity, but did not show an obvious effect under high humidity (Fig 5G and Appendix Fig S4F). These results suggest that high humidity impairs NPR1 proteolysis, which possibly contributes to the suppression of SA signaling pathway. NPR1 protein turnover was proposed to be important for SA gene transcription (Spoel et al, 2009). Whether the decrease in NPR1 protein turnover under high humidity contributes to lower chromatin binding of NPR1 or suppresses SA responses via other mechanisms requires future study.
Cullin 3 E3 ubiquitin ligase and cellular ubiquitination pathway are suppressed under high humidity
We next investigated possible reasons for the reduction in NPR1 protein ubiquitination under high humidity. Previous studies reported that Cullin3 (CUL3)‐based E3 ubiquitin ligase and HOS15, a substrate adaptor in the Cullin 1‐based E3 ubiquitin ligase, mediate NPR1 ubiquitination (Spoel et al, 2009; Shen et al, 2020). We thus examined NPR1 target gene expression in the cul3a/b and hos15 mutant plants under different humidity levels. Interestingly, the expression of PR1 was much lower in the cul3a/b mutant than Col‐0 plant under low humidity, and furthermore at a similar level under high or low humidity in the mutant (Fig 6A), indicating that high humidity no longer suppresses NPR1 target gene in the absence of CUL3A/B. In contrast, high humidity still significantly suppressed the PR1 gene expression in the hos15 mutant plant (Fig EV5A). Consistent with an important role of CUL3 in NPR1 ubiquitination (Spoel et al, 2009), we found that the NPR1 protein ubiquitination level in the cul3a/b mutant is already much reduced, compared to that in Col‐0, under low humidity (Fig EV5B). To examine whether CUL3A/B genes are regulated by humidity, we checked the RNAseq results and found that the CUL3B transcript was reduced under high humidity (Fig 6B).
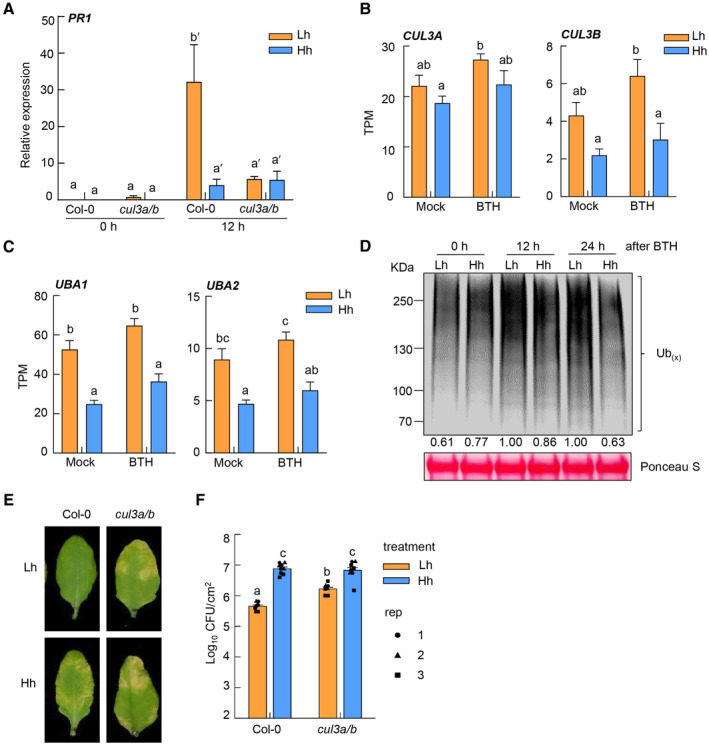
Figure 6. Cullin 3 E3 ligase‐mediated NPR1 protein ubiquitination is disrupted under high humidity.
-
ART‐qPCR analysis of PR1 expression level in Col‐0 and the cul3a/b mutant plants under high or low humidity. Plants were pre‐treated with different humidity levels for 24 h, sprayed with 100 μM BTH and sampled at 0 and 12 h after BTH treatment. Data represent mean ± SEM (n = 3 biological replicates).
-
BThe CUL3A and CUL3B expression level under different humidity levels after mock or BTH treatment in our RNAseq. TPM, transcript per million reads. Data represent mean ± SEM (n = 4 biological replicates).
-
CThe UBA1 and UBA2 expression level under different humidity levels after mock or BTH treatment in our RNAseq. TPM, transcript per million reads. Data represent mean ± SEM (n = 4 biological replicates).
-
DA global downregulation of protein poly‐ubiquitination under high humidity. Col‐0 plants were treated the same as in (A), and sampled 0, 12, or 24 h after BTH. Total proteins were extracted and poly‐ubiquitinated proteins were detected by western blot with anti‐ubiquitin antibody. Ubiquitination band intensity was quantified by Image J.
-
E, FCUL3A/3B mutation partially rescued disease susceptibility under low humidity. Col‐0 and cul3a/b plants were pre‐treatment with Lh or Hh for 24 h, infiltrated with Pst DC3000 at 1 × 10⁶ cfu/ml and placed back in different humidity settings. Disease symptoms (E) and bacterial population (F) were recorded 3 days post infiltration. Data represent mean ± SEM (n = 3 biological replicates; all data points from three experimental repeats are shown).
Data information: For results in (A, B, C, and F), different letters indicate statistically significant differences, as analyzed by two‐way ANOVA with Tukey's HSD post hoc test (P < 0.05). Experiments were repeated at least three times with similar results.
Source data are available online for this figure.
Figure EV5. Detection of NPR1 and BIK1 protein ubiquitination level and 26S proteasome activity under different humidity levels.
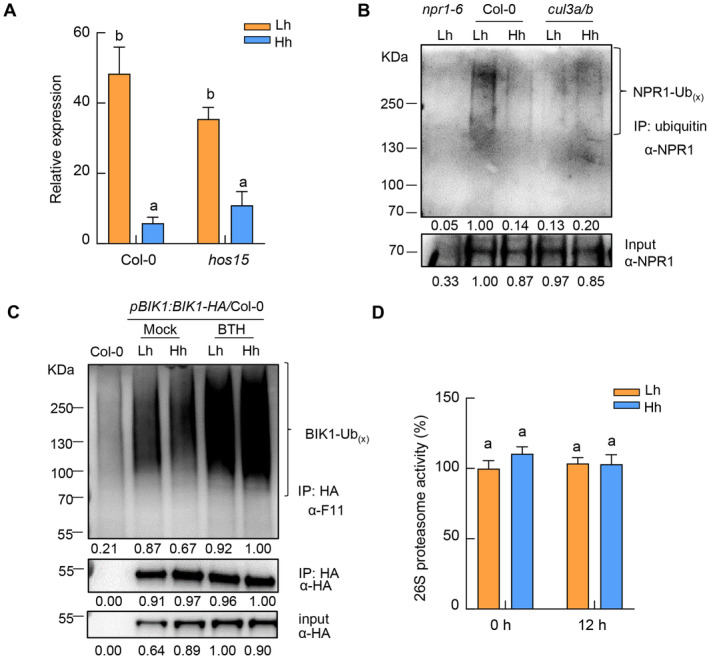
- RT‐qPCR analysis of PR1 expression level in Col‐0 and hos15 mutant plants. Plants were pre‐treated with different humidity levels for 24 h, sprayed with 100 μM BTH and sampled 12 h after BTH treatment. Data represent mean ± SEM (n = 3 biological replicates).
- NPR1 protein ubiquitination level under different humidity levels in Col‐0 and cul3a/b plants. The plants were treated the same as in (A). Ubiquitinated proteins were enriched using anti‐ubiquitin beads, and NPR1 (NPR1‐Ubx) in input and IP samples were detected by western blot with anti‐NPR1 antibody. Band intensity was quantified by Image J.
- BIK1 protein ubiquitination level under different humidity levels in pBIK1:BIK1‐HA/Col‐0 plants. Four‐week‐old plants were treated the same as in (A). BIK1‐HA protein was enriched using anti‐HA beads, and the ubiquitinated BIK1 (BIK1‐Ubx) was detected by anti‐F11 antibody in IP samples. Total BIK1‐HA proteins in input and IP samples were detected by anti‐HA antibody.
- High humidity does not affect the 26S proteasome activity in Arabidopsis leaves. Three‐to‐four‐week old Col‐0 plants were pre‐treated with different humidity levels for 24 h, sprayed with 100 μM BTH and sampled at 0 and 12 h after BTH treatment. Then total proteins were extracted and used for measurement of 26S proteasome activity using Suc‐LLVY‐AMC as substrate. Data represent mean ± SEM (n = 4 biological replicates).
Data information: For results in (A and D), different letters indicate statistically significant differences, as analyzed by two‐way ANOVA with Tukey's HSD post hoc test (P < 0.05). Experiments were repeated at least three times with similar results.
Source data are available online for this figure.
Protein ubiquitination is carried out by the E1‐E2‐E3 cascade in eukaryotic cells (Komander & Rape, 2012). We examined in our RNAseq the transcript level of genes encoding E1 ubiquitin‐activating enzymes (UBAs, 2 in Arabidopsis genome) and E2 ubiquitin‐conjugating enzymes (37 in Arabidopsis genome; Vierstra, 2009), in addition to Cullin 3 E3 ubiquitin ligase. We found that, in addition to CUL3 genes, UBA1/2, the two E1 genes in Arabidopsis, were also transcriptionally repressed under high humidity (Fig 6C). While the E2s specifically responsible for NPR1 protein ubiquitination are still unknown, we did not observe a global effect of humidity on E2 family genes (Appendix Fig S5A). We also investigated the overall ubiquitination level in total protein extracts from Arabidopsis leaf under different humidity levels. We found that, while BTH treatment induced a higher ubiquitination level in the cell, high humidity resulted in a global downregulation of ubiquitination after BTH treatment (Fig 6D), possibly due to the downregulation of E1 genes. These results indicate that high humidity impairs the cellular ubiquitination pathway, among which downregulation of E1s and CUL3 likely causes low ubiquitination of NPR1. As a control, we found that the ubiquitination of Botrytis‐Induced Kinase 1 (BIK1) protein, which is a key component in plant PTI signaling and ubiquitinated during immunity (Wang et al, 2018; Yu et al, 2022), does not obviously change under high humidity (Fig EV5C). In addition, we measured the 26S proteasome activity in plants under different humidity levels and found that high humidity does not seem to alter the total proteasome activity in Arabidopsis leaves (Fig EV5D).
Finally, we investigated whether the downregulation of CUL3 E3 ligase‐mediated NPR1 ubiquitination pathway is accountable for the enhanced disease susceptibility under high humidity, by carrying out Pst bacterial infection assay in the Arabidopsis cul3a/b mutant plant. Importantly, we observed a partial but significant rescue of Pst DC3000‐caused disease, including chlorosis/necrosis symptoms and bacterial multiplication, in the cul3a/b mutant plant under low humidity (Fig 6E and F), which resembles what is observed in the SA mutants (Fig 3A and B). The cul3a/b mutant still supports a higher bacterial growth under high humidity compared to low humidity, again likely due to high humidity's effect on promoting water soaking. Together, these results suggest that plant E1‐E2‐E3 ubiquitination cascade, especially CUL3‐based E3 ubiquitin ligase, is a major sector that is targeted by high humidity leading to reduced NPR1 activity and disease susceptibility.
Discussion
High air humidity promotes numerous plant diseases in agricultural ecosystems including fields and greenhouses. Uncovering the molecular basis of it represents an important advance in the full understanding of disease epidemics. Our study shows that high humidity induces a variety of plant physiological responses. We define SA pathway, which is essential for disease resistance in diverse plant species, and NPR1 protein, an SA receptor in the signal transduction, as biologically relevant targets of high air humidity, disruption of which leads to impaired resistance of plants and higher disease. We show that high humidity impairs the cellular ubiquitination pathway, particularly Cullin 3‐based E3 ligase, leading to low NPR1 ubiquitination, its inactivity and low SA responses (Fig 7). Our study provides new insights into the mechanism of air humidity influence on plant diseases observed for decades and sets a knowledge basis for engineering plant resistance under unfavorable climate conditions.
Figure 7. A schematic model illustrating the air humidity influences on salicylic acid responses in Arabidopsis .
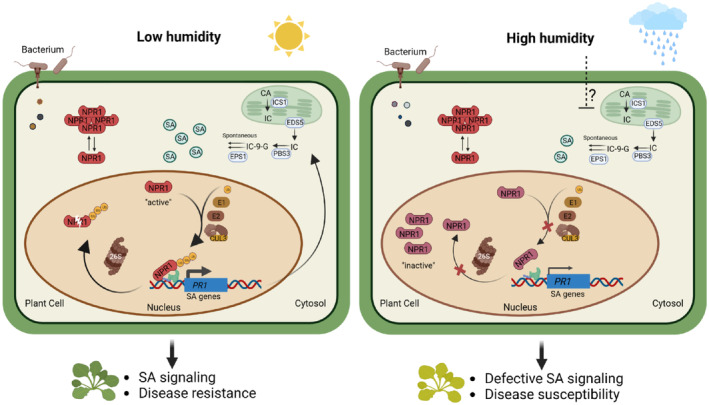
A working model illustrating the findings in this study. Under low or moderate humidity (left panel), SA is rapidly produced upon pathogen infection and perceived by SA receptors, including NPR1. SA signaling induces SA synthesis gene expression and SA production, forming a positive feedback loop. NPR1 protein is ubiquitinated by the E1‐E2‐Cullin 3 (CUL3)‐based E3 ubiquitin ligase pathway, and this ubiquitination is indispensable for the recruitment of NPR1 protein to chromatin and activating SA gene expression. Ubiquitination also triggers NPR1 protein degradation through the 26S proteasome. Under high humidity (right panel), the cellular ubiquitination pathway, including E1s and Cullin3 genes, are downregulated. As a result, NPR1 protein is less ubiquitinated and fails to bind the target gene (PR1) promoter effectively. The reduction in NPR1 ubiquitination also links to a slower NPR1 protein turnover, which possibly impedes NPR1 function and SA gene transcription, and an over‐accumulation of NPR1 protein in the nucleus. The poor activity of NPR1 protein leads to defective SA responses, low SA and eventually enhanced disease susceptibility of plants under high humidity. In addition to NPR1‐mediated signaling, high humidity possibly affects other SA‐associated steps (e.g., SA biosynthesis, indicated by a question mark). CA, chorismate; IC, isochorismate; IC‐9‐G, isochorismate‐9‐glutamate; ICS1, isochorismate synthase 1; PBS3, avrPphB susceptible 3; EPS1, enhanced Pseudomonas susceptibility 1.
Ubiquitination regulates different aspects of eukaryotic transcription, in both proteasome‐dependent and ‐independent manners (Geng et al, 2012; Mark & Rape, 2021). Independently of proteolysis, ubiquitination of transcription activators in yeast and human cells could promote transcription through mechanisms like increasing promoter occupancy or recruitment of co‐activator (Adhikary et al, 2005; Archer et al, 2008). A previous study suggested that Cullin 3 E3 ligase‐mediated NPR1 ubiquitination promotes its transcriptional activity (Spoel et al, 2009; Skelly et al, 2019). Our study is in agreement with this and supports a working model that Cullin 3 E3 ligase‐mediated NPR1 ubiquitination is important for its association with chromatin and that high humidity suppresses the E1‐E2‐CUL3 E3 pathway, leading to poor NPR1 activity. In addition, we found that the lower NPR1 ubiquitination also links to a slower degradation under high humidity. Previous studies in eukaryotic cells indicated a putative stimulatory role of ubiquitination‐proteasome system to the activity of unstable transcription activators, including NPR1 (Reid et al, 2003; Lipford et al, 2005; Muratani et al, 2005; Kodadek et al, 2006; Chae et al, 2008; Spoel et al, 2009; Zhai et al, 2013). We hypothesize that reduced NPR1 protein turnover could possibly contribute to a lower NPR1 promoter binding (e.g., via preventing the release of components in pre‐initiation complex (PIC) and re‐assembly of PIC for the new round of transcription; (Lipford & Deshaies, 2003)) or suppress SA gene transcription via other mechanisms. Alternatively, decrease of NPR1 protein turnover is a side effect and the reduction in NPR1 protein ubiquitination and chromatin binding is the real cause. More detailed studies are needed to clarify the different scenarios. Regardless, our results emphasize “CUL3 E3 ligase‐mediated NPR1 ubiquitination” as a major target of high humidity, and disruption of it leads to insensitivity to humidity in PR gene expression and bacterial disease (Fig 6).
In addition to ubiquitination, previous studies showed that sumoylation of NPR1 protein is important for its activity (Saleh et al, 2015). However, our attempts to detect NPR1 protein sumoylation under different humidity level, using SUMO antibody, failed to reveal any sumoylation band, likely due to the limited detection sensitivity and/or low NPR1 sumoylation level under our conditions. Nonetheless, we checked our RNAseq for the expression of SUMO3, which is conjugated to NPR1 protein (Saleh et al, 2015), and found that its expression is slightly induced under high humidity (Appendix Fig S5B). Therefore, the low NPR1 activity under high humidity is unlikely due to SUMO3 expression. NPR1 protein binds to the TGA transcription factors to activate SA gene expression (Fan & Dong, 2002; Kumar et al, 2022). Whether the lower ubiquitination level of NPR1 protein under high humidity affects the interaction between NPR1 and TGAs, and therefore binding to the target gene promoter, is important to test in the future. In addition, NPR1 function is regulated by the CBP/p300‐family histone acetyltransferases (HACs), which are recruited to the NPR1‐TGA‐HACs complex upon SA signal and reprogram chromatin status to activate gene expression (Jin et al, 2018). The expression level of HAC1/5/12, which are important for SA gene expression (Jin et al, 2018), are not regulated by high humidity (Appendix Fig S5B). Whether high humidity affects the formation of NPR1‐TGA‐HACs complex, leading to low SA gene transcription, warrants future investigations.
While SA signaling is strongly inhibited by high humidity, our results suggested that SA and Pip production are also likely to be suppressed under high humidity, since in the npr1‐6 mutant plant, the basal level of SA and SAG is still inhibited under high humidity (Fig EV3C). It will be important to examine whether the SA synthesis steps, such as production of SA precursors or the activity of key biosynthetic enzymes (e.g., ICS1 and PBS3), are negatively regulated under high humidity. Of note, a recent study showed that high temperature suppresses SA biosynthesis in Arabidopsis via reducing the activity of a transcription regulator GBPL3 and the transcription of CBP60g, a master regulator of SA synthesis (Kim et al, 2022). Whether high humidity affects the same module to suppress SA synthesis requests further study. In addition, whether there are NPR1‐independent mechanisms by which high humidity suppresses SA and immune signaling (e.g., through downregulation of the ubiquitination pathway, in light of the importance of an intact ubiquitination pathway in stimulating plant immunity (Goritschnig et al, 2007)) is also interesting to explore.
Our study reveals that high humidity induces various physiological responses in plants, affecting their morphology, ROS levels and gene expression on a genome‐wide scale (Fig 1). However, the impact of these responses on plant fitness under high humidity and how they interact with plant immune systems require further investigation. Furthermore, signaling events upstream of high humidity suppression of SA pathway, namely the humidity sensing mechanisms, remain largely unexplored at the moment and should be important to study in the future. We propose that elevated air humidity poses a potential threat to plants, as prolonged exposure leads to stomatal dysfunction and reduced photosynthesis (Arve et al, 2013; Fanourakis et al, 2016). As a result, plants evolved to initiate physiological adaptations to cope with this condition, some of which leads to downregulation of plant immunity, possibly through hormone crosstalk or other mechanisms. In this scenario, suppressing plant immunity could be a trade‐off mechanism to prioritize plant growth and survival over disease resistance in high humidity climates. A comprehensive understanding of the environmental influences on plants should facilitate the development of innovative strategies to enhance plant immune capacity and enable plants to better withstand adverse climate conditions.
Materials and Methods
Plant materials, growth condition, and humidity treatment
All Arabidopsis plants used in this study were in the Columbia‐0 genetic background. Seeds were surface‐sterilized with 5% sodium hypochlorite solution for 10 min and then washed with sterile water. Seeds were cold‐treated for 2 days before sowing on soil pots. All plants were grown in a growth chamber (Hettich) with the temperature setting of 22°C, 12 h light/12 h dark photoperiod and 60% relative humidity. Plants were grown to 3.5–4 weeks for experiments.
The npr1‐6 (SAIL_708F09; Huot et al, 2017), sid2‐2 (Wildermuth et al, 2001), and hos15 (Shen et al, 2020) mutants were previously characterized and reported. The cul3a/b mutant was generated by crossing of a cul3a knockout allele (SALK_050756; Figueroa et al, 2005) with a cul3b knockdown allele (SALK_098014; Spoel et al, 2009). To generate the pNPR1:NPR1‐YFP/npr1‐6 plant, the pNPR1:NPR1‐YFP construct (Huot et al, 2017) was mobilized into Agrobacterium tumefaciens GV3101 strain and transformed into the npr1‐6 plant by floral dip. To generate the 35S:NPR1‐YFP/sid2‐2 plants, the coding sequence of the NPR1 (AT1G64280) was amplified from cDNA derived from Col‐0 plant and cloned into the gateway entry vector pENTR/D‐TOPO (Invitrogen) and then transferred into the destination vector pGWB605 vector (Nakamura et al, 2010). The binary vector was mobilized to Agro. tumefaciens GV3101 strain, and the 35S:NPR1‐YFP expression cassette was transformed into the sid2‐2 mutant plant by floral dip method.
For humidity treatment, plants were grown under ~60% RH till 3.5–4 weeks old and then placed in two chambers (MMM, Germany), in which humidity was set to 45–50% RH (for low humidity) or 95% RH (for high humidity). Temperature was set at 22°C and photoperiod at 12 h light/12 h dark in both chambers. LED lights were used as the light source in these chambers.
Chemical treatment
For experiments with elicitor treatment, plants were pre‐treated with different humidity levels for 24 h before being sprayed with the following chemical: BTH (Sigma, Catalog number: 32820‐100MG; 100 μM, dissolved in 0.1% DMSO supplemented with 0.01% Silwet L‐77), MeJA (Sigma; 100 μM, dissolved in 0.1% ethanol supplemented with 0.01% Tween20) or flg22 (Phyto Tech; 200 nM, dissolved in ddH2O supplemented with 0.01% Silwet L‐77). Treated plants were placed back in different humidity settings and leaf tissue was sampled at different time points for protein detection, transcript measurement, cellular fractionation, confocal imaging, and hormone quantification.
Bacterial disease assay
Pst DC3000 bacteria were grown in LM liquid medium supplemented with 50 mg/l Rifampicin for overnight. The next morning, bacteria were collected by centrifugation at 2,500 g for 5 min, washed with sterile water and resuspended. The concertation was adjusted to 1 × 10⁶ cfu/ml (OD = 0.002). Bacteria were infiltrated into Arabidopsis leaves with a needleless syringe, and the infiltrated plants were kept under ambient humidity for about 1 h for water to evaporate and then put into the chamber with controlled humidity for disease development. Disease symptom and bacteria population were recorded and quantified 3 days later.
Measurement of ROS and MAPK phosphorylation
Four‐week‐old plants were used to detect flg22‐induced ROS and MAPK phosphorylation according to the previous report (Yuan et al, 2021). Briefly, Col‐0 plants were placed in different humidity chambers for 24 h. Leaf discs (5.5 mm in diameter) were then collected and floated on 200 μl sterilized water in a 96‐well plate, and incubated overnight at room temperature under continuous light. On the next day, water was replaced with a solution containing 30 mg/l (w/v) luminol (Sigma‐Aldrich) and 20 mg/l (w/v) peroxidase from horseradish (Sigma‐Aldrich) with 100 nM flg22. Luminescence was recorded for 1 h with a signal integration time of 1 min, using Varioskan LUX Multimode Microplate Reader (Thermo Fisher Scientific). Data were analyzed with SkanIt Software (Thermo Scientific) and Excel.
For ROS detection in plants after different humidity treatments (Fig 1), three‐to‐four‐week‐old Col‐0 plants were treated with different humidity levels for 2 days and ROS was detected by 3,3′‐Diaminobenzidine (DAB, Sigma) staining. Briefly, leaves were collected and vacuum infiltrated with a DAB solution (1 mg/ml DAB, 0.05% (v/v) Tween 20, 10 mM Na2HPO4, pH 6.0). Samples were incubated in dark for 9 h. Leaves were destained and hydrogen peroxide is visualized as a dark brown coloration.
For flg22‐induced MAPK phosphorylation, plants were placed in different humidity chambers for 24 h, sprayed with 200 nM flg22 and then put back in different humidity chambers. Leaves were collected at different times (0, 15, and 30 min) after flg22 treatment and quickly frozen in liquid nitrogen. Proteins were extracted in the extraction buffer (50 mM Tris–HCl pH 7.5, 150 mM NaCl, 5 mM EDTA pH 7.5, 1 mM DTT, 1% Triton X‐100, 1 mM PMSF, 1× Protease inhibitor cocktail (Roche), 1× Phosphatase inhibitor cocktail (Roche)). Protein concentration was measured by detergent‐compatible Bradford protein assay kit (Thermo), and equal amount of protein was loaded onto 12% SDS–PAGE gel. Phosphorylated MAPK proteins were detected using the Phospho‐p44/42 MAPK (Erk1/2; Thr202/Tyr204) antibody (Cell Signaling Technology). The protein images were taken by the Tanon‐5200 imaging system (Tanon).
RNA extraction, cDNA synthesis, and RT‐qPCR
Leaf samples were snap‐frozen by liquid nitrogen, and grounded powders were homogenized in the Trizol reagent (Invitrogen). Total RNA was extracted according to the manufacture instructions. RNA samples were quantified using a NanoDrop spectrophotometer (Thermo Scientific). Reverse transcription was performed using the ReverTra Ace qPCR RT Master Mix with gDNA remover (TOYOBO), and qPCR was performed using the SYBR Green Realtime PCR Master Mix (TOYOBO) on a CFX real‐time machine (Bio‐Rad). The PP2AA3 gene was used as the reference gene for normalization. All primers for qPCR are listed in Table 2.
Table 2.
Primers used in this study.
| Primer name | Sequences (5′–3′) | Purpose |
|---|---|---|
| PP2AA3‐qRT‐FP | GGTTACAAGACAAGGTTCACTC | For RT‐qPCR |
| PP2AA3‐qRT‐RP | CATTCAGGACCAAACTCTTCAG | |
| WRKY29‐qRT‐FP | CTCCATACCCAAGGAGTTATTACAG | |
| WRKY29‐qRT‐RP | CGGGTTGGTAGTTCATGATTG | |
| NHL10‐qRT‐FP | CAACCGTTCTCACACCAACGT | |
| NHL10‐qRT‐RP | GGAGGTAGTTGTAGTTCCGT | |
| FRK1‐qRT‐FP | GCCAACGGAGACATTAGAG | |
| FRK1‐qRT‐RP | CCATAACGACCTGACTCATC | |
| PR2‐qRT‐FP | GGAAGGTTCAGGGATGAGTATAAG | |
| PR2‐qRT‐RP | CTCCCATGTAGCTGAAGTAAGG | |
| EDS5‐qRT‐FP | TCGTGACAAGAAGTGGCTATG | |
| EDS5‐qRT‐RP | CGAAAGAAGCCGTCGTAGATATAG | |
| EDS1‐qRT‐FP | CTGAGTTAGCCGGTGT | |
| EDS1‐qRT‐RP | TTTCATGTACGGCCCTG | |
| PR1‐qRT‐FP | GGCTAACTACAACTACGCTG | |
| PR1‐qRT‐RP | TCTCGTTCACATAATTCCCAC | |
| ICS1‐qRT‐FP | ACTTACTAACCAGTCCGAAAGACGA | |
| ICS1‐qRT‐RP | ACAACAACTCTGTCACATATACCGT | |
| PAD4‐qRT‐FP | TTAGCCGTTGAAGCTCT | |
| PAD4‐qRT‐RP | ATGCATCGCAACGATCT | |
| PR5‐qRT‐FP | ACTGTGGCGGTCTAAG | |
| PR5‐qRT‐RP | CGTGGGAGGACAAGTTT | |
| CBP60g‐qRT‐FP | AATAACGAGGAGGATGAGAACG | |
| CBP60g‐qRT‐RP | TCAGACACGGTAAGAAACATCG | |
| CUL3A‐qRT‐FP | AAAAATCCAAGCTTATCGAGGC | |
| CUL3A‐qRT‐RP | AACATGAGTCTTTTTGGTGCTC | |
| CUL3B‐qRT‐FP | TTCGACTTTCCAAATGTGTGTC | |
| CUL3B‐qRT‐RP | TTACCTTTTACACACGCCATTG | |
| FRK1‐qRT‐FP | TGCAGCGCAAGGACTAGAG | |
| FRK1‐qRT‐RP | ATCTTCGCTTGGAGCTTCTC | |
| WRKY29‐qRT‐FP | CTCCATACCCAAGGAGTTATTACAG | |
| WRKY29‐qRT‐RP | CGGGTTGGTAGTTCATGATTG | |
| IOS1‐qRT‐FP | CTTGACCGGAGAGATCTTAG | |
| IOS1‐qRT‐RP | AGCTAGAAACTCTGGGACTG | |
| GST1‐qRT‐FP | GCAAGGACATGGCGATCATA | |
| GST1‐qRT‐RP | GCTTTAAGACTTGCTCCCAAAC | |
| LOX2‐qRT‐FP | GACTGACCAGCGGATTACGG | |
| LOX2‐qRT‐RP | CTCTGGTGTTTGGGAAGGCA | |
| MYC2‐qRT‐FP | TCGGCGTTGATGGATTTGGA | |
| MYC2‐qRT‐RP | TCTTCACCGTCGCTTGTTGA | |
| VSP2‐qRT‐FP | ACCCTCCTCTCTAGTATTCCC | |
| VSP2‐qRT‐RP | ACTTGTACACCACTTGCCTCA | |
| JAZ8‐qRT‐FP | CTCAAACGGGTCGGATCCTC | |
| JAZ8‐qRT‐RP | CGTCGTGAATGGTACGGTGA | |
| PDF1.2‐qRT‐FP | TTTGCTGCTTTCGACGCAC | |
| PDF1.2‐qRT‐RP | GATTCTTGCATGCATTACTG | |
| pTOPO‐NPR1‐FP | ACGGGATCCATGGACACCACCATTGATGGATTC1 | For cloning |
| pTOPO‐NPR1‐RP | AGCGGAATTCCCGACGACGATGAGAGAGTTTACG1 | |
| PR1‐qRT‐FP‐1 | GCATGAAACACTAAGAAACAAATAATTCTTG | For ChIP‐qPCR |
| PR1‐qRT‐RP‐1 | TGTATATAGTTGTTTCATGTCATTCAGTTG | |
| PR1‐qRT‐FP‐2 | ACAAAGTGTATACAATGTCAATCGGTG | |
| PR1‐qRT‐RP‐2 | TGAGTATCTCTATCACTCTTGCCTATG | |
| Actin‐qRT‐FP | GTAACATTGTGCTCAGTGGTGGAA | |
| Actin‐qRT‐RP | CCTGGACCTGCCTCATCATACT | |
| TA3‐qRT‐FP | CTGCGTGGAAGTCTGTCAAA | |
| TA3‐qRT‐RP | CTATGCCACAGGGCAGTTTT |
1Bold letters indicate restriction enzyme sites added in the primer for molecular cloning.
RNA‐sequencing and data analysis
For RNA‐seq experiment, Col‐0 plants were treated with high or low humidity for 24 h, sprayed with 100 μM BTH and placed back in different humidity settings. Leaves were collected 12 h after BTH/Mock treatment and four leaves were collected as one biological replicate. Four biological replicates were collected for each treatment. For transcriptome analysis of plant under high, moderate and low humidity, the plants were grown in growth chambers under moderate humidity (~60% RH) till 3–4 weeks old and moved to MMM chambers for different humidity treatments. Leave tissues were collected at 1 h after humidity treatment and two leaves were collected as one biological replicate. Four biological replicates were collected for each treatment.
Total RNA was extracted using Trizol Reagent (Invitrogen) based on the manufacturer's instructions, and genomic DNA was removed using the DNaseI (Invitrogen). RNA was further purified using the RNeasy MinElute Cleanup kit (QIAGEN). RNA quality check, library construction, and sequencing were performed by the Majorbio company. Briefly, RNA quality was determined by 2100 Bioanalyser (Agilent) and quantified using the ND‐2000 (NanoDrop Technologies). RNA‐seq library was prepared using the TruSeq TM RNA sample preparation Kit from Illumina (San Diego, CA), using 1 μg of total RNA for each sample. The messenger RNA was isolated according to the polyA selection method by oligo (dT) beads and then fragmented in fragmentation buffer. Double‐stranded cDNA was synthesized using a SuperScript double‐stranded cDNA synthesis kit (Invitrogen, CA) with random hexamer primers (Illumina). Then the synthesized cDNA was subjected to end‐repair, phosphorylation, and ‘A' base addition according to Illumina's library construction protocol. Libraries were size selected for cDNA target fragments of 300 bp on 2% Low Range Ultra Agarose followed by PCR amplification using Phusion DNA polymerase (NEB) for 15 cycles. After quantified by TBS380 (Picogreen), the paired‐end sequencing library was sequenced with the Illumina NovaSeq 6000 sequencer (2 × 150 bp read length).
For data analysis, raw paired‐end reads were trimmed and quality controlled by Fastp with default parameters (Chen et al, 2018). Then clean reads were separately aligned to reference genome with orientation mode using HISAT2 software (Kim et al, 2015). The mapped reads of each sample were assembled by StringTie in a reference‐based approach (Pertea et al, 2015). The expression level of each transcript was calculated according to the transcripts per million reads (TPM) method, and RSEM was used to quantify gene abundance (Li & Dewey, 2011). The differential expression analysis was performed by the DEGSeq2 with default parameters (Love et al, 2014).
Phytohormone extraction and quantification
Phytohormone extraction and quantification were performed based on previous reports with slight modification (Huot et al, 2017). Leaf tissue was frozen and ground in liquid nitrogen and hormones were extracted at 4°C in the ice‐cold extraction buffer (80% methanol in water, 0.1% formic acid and 0.1 g/l butylated hydroxytoluene). The extraction step was repeated twice and total supernatant was speed‐dried in a vacuum centrifugal concentrator (Beijing JM Technology). The pellet was resuspended in 30% methanol solution. Hormone levels were quantified using the AB SCIEX 4000Q TARP LC/MS/MS system (SCIEX QTRAP 6500+). Selected ion monitoring (SIM) was conducted in the negative ES channel for SA (137.0 > 93.0), SAG (299.0 > 1,377.0), JA (209.0 > 59.0), JA‐Ile (322.1 > 130.1), and in the positive ES channel for Pip (130.0 > 84.0). Parent > daughter SIM pairs, the optimal source cone and collision energy voltages for each molecular were determined by the QTRAP 6500+. All hormone concentrations were normalized by sample fresh weight (FW) in gram.
Detection of NPR1 ubiquitination
Four‐week‐old plants were pre‐treated with different humidity levels for 24 h and then 100 μM MG132 solution was infiltrated into the leaves. Leaves were air‐dried for about 0.5 h and then 100 μM BTH solution was sprayed on both sides of the leaf. Plants were then placed back in different humidity settings and samples were taken 12 h later. About 60 leaf discs were sampled for each sample. This assay was performed according to a pervious report (Yasuda et al, 2020) with some modifications. Total proteins were extracted in extraction buffer, which contains 50 mM Tris–HCl pH 7.5, 100 mM NaCl, 10% glycerol, 6 M Urea, 50 μM MG132, 50 μM PR‐619 (Abcam), 10 mM Iodoacetamide (Sigma), 1× Protease inhibitor cocktail (Roche). Protein extracts were centrifuged at 12,000 g at 4°C for 5 min and supernatant was taken. Anti‐ubiquitin beads (Cytoskeleton, UBA01‐beads) or anti‐GFP beads (Chromotek, gtma‐20) were added and incubated for 2 h at 4°C. The beads were washed three times with wash buffer (50 mM Tris–HCl pH 7.5, 100 mM NaCl, 10% glycerol, 50 μM MG132, 50 μM PR‐619, 10 mM Iodoacetamide, 1× Protease inhibitor cocktail), and proteins were eluted in 60 μl of 1× LDS elution buffer. Ubiquitinated NPR1 protein was detected using anti‐GFP antibody (Abmart, M20004M) or an anti‐ubiquitin antibody Ubiquitin (F‐11; Santa Cruz Biotechnology, sc‐271289). NPR1‐YFP protein in input or IP samples was detected using the anti‐GFP antibody (Abmart). For detection of NPR1 ubiquitination level in the cul3a/b plants, nuclear fractions were first isolated according to the previous report (Gendrel et al, 2005) and ubiquitinated proteins were enriched using anti‐ubiquitin beads (Cytoskeleton, UBA01‐beads). The ubiquitinated NPR1 protein in Col‐0 and cul3a/b plants was detected by anti‐NPR1 antibody (Agrisera, AS121854).
Detection of NPR1 phosphorylation sites
The pNPR1::NPR1‐YFP/npr1‐6 plants were pre‐treated with high or low humidity for 24 h, sprayed with BTH and sampled 12 h later. Total proteins were extracted in 16 ml of extraction buffer (50 mM Tris pH 7.5, 150 mM NaCl, 0.5 mM EDTA, 1 mM DTT, 50 μM NEM, 5% glycerol, 10 mM IAA (Iodoacetamide, Sigma), 5 μM MG132, 25 mM NaF, 1 mM Na2MO4, 1× protease inhibitor cocktail, 1× phosphatase inhibitor cocktail, 0.5% TritonX‐100, 0.5% CA630 and 0.5% SDS) on ice for 30 min. After centrifugation at 14,000 g at 4°C for 10 min, the supernatant lysate was filtered by two layers of Miracloth (Millipore) and diluted with the same volume of extraction buffer without detergent. NPR1‐YFP protein was pulled down by GFP‐Trap magnetic beads (Chromotek) with agitation for 3 h at 4°C. Beads were washed three times with extraction buffer without detergent. Eluted proteins were separated on a 10% polyacrylamide gel and stained with the Fast Silver Stain Kit (Beyotime Biotech). The NPR1‐YFP band was cut and in‐gel digested by trypsin (Promega, V5280). The phosphorylated peptides of NPR1 protein were detected by LC–MS/MS at the Proteomics/Mass Spectrometry facility at CAS for Excellence in Molecular Plant Sciences in Shanghai.
ChIP‐qPCR analysis
The ChIP experiment was performed as previously reported (Kim et al, 2022), with some modifications. The treated plant leaves were collected and fixed in 1% formaldehyde by vacuum infiltration on ice. Then the fixation solution was replaced with 125 mM glycine solution and vacuumed for 5 min. Leaves were washed with ice water three times and flash‐frozen in liquid nitrogen, and grounded into powder. About 1.5 g powder per sample were used to extract the pure nuclei according to the previous report (Gendrel et al, 2005). The 1× protease inhibitor cocktail and 50 μM MG132 were added throughout extraction process to increase protein stability. Pure nuclei pellet was suspended in 150 μl of nuclei lysis buffer (50 mM Tris pH 8.0, 10 mM EDTA pH 8.0, 1% SDS, 1× protease inhibitor cocktail, 50 μM MG132) and incubated on ice for 30 min. Then 1,250 μl of ChIP dilution buffer (16.7 mM Tris pH 8.0, 167 mM NaCl, 1.2 mM EDTA, 0.01% SDS, 1× protease inhibitor cocktail, 50 μM MG132) were added and the samples were sonicated for 10 min on Bioruptor (Diagenode) at 4°C. Then 400 μl of ChIP dilution buffer and 200 μl of 10% Triton X‐100 were added and samples were centrifuged at 12,000 g for 15 min to remove debris. For pre‐clearing, samples were incubated with 25 μl of protein A beads (Millipore, IP02) for 2 h in cold room (100 μl were collected as input). To capture the DNA–protein complex, GFP‐Trap magnetic beads (Chromotek, gtma‐20) were added and incubated overnight at 4°C. After washing of beads, DNA–protein complexes were eluted with 540 μl elution buffer (50 mM Tris pH 8.0, 10 mM EDTA pH 8.0, 1% SDS) and boiled at 65°C for 30 min. Then 20 μl of 5 M NaCl were added and samples were incubated at 65°C overnight to remove crosslinking. DNA were purified and quantified by qPCR. Primers are listed in Table 2.
Nuclear fractionation and western blotting
Plant nuclei were isolated from plants using the CelLytic PN Isolation/Extraction Kit (Sigma) and nine leaf discs (0.75 cm in diameter) were collected per sample/treatment. And 100 μM MG132 (Selleck) and 1 × EDTA‐free protease inhibitor cocktail (Roche) were freshly added in the extraction buffer. Following protein extraction and fractionation, total and cytosolic fractions were mixed with 4 × LDS sample buffer and nuclear fraction was resuspended in 60 μl 1 × LDS sample buffer. The α‐GFP antibody (Abmart, M20004M) was used to detect the NPR1‐YFP protein and α‐Histone 3 antibody (Agrisera, AS10710) was used to detect Histone 3 (as loading control), and Rubisco was detected by Ponceau S staining. The poly‐ubiquitination of total protein extracts was detected by anti‐ubiquitin antibody Ubiquitin (F‐11; Santa Cruz Biotechnology, sc‐271289).
Confocal laser scanning microscopy
Confocal images were taken by a Leica TCS SP8 STED system with Z stack program. YFP was excited with an argon laser using a 488‐nm beam splitter, and emission was detected with a 520–580‐nm bandpass filter. All confocal images were taken using the same paraments. Fluorescence quantification was performed on the ImageJ software. Fluorescence intensity on each image was determined with a 594 minimum threshold and the number of nuclei with detectable fluorescence was counted with a > 3‐Infinity size setting.
In vitro cell‐free degradation assay
Cell‐free degradation assays were performed as described previously (Spoel et al, 2009). Briefly, the pNPR1:NPR1‐YFP/npr1‐6 and 35S:NPR1‐YFP/sid2‐2 plants were pre‐treated with different humidity levels for 24 h and then sprayed with 100 μM BTH, and 36 leaf discs (0.75 cm in diameter) were sampled 12 h later. Leaf tissues were ground in liquid nitrogen and total proteins were extracted in the extraction buffer (25 mM Tris–HCl, pH 7.5, 10 mM MgCl2, 10 mM NaCl, 10 mM ATP, 0.2% TritonX‐100, 0.2% CA630, and 5 mM DTT). The extracted proteins were then incubated at room temperature for 0–60 min, in the presence or absence of 100 μM MG132, and samples were taken at different time points. The NPR1‐YFP protein was detected by western blot using the GFP antibody. Band intensity was quantified using ImageJ software.
Proteasome activity assay
In vivo 26S proteasome activity assay was performed according to a previous report (Yang et al, 2016) with minor modifications. Briefly, 3–4‐week‐old plants were pre‐treated with high or low humidity for 24 h, sprayed with 100 μM BTH and sampled at 0 and 12 h. For each biological repeat, two leaves were ground in liquid nitrogen and proteins were extracted in extraction buffer (50 mM Tris–HCl, pH 7.5, 150 mM NaCl, 5 mM ATP, 1% Triton‐100 and 20% glycerol) for 20 min at 4°C and cell debris were removed by centrifugation at 12,000 g at 4 °C. Protein concentration was determined by Bradford Assay Reagent (Thermofisher, 23246). To measure the 26S proteasome activity, 100 μg of proteins was diluted with buffer I (50 mM Tris–HCl, pH 7.5, 2 mM DTT, 2 mM MgCl2, and 2 mM ATP) to a final volume of 1 ml (assayed in quadruplicate). Samples were incubated with the proteasome substrate Suc‐LLVY‐AMC (Abcam; final concentration 50 μM) and incubated for 2 h at 37°C or pre‐incubated with 2.5 μM MG132 for 30 min at room temperature before adding Suc‐LLVY‐AMC (no proteasome activity control). All reactions were conducted in a 96‐well plate and the proteasome activity was monitored by a Varioskan Flash micro‐plate reader (Thermo Scientific), with 350 nm excitation and 438 nm emission. The exact 26S proteasome activity was obtained by subtracting the activity of non‐proteasome (with MG132) from the overall measured values.
Author contributions
Xiu‐Fang Xin: Conceptualization; data curation; supervision; funding acquisition; validation; writing – original draft; project administration; writing – review and editing. Lingya Yao: Conceptualization; data curation; formal analysis; investigation; visualization; methodology; writing – original draft; project administration; writing – review and editing. Zeyu Jiang: Conceptualization; data curation; formal analysis; investigation; visualization; methodology; writing – original draft; project administration; writing – review and editing. Yiping Wang: Formal analysis; investigation; methodology. Yezhou Hu: Data curation; validation; investigation; methodology. Guodong Hao: Data curation; investigation; methodology. Weili Zhong: Data curation; investigation. Shiwei Wan: Investigation; methodology.
Disclosure and competing interests statement
The authors declare that they have no conflict of interest.
Supporting information
Appendix
Expanded View Figures PDF
Table EV1
Dataset EV1
Dataset EV2
Source Data for Expanded View and Appendix
PDF+
Source Data for Figure 1
Source Data for Figure 2
Source Data for Figure 3
Source Data for Figure 4
Source Data for Figure 5
Source Data for Figure 6
Acknowledgements
We thank all the members in Xin lab for helpful discussions. We thank the Greenhouse and Confocal Microscopy Imaging facility at the CAS Center for Excellence in Molecular Plant Sciences for support in plant growth and confocal imaging. We thank Wenli Hu, Shanshan Wang and Lianyan Jing at the Metabolomics‐Mass Spectrometry facility at the CAS Center for Excellence in Molecular Plant Sciences for the help with hormone quantification. The pNPR1:NPR1‐YFP construct was kindly provided by Dr. Sheng Yang He's lab at Duke University, USA. The pBIK1:BIK1‐HA/Col‐0 seed was kindly provided by Dr. Jian‐Min Zhou's lab at Chinese Academy of Sciences, Institute of Genetics and Developmental Biology, China. This research was supported by Chinese Academy of Sciences, Center for Excellence in Molecular Plant Sciences/Institute of Plant Physiology and Ecology, National Key Laboratory of Molecular Plant Genetics, Shanghai Pilot Program for Basic Research – Chinese Academy of Science, Shanghai Branch (JCYJ‐SHFY‐2021‐007), Ministry of Science and Technology‐Key Research and Development Program (Project number: 2021YFA1301800) and Chinese Academy of Sciences Strategic Priority Research Program (Type‐B; project number: XDB27040211). Dr. Lingya Yao is supported by the Youth Program of National Natural Science Foundation of China (NSFC) (project number: 32100238).
The EMBO Journal (2023) 42: e113499
Data availability
The RNA‐seq data have been deposited into the NCBI Gene Expression Omnibus under accession GSE210893 (http://www.ncbi.nlm.nih.gov/geo/query/acc.cgi?acc=GSE210893) and GSE236463 (http://www.ncbi.nlm.nih.gov/geo/query/acc.cgi?acc=GSE236463). All other data are available in the main text or supporting materials. The statistical analysis was performed by student's t‐test on Excel or two‐way ANOVA with Tukey's HSD post hoc test (P < 0.05) on the GraphPad Prism software.
References
- Abrahamian P, Klein‐Gordon JM, Jones JB, Vallad GE (2021) Epidemiology, diversity, and management of bacterial spot of tomato caused by Xanthomonas perforans . Appl Microbiol Biotechnol 105: 6143–6158 [DOI] [PubMed] [Google Scholar]
- Adhikary S, Marinoni F, Hock A, Hulleman E, Popov N, Beier R, Bernard S, Quarto M, Capra M, Goettig S et al (2005) The ubiquitin ligase HectH9 regulates transcriptional activation by Myc and is essential for tumor cell proliferation. Cell 123: 409–421 [DOI] [PubMed] [Google Scholar]
- Aerts N, Pereira Mendes M, Van Wees SCM (2021) Multiple levels of crosstalk in hormone networks regulating plant defense. Plant J 105: 489–504 [DOI] [PMC free article] [PubMed] [Google Scholar]
- An C, Mou Z (2011) Salicylic acid and its function in plant immunity. J Integr Plant Biol 53: 412–428 [DOI] [PubMed] [Google Scholar]
- Archer CT, Delahodde A, Gonzalez F, Johnston SA, Kodadek T (2008) Activation domain‐dependent monoubiquitylation of Gal4 protein is essential for promoter binding in vivo. J Biol Chem 283: 12614–12623 [DOI] [PMC free article] [PubMed] [Google Scholar]
- Arve LE, Terfa MT, Gislerod HR, Olsen JE, Torre S (2013) High relative air humidity and continuous light reduce stomata functionality by affecting the ABA regulation in rose leaves. Plant Cell Environ 36: 382–392 [DOI] [PubMed] [Google Scholar]
- Burger M, Chory J (2019) Stressed out about hormones: how plants orchestrate immunity. Cell Host Microbe 26: 163–172 [DOI] [PMC free article] [PubMed] [Google Scholar]
- Cao H, Glazebrook J, Clarke JD, Volko S, Dong X (1997) The Arabidopsis NPR1 gene that controls systemic acquired resistance encodes a novel protein containing ankyrin repeats. Cell 88: 57–63 [DOI] [PubMed] [Google Scholar]
- Chae E, Tan QK, Hill TA, Irish VF (2008) An Arabidopsis F‐box protein acts as a transcriptional co‐factor to regulate floral development. Development 135: 1235–1245 [DOI] [PubMed] [Google Scholar]
- Chen S, Zhou Y, Chen Y, Gu J (2018) fastp: an ultra‐fast all‐in‐one FASTQ preprocessor. Bioinformatics 34: i884–i890 [DOI] [PMC free article] [PubMed] [Google Scholar]
- Cheng C, Gao X, Feng B, Sheen J, Shan L, He P (2013) Plant immune response to pathogens differs with changing temperatures. Nat Commun 4: 2530 [DOI] [PMC free article] [PubMed] [Google Scholar]
- Cheng YT, Zhang L, He SY (2019) Plant‐microbe interactions facing environmental challenge. Cell Host Microbe 26: 183–192 [DOI] [PMC free article] [PubMed] [Google Scholar]
- De Wolf ED, Isard SA (2007) Disease cycle approach to plant disease prediction. Annu Rev Phytopathol 45: 203–220 [DOI] [PubMed] [Google Scholar]
- Dempsey DA, Vlot AC, Wildermuth MC, Klessig DF (2011) Salicylic acid biosynthesis and metabolism. Arabidopsis Book 9: e0156 [DOI] [PMC free article] [PubMed] [Google Scholar]
- Ding P, Ding Y (2020) Stories of salicylic acid: a plant defense hormone. Trends Plant Sci 25: 549–565 [DOI] [PubMed] [Google Scholar]
- Ding Y, Sun T, Ao K, Peng Y, Zhang Y, Li X, Zhang Y (2018) Opposite roles of salicylic acid receptors NPR1 and NPR3/NPR4 in transcriptional regulation of plant immunity. Cell 173: 1454–1467 [DOI] [PubMed] [Google Scholar]
- Fan W, Dong X (2002) In vivo interaction between NPR1 and transcription factor TGA2 leads to salicylic acid‐mediated gene activation in Arabidopsis . Plant Cell 14: 1377–1389 [DOI] [PMC free article] [PubMed] [Google Scholar]
- Fanourakis D, Bouranis D, Giday H, Carvalho DR, Rezaei Nejad A, Ottosen CO (2016) Improving stomatal functioning at elevated growth air humidity: a review. J Plant Physiol 207: 51–60 [DOI] [PubMed] [Google Scholar]
- Felix G, Duran JD, Volko S, Boller T (1999) Plants have a sensitive perception system for the most conserved domain of bacterial flagellin. Plant J 18: 265–276 [DOI] [PubMed] [Google Scholar]
- Figueroa P, Gusmaroli G, Serino G, Habashi J, Ma L, Shen Y, Feng S, Bostick M, Callis J, Hellmann H et al (2005) Arabidopsis has two redundant Cullin3 proteins that are essential for embryo development and that interact with RBX1 and BTB proteins to form multisubunit E3 ubiquitin ligase complexes in vivo. Plant Cell 17: 1180–1195 [DOI] [PMC free article] [PubMed] [Google Scholar]
- Fu ZQ, Dong X (2013) Systemic acquired resistance: turning local infection into global defense. Annu Rev Plant Biol 64: 839–863 [DOI] [PubMed] [Google Scholar]
- Gendrel AV, Lippman Z, Martienssen R, Colot V (2005) Profiling histone modification patterns in plants using genomic tiling microarrays. Nat Methods 2: 213–218 [DOI] [PubMed] [Google Scholar]
- Geng F, Wenzel S, Tansey WP (2012) Ubiquitin and proteasomes in transcription. Annu Rev Biochem 81: 177–201 [DOI] [PMC free article] [PubMed] [Google Scholar]
- Gimenez‐Ibanez S, Ntoukakis V, Rathjen JP (2009) The LysM receptor kinase CERK1 mediates bacterial perception in Arabidopsis . Plant Signal Behav 4: 539–541 [DOI] [PMC free article] [PubMed] [Google Scholar]
- Goritschnig S, Zhang Y, Li X (2007) The ubiquitin pathway is required for innate immunity in Arabidopsis . Plant J 49: 540–551 [DOI] [PubMed] [Google Scholar]
- Guzman‐Plazola RA, Davis RM, Marois JJ (2003) Effects of relative humidity and high temperature on spore germination and development of tomato powdery mildew (Leveillula taurica). Crop Prot 22: 1157–1168 [Google Scholar]
- Howe GA, Major IT, Koo AJ (2018) Modularity in jasmonate signaling for multistress resilience. Annu Rev Plant Biol 69: 387–415 [DOI] [PubMed] [Google Scholar]
- Hu Y, Ding Y, Cai B, Qin X, Wu J, Yuan M, Wan S, Zhao Y, Xin XF (2022) Bacterial effectors manipulate plant abscisic acid signaling for creation of an aqueous apoplast. Cell Host Microbe 30: 518–529 [DOI] [PubMed] [Google Scholar]
- Huang W, Wang Y, Li X, Zhang Y (2020) Biosynthesis and regulation of salicylic acid and N‐hydroxypipecolic acid in plant immunity. Mol Plant 13: 31–41 [DOI] [PubMed] [Google Scholar]
- Huot B, Castroverde CDM, Velasquez AC, Hubbard E, Pulman JA, Yao J, Childs KL, Tsuda K, Montgomery BL, He SY (2017) Dual impact of elevated temperature on plant defence and bacterial virulence in Arabidopsis . Nat Commun 8: 1808 [DOI] [PMC free article] [PubMed] [Google Scholar]
- Jin H, Choi SM, Kang MJ, Yun SH, Kwon DJ, Noh YS, Noh B (2018) Salicylic acid‐induced transcriptional reprogramming by the HAC‐NPR1‐TGA histone acetyltransferase complex in Arabidopsis . Nucleic Acids Res 46: 11712–11725 [DOI] [PMC free article] [PubMed] [Google Scholar]
- Kim D, Langmead B, Salzberg SL (2015) HISAT: a fast spliced aligner with low memory requirements. Nat Methods 12: 357–360 [DOI] [PMC free article] [PubMed] [Google Scholar]
- Kim JH, Castroverde CDM, Huang S, Li C, Hilleary R, Seroka A, Sohrabi R, Medina‐Yerena D, Huot B, Wang J et al (2022) Increasing the resilience of plant immunity to a warming climate. Nature 607: 339–344 [DOI] [PMC free article] [PubMed] [Google Scholar]
- Kodadek T, Sikder D, Nalley K (2006) Keeping transcriptional activators under control. Cell 127: 261–264 [DOI] [PubMed] [Google Scholar]
- Komander D, Rape M (2012) The ubiquitin code. Annu Rev Biochem 81: 203–229 [DOI] [PubMed] [Google Scholar]
- Kumar S, Zavaliev R, Wu Q, Zhou Y, Cheng J, Dillard L, Powers J, Withers J, Zhao J, Guan Z et al (2022) Structural basis of NPR1 in activating plant immunity. Nature 605: 561–566 [DOI] [PMC free article] [PubMed] [Google Scholar]
- Lee DH, Goldberg AL (1998) Proteasome inhibitors: valuable new tools for cell biologists. Trends Cell Biol 8: 397–403 [DOI] [PubMed] [Google Scholar]
- Li B, Dewey CN (2011) RSEM: accurate transcript quantification from RNA‐Seq data with or without a reference genome. BMC Bioinformatics 12: 323 [DOI] [PMC free article] [PubMed] [Google Scholar]
- Lipford JR, Deshaies RJ (2003) Diverse roles for ubiquitin‐dependent proteolysis in transcriptional activation. Nat Cell Biol 5: 845–850 [DOI] [PubMed] [Google Scholar]
- Lipford JR, Smith GT, Chi Y, Deshaies RJ (2005) A putative stimulatory role for activator turnover in gene expression. Nature 438: 113–116 [DOI] [PubMed] [Google Scholar]
- Love MI, Huber W, Anders S (2014) Moderated estimation of fold change and dispersion for RNA‐seq data with DESeq2. Genome Biol 15: 550 [DOI] [PMC free article] [PubMed] [Google Scholar]
- Mark KG, Rape M (2021) Ubiquitin‐dependent regulation of transcription in development and disease. EMBO Rep 22: e51078 [DOI] [PMC free article] [PubMed] [Google Scholar]
- Mou Z, Fan W, Dong X (2003) Inducers of plant systemic acquired resistance regulate NPR1 function through redox changes. Cell 113: 935–944 [DOI] [PubMed] [Google Scholar]
- Muratani M, Kung C, Shokat KM, Tansey WP (2005) The F box protein Dsg1/Mdm30 is a transcriptional coactivator that stimulates Gal4 turnover and cotranscriptional mRNA processing. Cell 120: 887–899 [DOI] [PubMed] [Google Scholar]
- Mwimba M, Karapetyan S, Liu L, Marques J, McGinnis EM, Buchler NE, Dong X (2018) Daily humidity oscillation regulates the circadian clock to influence plant physiology. Nat Commun 9: 4290 [DOI] [PMC free article] [PubMed] [Google Scholar]
- Nakamura S, Mano S, Tanaka Y, Ohnishi M, Nakamori C, Araki M, Niwa T, Nishimura M, Kaminaka H, Nakagawa T et al (2010) Gateway binary vectors with the bialaphos resistance gene, bar, as a selection marker for plant transformation. Biosci Biotechnol Biochem 74: 1315–1319 [DOI] [PubMed] [Google Scholar]
- Ngou BPM, Ding P, Jones JDG (2022) Thirty years of resistance: Zig‐zag through the plant immune system. Plant Cell 34: 1447–1478 [DOI] [PMC free article] [PubMed] [Google Scholar]
- Panchal S, Chitrakar R, Thompson BK, Obulareddy N, Roy D, Hambright WS, Melotto M (2016) Regulation of stomatal defense by air relative humidity. Plant Physiol 172: 2021–2032 [DOI] [PMC free article] [PubMed] [Google Scholar]
- Peng Y, Yang J, Li X, Zhang Y (2021) Salicylic acid: biosynthesis and signaling. Annu Rev Plant Biol 72: 761–791 [DOI] [PubMed] [Google Scholar]
- Pertea M, Pertea GM, Antonescu CM, Chang TC, Mendell JT, Salzberg SL (2015) StringTie enables improved reconstruction of a transcriptome from RNA‐seq reads. Nat Biotechnol 33: 290–295 [DOI] [PMC free article] [PubMed] [Google Scholar]
- Reid G, Hubner MR, Metivier R, Brand H, Denger S, Manu D, Beaudouin J, Ellenberg J, Gannon F (2003) Cyclic, proteasome‐mediated turnover of unliganded and liganded ERalpha on responsive promoters is an integral feature of estrogen signaling. Mol Cell 11: 695–707 [DOI] [PubMed] [Google Scholar]
- Romero F, Cazzato S, Walder F, Vogelgsang S, Bender SF, van der Heijden MGA (2022) Humidity and high temperature are important for predicting fungal disease outbreaks worldwide. New Phytol 234: 1553–1556 [DOI] [PubMed] [Google Scholar]
- Roussin‐Leveillee C, Lajeunesse G, St‐Amand M, Veerapen VP, Silva‐Martins G, Nomura K, Brassard S, Bolaji A, He SY, Moffett P (2022) Evolutionarily conserved bacterial effectors hijack abscisic acid signaling to induce an aqueous environment in the apoplast. Cell Host Microbe 30: 489–501 [DOI] [PMC free article] [PubMed] [Google Scholar]
- Saleh A, Withers J, Mohan R, Marques J, Gu Y, Yan S, Zavaliev R, Nomoto M, Tada Y, Dong X (2015) Posttranslational modifications of the master transcriptional regulator NPR1 enable dynamic but tight control of plant immune responses. Cell Host Microbe 18: 169–182 [DOI] [PMC free article] [PubMed] [Google Scholar]
- Schwartz HF (2011) Bacterial diseases of beans. Colorado State University Extension Fact Sheet No 2.913
- Shen M, Lim CJ, Park J, Kim JE, Baek D, Nam J, Lee SY, Pardo JM, Kim WY, Mackey D et al (2020) HOS15 is a transcriptional corepressor of NPR1‐mediated gene activation of plant immunity. Proc Natl Acad Sci USA 117: 30805–30815 [DOI] [PMC free article] [PubMed] [Google Scholar]
- Skelly MJ, Furniss JJ, Grey H, Wong KW, Spoel SH (2019) Dynamic ubiquitination determines transcriptional activity of the plant immune coactivator NPR1. Elife 8: e47005 [DOI] [PMC free article] [PubMed] [Google Scholar]
- Spoel SH, Mou Z, Tada Y, Spivey NW, Genschik P, Dong X (2009) Proteasome‐mediated turnover of the transcription coactivator NPR1 plays dual roles in regulating plant immunity. Cell 137: 860–872 [DOI] [PMC free article] [PubMed] [Google Scholar]
- Stevens RB (1960) Plant pathology, an advanced treatise. 3. New York, NY: Academic Press; [Google Scholar]
- Tada Y, Spoel SH, Pajerowska‐Mukhtar K, Mou Z, Song J, Wang C, Zuo J, Dong X (2008) Plant immunity requires conformational changes [corrected] of NPR1 via S‐nitrosylation and thioredoxins. Science 321: 952–956 [DOI] [PMC free article] [PubMed] [Google Scholar]
- Vierstra RD (2009) The ubiquitin‐26S proteasome system at the nexus of plant biology. Nat Rev Mol Cell Biol 10: 385–397 [DOI] [PubMed] [Google Scholar]
- Wang C, Cai X, Zheng Z (2005) High humidity represses Cf‐4/Avr4‐ and Cf‐9/Avr9‐dependent hypersensitive cell death and defense gene expression. Planta 222: 947–956 [DOI] [PubMed] [Google Scholar]
- Wang W, Feng B, Zhou J, Tang D (2020) Plant immune signaling: advancing on two frontiers. J Integr Plant Biol 62: 2–24 [DOI] [PubMed] [Google Scholar]
- Wang L, Tsuda K, Truman W, Sato M, Nguyen le V, Katagiri F, Glazebrook J (2011) CBP60g and SARD1 play partially redundant critical roles in salicylic acid signaling. Plant J 67: 1029–1041 [DOI] [PubMed] [Google Scholar]
- Wang J, Grubb LE, Wang J, Liang X, Li L, Gao C, Ma M, Feng F, Li M, Li L et al (2018) A regulatory module controlling homeostasis of a plant immune kinase. Mol Cell 69: 493–504 [DOI] [PubMed] [Google Scholar]
- Wildermuth MC, Dewdney J, Wu G, Ausubel FM (2001) Isochorismate synthase is required to synthesize salicylic acid for plant defence. Nature 414: 562–565 [DOI] [PubMed] [Google Scholar]
- Wu Y, Zhang D, Chu JY, Boyle P, Wang Y, Brindle ID, De Luca V, Despres C (2012) The Arabidopsis NPR1 protein is a receptor for the plant defense hormone salicylic acid. Cell Rep 1: 639–647 [DOI] [PubMed] [Google Scholar]
- Wu J, Zhu W, Zhao Q (2022) Salicylic acid biosynthesis is not from phenylalanine in Arabidopsis . J Integr Plant Biol 65: 881–887 [DOI] [PubMed] [Google Scholar]
- Xin XF, Nomura K, Aung K, Velasquez AC, Yao J, Boutrot F, Chang JH, Zipfel C, He SY (2016) Bacteria establish an aqueous living space in plants crucial for virulence. Nature 539: 524–529 [DOI] [PMC free article] [PubMed] [Google Scholar]
- Yan S, Dong X (2014) Perception of the plant immune signal salicylic acid. Curr Opin Plant Biol 20: 64–68 [DOI] [PMC free article] [PubMed] [Google Scholar]
- Yang B‐J, Han X‐X, Yin L‐L, Xing M‐Q, Xu Z‐H, Xue H‐W (2016) Arabidopsis PROTEASOME REGULATOR1 is required for auxin‐mediated suppression of proteasome activity and regulates auxin signalling. Nat Commun 7: 11388 [DOI] [PMC free article] [PubMed] [Google Scholar]
- Yasuda S, Tsuchiya H, Kaiho A, Guo Q, Ikeuchi K, Endo A, Arai N, Ohtake F, Murata S, Inada T et al (2020) Stress‐ and ubiquitylation‐dependent phase separation of the proteasome. Nature 578: 296–300 [DOI] [PubMed] [Google Scholar]
- Yu X, Feng B, He P, Shan L (2017) From chaos to harmony: responses and signaling upon microbial pattern recognition. Annu Rev Phytopathol 55: 109–137 [DOI] [PMC free article] [PubMed] [Google Scholar]
- Yu G, Derkacheva M, Rufian JS, Brillada C, Kowarschik K, Jiang S, Derbyshire P, Ma M, DeFalco TA, Morcillo RJL et al (2022) The Arabidopsis E3 ubiquitin ligase PUB4 regulates BIK1 and is targeted by a bacterial type‐III effector. EMBO J 41: e107257 [DOI] [PMC free article] [PubMed] [Google Scholar]
- Yuan M, Jiang Z, Bi G, Nomura K, Liu M, Wang Y, Cai B, Zhou JM, He SY, Xin XF (2021) Pattern‐recognition receptors are required for NLR‐mediated plant immunity. Nature 592: 105–109 [DOI] [PMC free article] [PubMed] [Google Scholar]
- Zavaliev R, Mohan R, Chen T, Dong X (2020) Formation of NPR1 condensates promotes cell survival during the plant immune response. Cell 182: 1093–1108 [DOI] [PMC free article] [PubMed] [Google Scholar]
- Zhai Q, Yan L, Tan D, Chen R, Sun J, Gao L, Dong MQ, Wang Y, Li C (2013) Phosphorylation‐coupled proteolysis of the transcription factor MYC2 is important for jasmonate‐signaled plant immunity. PLoS Genet 9: e1003422 [DOI] [PMC free article] [PubMed] [Google Scholar]
- Zhang Y, Li X (2019) Salicylic acid: biosynthesis, perception, and contributions to plant immunity. Curr Opin Plant Biol 50: 29–36 [DOI] [PubMed] [Google Scholar]
- Zhang Y, Xu S, Ding P, Wang D, Cheng YT, He J, Gao M, Xu F, Li Y, Zhu Z et al (2010) Control of salicylic acid synthesis and systemic acquired resistance by two members of a plant‐specific family of transcription factors. Proc Natl Acad Sci USA 107: 18220–18225 [DOI] [PMC free article] [PubMed] [Google Scholar]
- Zhou JM, Zhang Y (2020) Plant immunity: danger perception and signaling. Cell 181: 978–989 [DOI] [PubMed] [Google Scholar]
- Zhu Y, Qian W, Hua J (2010) Temperature modulates plant defense responses through NB‐LRR proteins. PLoS Pathog 6: e1000844 [DOI] [PMC free article] [PubMed] [Google Scholar]