

Abstract
We demonstrated the effects of substituents in fluorescein on the photoredox catalytic performance under visible light. For the systematic investigation, the phenyl ring of fluorescein was substituted with six different functional groups (i.e., amine, amide, isothiocyanate, aminomethyl, bromo, or nitro group) at the 5- or 6-position. The fluorescein derivatives were carefully characterized through photophysical and electrochemical analyses. The substituent effects were estimated by comparing the photopolymerization of poly(ethylene glycol) diacrylate (PEGDA) and N-vinylpyrrolidone (VP) in the presence of triethanolamine (TEOA) under aerobic conditions to that of intact fluorescein. As a result, the amine and nitro groups exhibited the lowest performances, presumably due to intramolecular photoinduced electron transfer (PET) promoted by the strong electron push–pull effect. The others, representative moderate or weak deactivators and activators, exhibited inferior performances than intact fluorescein, presumably owing to the more negative ΔGPET values, resulting in a decreased rate of intermolecular PET. These results are crucial for understanding the structure–performance relationship and the development of visible-light photoredox catalysts with improved performance and functionality.
1. Introduction
Understanding substituent effects is important because a substituent variation can change the reactivity, rate, and direction of a chemical reaction as well as physicochemical properties of a molecule.1 Especially, the substituent effects are pivotal in controlling the photophysical and electrochemical properties of organic molecules, comprising delocalized π-electron systems.2,3 These π-conjugated organic molecules have been widely investigated and applied in many areas due to their unique optical and electrical characteristics, easily tunable structures, and predictable properties.4,5 For example, they have been used as active components (e.g., transistors and diodes) in organic optoelectronics, such as photovoltaic solar cells, light-emitting diodes (LEDs), and flexible field-effect transistors.6−9 The performances of these devices are significantly affected by the energy level difference between the electron donor and electron acceptor.10−12 Therefore, fine-tuning the energy levels of the components is essential. The energy levels of these organic molecules can be readily tuned by incorporating a suitable substituent at specific positions using synthetic methodologies.13−15
As π-extended small molecules, fluorescein dyes typically contain a benzoate and a xanthene core ring with a hydroxyl group(s). These dyes are characterized by many attractive characteristics, such as excellent molar absorptivity and fluorescence in the visible-light region (400–700 nm) under alkaline conditions, good biocompatibility, high water solubility, and switchable molecular structures.16−18 Thus, fluorescein dyes have been commonly utilized in various research areas, including optical imaging, optoelectronics, solar energy conversion, biomedical engineering, and chemobiosensors.19−24 Additionally, fluorescein dyes have recently become the focus of substantial research attention as organic photoredox catalysts because they can convert visible light into chemical potential energy, promoting chemical reactions under mild reaction conditions (e.g., an aerobic atmosphere and at room temperature).25−29 For instance, under visible-light irradiation, 2′,4′,5′,7′-tetrabromofluorescein, acting as a photoredox catalyst, initiates radical polymerization on the surfaces of single mammalian cells.30−32 The polymeric film-coated cells exhibited high viabilities and metabolic activities. Notably, this photoinitiated polymerization has also been used to amplify the signal of (biological) analytes, ultimately generating a signal visible to the naked eye.33−36 Thus, the development of fluorescein dyes requires enhanced photoredox catalytic properties that are compatible with multiple functions. This goal can be achieved by determining how different substituents affect the catalytic performance of the chemically modified fluorescein dyes.
While there have been few studies investigating the influence of substituents on the photoredox catalytic performance of fluorescein dyes, the majority of them have primarily focused on halogen groups.37,38 One main reason is that introducing heavy halogen atoms (Br or I) considerably enhanced the catalytic performance, presumably because of the heavy-atom effect that increased the quantum yield of intersystem crossing (ISC).39 In our previous study, the catalytic performance of fluorescein was significantly influenced by the position of the halogen atoms. Specifically, we found that the introduction of the halogen substituents on the xanthene core ring (i.e., 2′,4′,5′,7′-tetrabromo or 2′,4′,5′,7′-tetraiodofluorescein) led to an increase in photoredox catalytic performance compared to intact fluorescein. However, when the halogen substituents were introduced on the phenyl ring (i.e., 4,5,6,7-tetrabromo or 4,5,6,7-tetraiodofluorescein), the catalytic performance decreased.39,40 In this context, we are interested in investigating the impact of different substituents on fluorescein and their effects on the photoredox catalytic performances.
Herein, we introduce six different functional groups, classified as electron-donating or electron-withdrawing groups, on fluorescein to elucidate the effects of substituents on the photoredox catalytic performance of the resultant fluorescein dyes. In particular, we focus on the phenyl ring of fluorescein, because it is more useful and accessible than the xanthene core ring. For instance, the xanthene core ring has a limited variation of substituents. In fact, 2′,4′,5′,7′-tetrabromo or 2′,4′,5′,7′-tetraiodofluorescein exhibited higher catalytic performances than intact fluorescein; therefore, replacing the heavy atoms in the xanthene core ring with other substituents can deteriorate the catalytic performance.39 Moreover, substitution of the hydroxyl group on the xanthene core ring decreased the catalytic performance, presumably due to the restriction of tautomerization.34 Regarding synthetic aspects of the transformations, incorporating a linker or a ligand into the xanthene core ring of fluorescein is more synthetically cumbersome than incorporating it into the phenyl ring of fluorescein. To evaluate the catalytic performance, we perform surface-initiated polymerization to realize applications of interfacial polymerization such as cell encapsulation and chip-based technologies.
2. Experimental Section
2.1. Synthesis of tert-Butyl (3′,6′-Dihydroxy-3-oxo-3H-spiro[isobenzofuran-1,9′-xanthen]-5-yl)carbamate (3)
Compound (3) was synthesized following a procedure described in the literature.41 Di-tert-butyl dicarbonate (1.27 g, 5.8 mmol) was added to a solution of 5-aminofluorescein (2) (200 mg, 575.8 μmol) and dissolved in 10 mL of methanol at room temperature. The reaction mixture was then stirred under a nitrogen atmosphere at room temperature for 30 h. After the solvent was removed under reduced pressure, the product was purified by a silica column chromatograph (hexane/ethyl acetate = 1:1) to obtain an orange solid (243 mg, 94%). 1H NMR (500 MHz, DMSO-d6): δ 10.13 (s, 2H), 9.89 (s, 1H), 8.12(d, 1H, J = 1.5 Hz), 7.77 (dd, 1H, J = 8.5 and 2 Hz), 7.72 (d, 1H, J = 8.5 Hz), 6.68 (d, 2H, J = 2 Hz), 6.60 (d, 2H, J = 9.0 Hz), 6.56 (dd, 2H, J = 8.5 and 2 Hz), 1.5 (s, 9H); 13C NMR (125 MHz, DMSO-d6): δ 169.18, 159.94, 153.31, 152.40, 146.14, 141.73, 129.56, 127.56, 125.93, 124.81, 113.03, 112.64, 110.32, 102.66, 80.32, 65.39, 28.53; MS (HRMS-FAB): m/z = 448.13 [M + H]+ (cal. 447.13 [M]+).
2.2. Synthesis of 3′,6′-Dihydroxy-5(6)-methyl-3H-spiro[isobenzofuran-1,9′-xanthen]-3-one (8)
Compound (8) was synthesized following a procedure described in the literature.42 Methanesulfonic acid (3.2 mL) was gradually added to a mixture of resorcinol (1.5 g, 13.3 mmol) and 4-methylphthalic anhydride (1.0 g, 6.2 mmol) that had been ground and mixed at room temperature. The reaction mixture was stirred and then heated slowly to 100 °C under a nitrogen atmosphere for 18 h. After the solution was cooled to room temperature, it was poured into 50 mL of deionized water, forming a precipitate. The precipitate was filtered and recrystallized in a mixture of water and acetone at 4 °C. The product was filtered and dried under reduced pressure, yielding a brown powder (1.85 g, 86%). 1H NMR (500 MHz, DMSO-d6): δ 10.10 (s, 3.4H), 7.87 (d, 1H, J = 7.8 Hz), 7.79 (s, 0.9H, J = 0.8 Hz), 7.62 (d, 0.8H, J = 7.8 Hz), 7.52 (d, 1H, J = 7.8 Hz), 7.16 (d, 0.8H, J = 7.8 Hz), 7.07 (s, 1H), 6.67 (t, 3.4H, J = 1.3 Hz), 6.56 (dd, 7.2H, J = 7.4 and 1.3 Hz), 2.49 (s, 2.4H), 2.38 (s, 3H); 13C NMR (125 MHz, DMSO-d6): δ 169.24, 169.17, 159.90, 153.73, 152.34, 152.23, 150.41, 147.04, 140.49, 137.02, 131.54, 129.53, 129.49, 126.92, 124.81, 124.44, 124.19, 124.07, 113.09, 113.04, 110.25, 110.18, 102.67, 83.04, 21.85, 21.18; MS (HRMS-FAB): m/z = 247.09 [M + H]+ (cal. 246.08 [M]+).
2.3. Synthesis of 5(6)-Methyl-3-oxo-3H-spiro[isobenzofuran-1,9′-xanthene]-3′,6′-diyl Diacetate (9)
Compound (9) was synthesized following a procedure described in the literature.42 5(6)-Methylfluorescein (8, 300 mg, 870 μmol) was added to 3 mL of acetic anhydride at room temperature under a nitrogen atmosphere. The reaction mixture was stirred and heated to 140 °C for 12 h. Upon cooling to room temperature, the solution was poured into 30 mL of ice water, forming a precipitate that was filtered and washed with deionized water. The precipitate was then further purified through recrystallization with ethanol, giving a white powder (203 mg, 54%). 1H NMR (500 MHz, CDCl3): δ 7.91 (d, 1H, J = 7.9 Hz), 7.81 (s, 1H), 7.50 (dd, 1H, J = 7.9 and 0.9 Hz), 7.42 (dd, 1H, J = 7.7 and 0.6 Hz), 7.08 (d, 4H, J = 2.2 Hz), 7.08 (d, 1H, J = 7.9 Hz), 6.95 (s, 1H), 6.83 (m, 8H), 2.52 (s, 3H), 2.41 (s, 3H), 2.31 (s, 6H); 13C NMR (125 MHz, DMSO-d6): δ 169.24, 168.88, 168.83, 153.67, 151.99, 151.96, 151.61, 151.46, 150.29, 146.78, 140.53, 136.41, 131.21, 129.02, 128.99, 126.45, 125.12, 124.96, 124.29, 123.76, 123.41, 117.71, 117.67, 116.70, 116.68, 110.33, 110.31, 81.53, 81.15, 22.07, 21.33, 21.12; MS (HRMS-FAB): m/z = 431.11 [M + H]+ (cal. 430.11 [M]+).
2.4. Synthesis of 5(6)-(Bromomethyl)-3-oxo-3H-spiro[isobenzofuran-1,9′-xanthene]-3′,6′-diyl Diacetate (10)
Compound (10) was synthesized following a procedure described in the literature.42 The solution of N-bromosuccinimide (82.8 mg, 464 μmol) and azobis(isobutyronitrile) (11.4 mg, 69.6 μmol) dissolved in 1 mL of anhydrous acetonitrile was slowly added to a solution of 5(6)-methylfluorescein diacetate (9, 50 mg, 116 μmol) dissolved in 2 mL of anhydrous acetonitrile under a nitrogen atmosphere at room temperature. The reaction mixture was stirred and heated to 80 °C for 24 h. The solvent was then removed under reduced pressure, and the crude product was extracted with methylene chloride by using a separatory funnel. The product was further purified through silica column chromatography (hexane: ethyl acetate = 3:1) to obtain a pale-yellow powder (32 mg, 67%). 1H NMR (500 MHz, CDCl3): δ 8.04 (d, 0.26H, J = 0.9 Hz), 8.01 (d, 1H, J = 7.9 Hz), 7.72 (dd, 0.26H, J = 8.0 and 1.7 Hz), 7.68 (dd, 1H, J = 7.9 and 1.3 Hz), 7.17 (s, 1H), 7.17 (d, 0.25H), 7.10 (t, 2H, J = 1.4 Hz), 7.10 (t, 0.5H, J = 0.9 Hz), 6.84 (d, 4H, J = 1.3 Hz), 6.83 (d, 0.5H, J = 0.8 Hz), 4.60 (s, 0.5H), 4.45 (s, 2H), 2.32 (s, 6H); 13C NMR (125 MHz, DMSO-d6): δ 168.78, 168.36, 153.55, 152.79, 152.18, 151.55, 145.73, 140.42, 136.12, 131.21, 128.91, 125.99, 125.70, 125.39, 124.58, 124.22, 117.87, 116.15, 110.47, 81.54, 31.28, 21.10; MS (HRMS-FAB): m/z = 509.02 [M + H]+ (cal. 508.02 [M]+).
2.5. Synthesis of 5(6)-(Aminomethyl)-2-(6-hydroxy-3-oxo-3H-xanthen-9-yl)benzoate (5)
Compound (5) was synthesized following a procedure described in the literature.42 30% ammonium hydroxide (2.5 mL) was added to a solution of 5(6)-bromomethyl fluorescein (10, 25 mg, 49 μmol) dissolved in 1 mL of anhydrous acetonitrile under a nitrogen atmosphere at room temperature.
The reaction mixture was stirred and heated to 35 °C for 2 h. The solvent was then removed under reduced pressure, and cold water was added to the mixture. The precipitate was obtained through centrifugation and dried by using a freeze-dryer to yield an orange powder (10.4 mg, 59%). According to the 1H NMR analysis, this compound had contained approximately 10% of 5-isomer, and its carbon signals were too weak to distinguish in the 13C NMR spectrum. 1H NMR (500 MHz, DMSO-d6): δ 7.92 (d, 1H, J = 8.1 Hz), 7.66 (dd, 1H, J = 7.9 Hz), 7.21 (s, 1H), 6.68 (s, 2H), 6.56 (s, 4H), 3.81 (s, 2H); 13C NMR (125 MHz, DMSO-d6): δ 169.20, 162.36, 160.22, 153.59, 152.22, 129.57, 129.52, 124.81, 124.70, 122.29, 113.16, 110.16, 102.67, 84.41, 45.47; MS (HRMS-FAB): m/z = 362.10 [M + H]+ (cal. 361.10 [M]+).
2.6. Synthesis of 5(6)-Bromofluorescein (6)
Compound (6) was synthesized following a procedure described in the literature.43 Resorcinol (203.7 mg, 1.850 mmol) was added to a mixture of 4-bromophthalic anhydride (200 mg, 881.0 μmol) dissolved in methanesulfonic acid (1 mL) at room temperature. The mixture was stirred and heated to 100 °C for 18 h. The resulting solution was cooled to room temperature and added to water (50 mL). The brown precipitate was purified by recrystallization with water and acetone at 10 °C for overnight. The precipitate was collected through centrifugation and then dried under reduced pressure to yield a brown powder (193.9 mg, 53%). 1H NMR (500 MHz, DMSO-d6): δ 10.4 (s, 2H), 8.17 (dd, 1H, J = 1.8 and 0.4 Hz), 7.95 (dd, 1H, J = 8.3 and 1.8 Hz), 7.93 (dd, 1H, J = 8.3 and 0.8 Hz), 7.90 (dd, 1H, J = 8.2 and 0.6 Hz), 7.59 (dd, 1H, J = 1.5 and 0.7 Hz), 7.25 (dd, 1H, J = 8.2 and 0.5 Hz), 6.68 (d, 4H, J = 2.5 Hz), 6.64 (d, 2H, J = 5.5 Hz), 6.62 (d, 2H, J = 5.5 Hz), 6.57 (dd, 2H, J = 6.8 and 2.3 Hz), 6.55 (dd, 2H, J = 6.9 and 2.4 Hz); 13C NMR (125 MHz, DMSO-d6): δ 167.79, 167.14, 159.60, 154.36, 151.81, 151.29, 138.29, 133.47, 129.61, 129.16, 128.55, 127.27, 127.05, 126.56, 126.20, 125.42, 123.10, 112.68, 108.92, 102.25, 82.81; MS (HRMS-FAB): m/z = 410.98 [M + H]+ (cal. 409.97 [M]+).
2.7. Preparation of the Chip
The agarose film-coated glass surface was prepared following a procedure described in the literature.44 Agarose powder was dissolved in hot water (100 °C) for 2 min to make a 0.2 wt % solution. The agarose solution (2 mL) was carefully dropped onto a precleaned glass slide (size: 2.5 cm × 7.5 cm), treated with an oxygen-plasma cleaner (Harrick, PDC-32G), and the solution spread evenly over the entire surface. As the water evaporated, the agarose film slowly formed on the glass surface through the gel phase. To complete the preparation, the agarose film was covered with a black adhesive PVC film (CSH-3800, Samhyeob Tape Co., LTD, South Korea) containing holes made with a hole puncher (Peace Korea, Co., LTD). Each chip consists of nine holes with a diameter of approximately 0.6 cm.
2.8. Monomer Conversion Analysis Using 1H NMR
An aqueous solution (total volume: 250 μL), containing each dye (50 μM), TEOA (125 mM), and OEGMA (0.5 M) was exposed to a green LED (40 W, 500 ± 30 nm) for varied exposure times (1, 3, 5, 7, and 9 min). For the NMR analysis, an aliquot (25 μL) of the resulting solution was added to 1 mL of D2O solution.30 In the spectrum, we carefully analyzed the integrals of the peaks’ integral. For example, the integral of δ = 3.3 ppm (c in Figure S27) corresponds to the combined ω-O-methyl signal of the both reacted and unreacted OEGMA and serves as an internal reference. The integral of δ = 5.65 or 6.1 ppm (a or b in Figure S27) corresponds to unreacted, remaining acryl proton. The integrals of peak b at different time points were compared with the integral of the same peak at time zero. Thus, the monomer conversion (%) is determined by the following equation: monomer conversion (%) = [1–([Ia]t/[Ia]0)] × 100%, where [Ia]0 is the integral of the peak (a) at time zero, and [Ia]t is the integral of the same peak (a) at time point t.
3. Results and Discussion
3.1. Plausible Mechanism
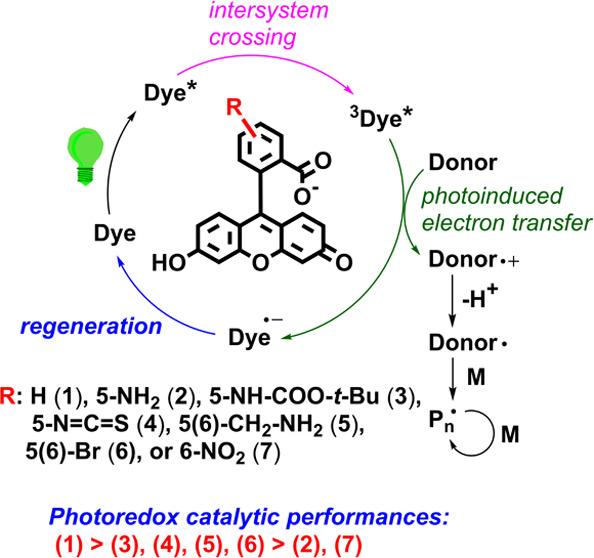
Scheme 1 shows the structures of the substituted fluorescein dyes and a plausible mechanism for fluorescein-based photoredox catalysis occurring in the presence of triethanolamine (TEOA) under aerobic conditions. The intact fluorescein (1) was used as a reference dye, and the others were substituted at the 5- or 6-position by a representative electron-donating (amine (2), amide (3), or aminomethyl (5)) or electron-withdrawing group (isothiocyanate (4), bromo (6), or nitro (7)). The dye generates open-shell species in the presence of an electron donor (e.g., TEOA) through a reductive quenching cycle.45,46 Briefly, visible light excites an electron of the dye to the singlet excited state; an ISC then occurs, whereby the electron transits to the lowest triplet excited state (3Dye*). 3Dye* can react with either molecular oxygen or TEOA and thus returns its ground state through energy transfer or produces open-shell species such as a dye radical anion and an amine radical cation via single-electron transfer (intermolecular PET), respectively. The dye can be regenerated by a single-electron transfer between the dye radical anion and molecular oxygen (regeneration). The α-amino radical, formed by proton abstraction of the amine radical cation, initiates radical reactions.
Scheme 1. Structures of Substituted Fluorescein Dyes (1)–(7) and a Plausible Mechanism of the Relevant Photoredox Catalytic/Initiating Reactions in the Presence of Triethanolamine under Visible Light.

3.2. Syntheses and Characterizations of Fluorescein Dyes
Compound (3) was simply synthesized by reacting aminofluorescein (2) with di-tert-butyl dicarbonate in methanol at room temperature. Compound (5) was synthesized through four synthetic steps (Scheme 2). In brief, 5(6)-methyl substituted fluorescein (8) is initially obtained by reacting resorcinol with 4-methylphthalic anhydride in the presence of methanesulfonic acid at 100 °C in an 86% yield (detailed in the Supporting Information). After the acetylation of (8), the bromination of (9) with N-bromosuccinimide produces (10) in 67% yield. Treatment of the excess amount of ammonia gives (5), resulting in a 59% yield. Compound (6) is obtained simply by the Friedel–Crafts reaction of resorcinol with 4-bromophthalic anhydride under acidic conditions.
Scheme 2. Synthetic Procedure for 5(6)-(Aminomethyl)fluorescein (5): (i) Methanesulfonic Acid (xs), 100 °C, 12 h; (ii) Acetic Anhydride, 140 °C, 12 h; (iii) N-Bromosuccinimide (4 equiv), Azobisisobutyronitrile (0.6 equiv), CH3CN; and (iv) NH4OH (xs), CH3CN, 35 °C, 2 h.

The dyes synthesized as described were characterized through nuclear magnetic resonance spectroscopy, mass spectrometry, ultraviolet–visible (UV–Vis) spectrophotometry, voltammetry, and fluorometry (Figures S1–S20). The gathered evidence indicated that the photophysical and electrochemical properties of the dyes were affected by the identity of the substituents on the phenyl ring of fluorescein. For example, the dyes exhibit slightly different values for the molar absorptivity and maximum absorption wavelength (λmax) under 1 mM ethanolic sodium hydroxide (Table 1). Dyes (2) and (7) exhibit almost no fluorescence, whereas the other dyes are characterized by high fluorescence quantum yields (Φf) (Figure S1b). Notably, the amino and nitro groups are known to be strongly electron-donating and electron-withdrawing, respectively. Their presence promotes intramolecular PET through the electron push–pull effect, significantly reducing fluorescence intensity.47,48 The substituted fluorescein dyes (2)–(7) have reduction potentials lower than those of intact fluorescein (1).
Table 1. Summary of Photophysical and Electrochemical Properties of Dyes (1)–(7)e.
| dye | (1) | (2) | (3) | (4) | (5) | (6) | (7) |
|---|---|---|---|---|---|---|---|
| λex (nm)a | 500 | 496 | 500 | 501 | 504 | 504 | 510 |
| ε(cm–1·M–1)a | 93660 | 83200 | 71100 | 85800 | 58600 | 78900 | 107900 |
| λem (nm)a | 525 | 519 | 524 | 527 | 529 | 530 | 544 |
| Φfa,b | 0.95 | 0.04 | 0.72 | 0.87 | 0.77 | >0.95 | <0.01 |
| E1/2redb (V/SCE) | –1.20 (−1.17) | –1.06 | –0.91 | –0.90 | –0.98 | –0.80 | –0.70 |
| E0,0T1 (eV)c | 2.05 | 2.07 | 2.04 | 2.03 | 2.03 | 2.03 | 1.97 |
| ΔGPET (eV)d | –0.13 | –0.29 | –0.43 | –0.42 | –0.33 | –0.51 | –0.55 |
Data were measured in ethanol containing 1 mM NaOH.49
Data were measured in an aqueous ethanolic solution (water/ethanol = 90:10, v/v) containing 10 μM NaOH.
The literature value of (1) was −1.17 V/SCE.27
Calculated values based on the literature.50
ΔGPET = −[E*red(dye*/dye·-)–Eox(TEOA·+/TEOA)], E*red(dye*/dye·) = Ered(dye/dye·-) + E0,0T1, and Eox(TEOA ·+/ TEOA) = 0.72 eV.51
3.3. Characterization of Spotted Dyes
The photoredox catalytic performances of dyes (1)–(7) were evaluated through interfacial photopolymerization in the presence of TEOA under irradiation from a visible LED (wavelength: 520 ± 30 nm, 10.3 W/cm2). For the photopolymerization, each dye was dissolved in a mixed solvent (water:ethanol = 90:10, v/v) to form solutions of different concentrations; a 5 μL aliquot of each prepared solution was then spotted on an agarose film-based chip using a micropipette. The agarose film, serving as a scaffold holding the dye, was prepared by drop-casting a hot aqueous solution of agarose (0.2 wt %) onto a glass surface treated by plasma cleaning with oxygen.44 After thoroughly drying the substrate by exposing it to atmospheric air at room temperature overnight, the resulting agarose film was fabricated using a black, sticky film with a nine-hole pattern.
The prepared chips were characterized by using a fluorescence scanner before and after spotting of each dye. No photoactive contaminants are present on the bare chip, as indicated by the measured fluorescence intensity being similar to the background intensity (1600 ± 600 au) (Figure S21). The fluorescence intensities observed for the dye spotted depended on the identity of the substituent and the concentration of the dye. Typically, the fluorescence intensity was proportional to the dye concentration. The fluorescence intensities of chips spotted with 0.5 μM dye solutions were approximately 1.3–2 times higher than those of chips spotted with 0.2 μM dye solutions (Figure S21). For example, the fluorescence intensities of (1)-spotted chips were 36951 ± 4884 and 57213 ± 4223 au at 0.2 and 0.5 μM concentrations, respectively. Moreover, the fluorescence intensities of various spotted dyes differed at the same concentrations and depended on the values of the relevant fluorescence quantum yields (Table 1). For example, fluorescence intensities of (3)- and (4)-spotted chips at 0.5 μM concentration were 31987 ± 3988 and 50784 ± 2899 au, respectively (Figure S21). Thus, these results align with the trend of fluorescence intensities in the ethanolic solution and confirm the successful spotting of the dyes on the chips.
3.4. Interfacial Photopolymerization
The dye-spotted chips were dropped in aqueous solutions (20 μL) containing 0.75 M TEOA, 0.4 M N-vinylpyrrolidone (VP), and 0.6 M poly(ethylene glycol) diacrylate (PEGDA). Under aerobic conditions, irradiation of the resulting mixtures with the visible LED initiated free-radical polymerization on the chip. After 1 min of exposure to the visible LED, a polymeric hydrogel was formed on the chip and was selectively stained by implementing a simple staining process for visualization (see the Supporting Information for details). As the pores present in the hydrogel were smaller in size than those present in the agarose film, the staining molecules diffused out of the hydrogel more slowly than out of the agarose film. We captured the images of the stained hydrogels with a photoscanner and subsequently estimated the relative degree of hydrogelation based on the differences in colorimetric intensity. In practice, the colorimetric intensity was proportional to the number of staining molecules present in the hydrogel and was calculated using the ImageJ software (National Institutes of Health, Bethesda, MD).52
Figure 1 represents data reflecting the effectiveness of the interfacial photopolymerization initiated by each dye at different concentrations. Each chip comprises two dye-spots and one blank spot used as a negative control without employing the dye to verify the results. Polymerization efficiency was affected by both the concentration of spotted dyes and the identity of the substituent on the phenyl ring. Typically, the colorimetric intensity of the formed hydrogels increased with an increasing concentration of the spotted dyes. For instance, the (2)-spotted chip at 0.5 μM and 1.0 μM could not form a hydrogel, whereas it manifestly formed a hydrogel at 5 μM concentration (Figure S22). In addition to the concentration, the substituent type influenced the recorded colorimetric intensity. In particular, dyes (2) and (7) could not form hydrogels at concentrations below 0.5 μM, where the measured colorimetric intensities for (2)- and (7)-spotted chips were the same as the background intensity (3500 ± 250 au) (Figure 1b). These poor performances can be attributed to intramolecular PET between the xanthene core ring and the amine- or nitro-substituted phenyl ring. We assume that the intramolecular PET has suppressed the intermolecular PET between TEOA and the 3Dye*.
Figure 1.

Representative images of the colorimetric readouts obtained for (1)–(7)-spotted chips spotted at (a) 0.2 and (b) 0.5 μM concentrations. Notably, each chip comprises two spots (the first two from the left) containing the dye and one blank spot (the third) used as negative control. (c) Summary of the quantitative characterization of the colorimetric readouts: data reported as mean ± standard deviation values (number of chips, n ≥ 3). The scale bars are 0.6 cm.
Electron paramagnetic resonance (EPR) was employed to support this assumption. It is known that this intermolecular PET generated radical species (e.g., α-amino radical) concerned in the photopolymerization as depicted in Scheme 1.53 To identify the produced radicals during the photoreaction, 5,5-dimethyl-1-pyrroline N-oxide (DMPO) was used as a spin trap for the EPR investigation. Figure 2 presents the solution EPR spectra obtained from the mixture of ethanolic solutions of each dye + TEOA + DMPO after 90 s under visible LED irradiation. All of the solutions except for the control mixture solution of TEOA + DMPO showed EPR signals indicating that the dyes were responsible for the generation of radicals. The dyes could be classified into three groups, based on the observed EPR features. Group I was (1) and (3)–(6); group II was (2); and group III was (7).
Figure 2.
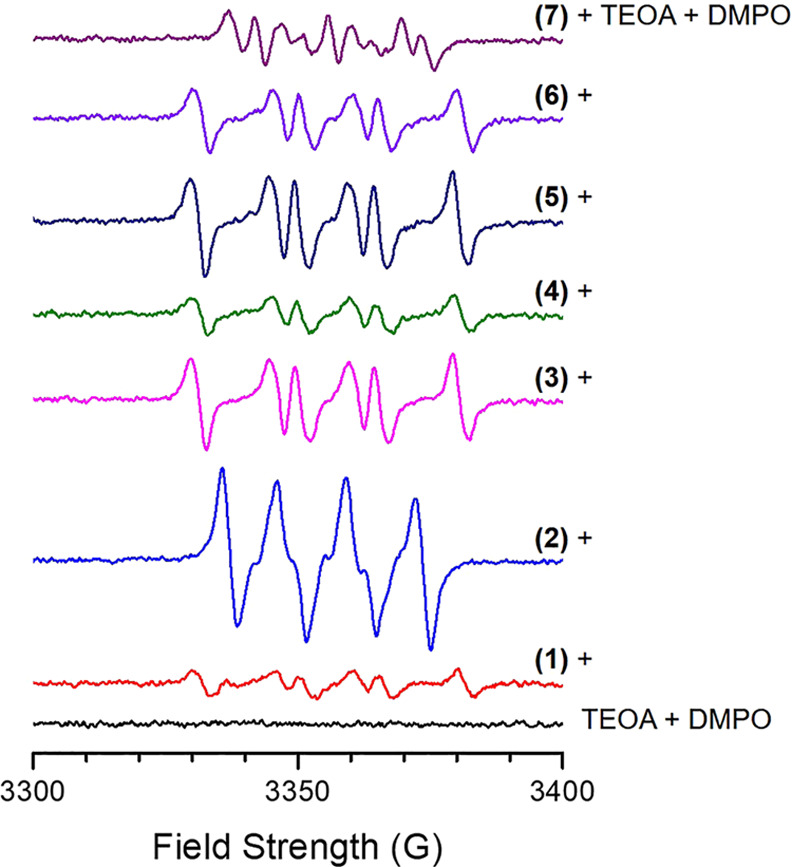
Solution EPR spectra obtained from mixture ethanolic solutions of fluorescein dyes + TEOA + DMPO at room temperature after 90 s under visible-light irradiation. Experimental conditions: microwave frequency, 9.424–9.427 GHz; microwave power, 1 mW; modulation amplitude, 1 G; modulation frequency, 100 kHz; time constant, 0.08192 s; scan speed, 732 G min–1; and [Fluorescein]0 = 1 mM, [TEOA]0 = [DMPO]0 = 0.1 M.
The EPR spectra of the mixture solutions of group I + TEOA + DMPO (Figure 3a) could be well characterized with giso = 2.0066 and hyperfine couplings of Aiso(N) = 15.0 G and Aiso(H) = 19.2 G. These EPR parameters are similar to those observed from the C-centered radical species trapped by DMPO.54−56 In the case of (2) + TEOA + DMPO (Figure 3b), the numerical calculation showed that the EPR arose from a species with giso = 2.0069, Aiso(N) = 13.1 G, and Aiso(H) = 10.3 G, which are characteristics of the DMPO–OOH/DMPO–O2– spin adducts in ethanol.54,56−59 We also assume that singlet oxygen (1O2), generated by energy transfer between 3Dye* and molecular oxygen, can react with DMPO; as a result, the oxidation products such as DMPO–OH spin adduct can be formed.60 The EPR spectrum obtained from (7) + TEOA + DMPO (Figure 3c) could be resolved into two radical EPR signals: one with giso = 2.0067, Aiso(N) = 13.2 G, and Aiso(H) = 9.6 G (Sim 1), and the other with giso = 2.0065 and Aiso(N) = 13.9 G (Sim 2). The close proximity between the EPR parameters of Sim 1 and (2) + TEOA + DMPO suggests that the radical of Sim 1 is DMPO–OOH/DMPO–O2– or an O-centered radical species trapped by DMPO including DMPO–OH. Sim 2, interestingly, shows a simple triplet EPR signal. Because DMPO spin adducts usually show more complicated EPR, we presume that an N-centered radical itself gave rise to the intensity of Sim 2. In summary, the above spin-trap EPR investigation reveals C-centered radical species produced by the intermolecular PET between TEOA and 3(1)*, 3(3)*, 3(4)*, 3(5)*, or 3(6)* and O-centered radical species by 3(2)* or 3(7)*.
Figure 3.

Normalized EPR spectra of Figure 2 and their corresponding numerical simulations. Simulation parameters: (a) microwave frequency = 9.425 GHz, giso = 2.0066, Aiso(N) = 15.0 G, Aiso(H) = 19.2 G, and line width = 2.7 G; (b) microwave frequency = 9.425 GHz, giso = 2.0069, Aiso(N) = 13.1 G, Aiso(H) = 10.3 G, and line width = 2.7 G; and (c) microwave frequency = 9.427 GHz, (Sim 1) giso = 2.0067, Aiso(N) = 13.2 G, Aiso(H) = 9.6 G, line width = 3.0 G, (Sim 2) giso = 2.0065, Aiso(N) = 13.9 G, and line width = 3.0 G. The simulated EPR spectra were calculated using EasySpin software.61
The colorimetric intensities exhibited by (3)–(6)-spotted chips at 0.2 μM concentrations were approximately 25% lower than that of the (1)-spotted chip at the same concentration. For example, although the colorimetric intensity of the (1)-spotted chip at 0.2 μM concentration was 32000 ± 290 au, those of (3)- and (4)-spotted chips, bearing a moderate activator and deactivator, respectively, at 0.2 μM concentrations, were 21000 ± 5300 and 26000 ± 3100 au, respectively (Figure 1). Furthermore, the (5)- and (6)-spotted chips, having a weak activator and deactivator, respectively, at 0.2 μM concentrations also showed lower colorimetric intensities than the (1)-spotted chip at the same concentration. The colorimetric intensities of the (5)- and (6)-spotted chips were 26000 ± 1900 and 25000 ± 700 au, respectively. These results indicate that regardless of the type, the presence of substituents in the phenyl ring deteriorates the catalytic performance relative to intact fluorescein (1). We assume that the low catalytic performances of dyes (3)–(6) are related to the ΔG values of PET (ΔGPET), representing the driving forces for the rate of this electron transfer. Based on the Marcus theory, the rate constants for the intermolecular ET increase with – ΔG° values until they reach a maximum, and decrease in an inverted region (i.e., the Marcus inverted region).58 The substituents of (3)–(6) cause these dyes to exhibit ΔGPET values that are more negative than that of (1), mainly due to their reduction potentials (Table 1). These larger negative ΔG values are located in the inverted region in Marcus theory, such that the catalytic performances of (3)–(6) are reduced with respect to that of intact fluorescein (1).
A directing effect on photoredox catalysis was also observed in the substituted fluorescein dyes, particularly in the phenyl ring of fluorescein. As a model study, the photoredox catalytic performance of flourescein-6-isothiocyanate was compared with that of fluorescin-5-isothiocyanate (4). Specifically, at 0.2 μM concentration of the spotting solution, hydrogels were formed in both the chip spotted with (4) and that spotted with flourescein-6-isothiocyanate; moreover, the colorimetric intensities measured for the two chips were 25988 ± 1997 and 25816 ± 1126 au, respectively (Figure S23). Since the photoredox catalytic performance was not substantially affected by the position of the substituent on the phenyl ring, the directing effect was not a critical factor in this study.
To support the hypothesis, we investigated other factors, such as molar absorptivity, phosphorescence, and the photobleaching rate of the dyes. Typically, a high molar absorptivity (ε) in the visible-light region is a favorable trait from the perspective photoredox reaction as it allows for efficient absorption of the light energy and promotes the formation of reactive species. Because the molar absorptivity of (1) (ε = 93660 cm–1·M–1) is slightly larger than those of dyes (3)–(6) (ε < 86000 cm–1·M–1) (Table 1), the molar absorptivity can affect the catalytic performance of the dyes. However, the photopolymerization results challenge the idea that the molar absorptivity is a decisive factor in this work. For example, although (5) had a lower absorptivity (ε = 58600 cm–1·M–1) compared to compounds (3), (4), and (6) with ε values ranging from 71100 to 85800 cm–1·M–1, the colorimetric intensities of the (3)–(6)-spotted chips were similar to each other after postinterfacial photopolymerization (Figure 1). We assume that the ΔGPET value exhibited by (5) compensates for the relative low molar absorptivity of this dye since the ΔGPET of (5) is closer to that of (1) than those of (3), (4), and (6) (Table 1).
To observe phosphorescence emission, the photoluminescence spectra of dyes (1)–(7) were measured under a liquid nitrogen atmosphere at approximately 77 K. Since it is difficult to directly measure the quantum yield of ISC (ΦISC), the relative ΦISC values can be inferred from the phosphorescence intensity without considering nonradiative transitions from the triplet electronic state. Although the delayed fluorescence bands of (1)–(7) were clearly observed around 550 nm, the phosphorescence bands of these dyes were very weak around 600 nm (Figure S24). Therefore, we assume that differences among the ISCs occurring in (1)–(7) can be excluded as the rationale for the observed differences in catalytic performance. To estimate photobleaching rates, we measured the fluorescence intensities of (1) and (3)–(6) at 0.2 μM concentration, dissolved in an aqueous solution of 0.75 M TEOA, under different irradiation times. After 1 min of irradiation, the dyes were photobleached within the range of 10–30% (Figure S25). Although (4) exhibited a lower photobleaching rate than the others, its catalytic performance was lower than that of (1) and similar to those of (3), (5), and (6). Thus, differences in photobleaching rates do not significantly affect the catalytic performances.
3.5. Visible-Light-Induced Polymerization in a Single-Solution Phase
We further verified the interfacial photopolymerization results by conducting a photopolymerization in a single-solution phase (Figure 4). Briefly, each dye was added to a vial containing an aqueous solution of TEOA, VP, and PEGDA. The reaction mixture (total volume: 250 μL) was carefully mixed with a vortex mixer before the vial was exposed to the visible LED for 1 min. After the staining process with phenolphthalein, the resulting solution was photographed with a digital camera. At 1.0 μM concentration of each dye, thick hydrogels were visible at the bottom of the vials containing (1), (3), (4), (5), or (6) each; however, no hydrogel formation was detected in the vials containing (2) or (7) each. When the hydrogel-containing vials were flipped upside-down, the red-stained hydrogels were suspended at the top of the vial, and the remaining solution was left at the bottom of the vial (Figure 4a). At 0.35 μM concentration of each dye, only the flipped vial containing (1) showed the presence of a hydrogel on the top, whereas only the unreacted, remaining solution was visible at the bottom in the other flipped vials containing (2)–(7) each (Figure 4b). Therefore, the efficiency of the hydrogelation resulting from the photoredox reaction of (1)–(7) in vials increased in the order (2) ≈ (7) < (3)–(6) < (1) under the same reaction conditions. This trend is in accordance with the order of the efficiencies of interfacial photopolymerization.
Figure 4.

Representative images of the photopolymerization of fluorescein dyes (1)–(7) at (a) 1.0 and (b) 0.35 μM concentrations in a single-solution phase under visible-light irradiation for 1 min, followed by staining with phenolphthalein. The dotted squares highlight the areas of hydrogels. The scale bars indicate 1.5 cm.
3.6. Investigation of Photoinduced Free-Radical Polymerization Using Fluorescence and NMR spectroscopy
As a negative control experiment, we investigated the fluorescence quenching (Stern–Volmer quenching) of each dye with the monomer (PEGDA) to rule out the electron transfer between a dye and the monomer (PEGDA). Briefly, the concentration of the monomer dissolved in a dye (aq) was gradually increased, and the maximum intensity of the fluorescence was recorded (detailed in the Supporting Information). We observed a slight decrease in the fluorescence intensity (I) after the addition of a large amount of the monomer (Figure S26). Thus, the dyes (1)–(7) exhibited the low Stern–Volmer constant (Ksv) values (<10) (Figure 5a). For example, the Ksv value of fluorescein (1) was approximately 8.4 M–1 (Table S1). Consequently, we confirm that the suggested mechanism for photoinduced free-radical polymerization depicted in Scheme 1 is based on a photoredox reaction between a dye and TEOA.
Figure 5.

(a) Stern–Volmer plot of the ratio Io/I versus the monomer concentration. Io/I corresponds to the fluorescence intensity in the different concentrations of the monomer (PEGDA). (b) Monomer conversion versus the irradiation time.
Furthermore, we determined the quantum yield of this photoinduced free-radical polymerization using dyes (1)–(7) as photoredox catalysts. Based on the IUPAC definition, the quantum yield of the photochemical reaction is the fraction of the number of photons absorbed by a sample which is converted to product: Φ = (the number of products formed/the number of absorbed photons of the particular wavelength) = Nproducts/Nphotons, abs(λ).62,63 To determine the number of formed products, we determined the monomer conversion for this photopolymerization using 1H NMR spectroscopy (Figures S27–S33). The results of monomer conversion using dyes (1)–(7) are shown in Figure 5b. We observed that the monomer conversions of (2) and (7) were noticeably lower than those of the others, which showed 30–50% conversions at 5 min of irradiation. At 1 min irradiation, (3) exhibited somehow lower monomer conversion than (1), (4), (5), and (6). These trends were consistent with the results of the interfacial photopolymerization and the single-solution phase photopolymerization.
In addition to the number of formed products, the number of photons absorbed at the particular wavelength was calculated for the following relationship: Nphotons, abs(λ) = (λ·Pabs·tirradiation)/(h·c·NA·V), where λ is the peak wavelength of the LED, Pabs is the power of LED, tirradiation is the time of irradiation (s), h is Planck’s constant (h = 6.63 × 10⁻³⁴ J·s), c is the speed of light in a vacuum (c = 299 792 458 m·s–1), NA is Avogadro’s constant (NA = 6.02 × 10²³ mol–1), and V is the reaction volume (in L). Thus, the quantum yields of photopolymerization were 3.4 (1), 0 (2), 1 (3), 2.9 (4), 3.4 (5), 3.4 (6), and 0 (7) at 1 min irradiation and 22.8 (1), 0 (2), 22.1 (3), 20.7 (4), 17.6 (5), 24.5 (6), and 0 (7) at 5 min irradiation. Taken together, we successfully compared the quantum yields of photopolymerization using the dyes, and the quantum yields corresponded to the results of the interfacial photopolymerization and the single-phase solution photopolymerization.
4. Conclusions
In summary, fluorescein and its derivatives display various advantages as visible-light photoredox catalysts, such as promoting photochemical reactions under aerobic conditions, as well as stimulus-responsive structural behaviors and low cytotoxicity. Therefore, we investigated the substituent effects in fluorescein to better understand the mechanism of the photoredox reaction to facilitate the development of novel organic photoredox catalysts. Herein, six different functional groups were introduced onto the phenyl ring of fluorescein to activate or deactivate the ring. The substituent effects were evaluated by comparing the catalytic performances of the prepared fluorescein dyes through the photopolymerization occurring on a surface and in a single-solution phase to those of intact fluorescein. Consequently, the substituted fluorescein dyes showed lower catalytic performances than those of intact fluorescein. The amino and nitro groups exhibited the lowest catalytic performance and did not form the hydrogel below a concentration of 1.0 μM, presumably due to intramolecular PETs. The others, which are representative moderate or weak activators and deactivators, exhibited lower performances than intact fluorescein, presumably because of the more negative ΔGPET values. These experimental results will help overcome the major issue associated with the tunability of the redox potentials of organic photoredox catalysts and extend their biological applications for tasks such as polymerization inside or outside living cells and the naked-eye detection of infectious diseases.
Acknowledgments
This research was supported by the National Research Foundation of Korea (NRF) grant funded by the Korea government (MSIT) (Nos. 2020R1F1A1048329 and RS-2023-00239038).
Supporting Information Available
The Supporting Information is available free of charge at https://pubs.acs.org/doi/10.1021/acsomega.3c04324.
Additional experimental details, materials and methods, and figures as mentioned in the text (PDF)
Author Contributions
† W.O.C., Y.J.J. and M.K. contributed equally to this work. The manuscript was written through contributions of all authors. All authors have given approval to the final version of the manuscript.
The authors declare no competing financial interest.
Supplementary Material
References
- Hansch C.; Leo A.; Taft R. W. A Survey of Hammett Substituent Constants and Resonance and Field Parameters. Chem. Rev. 1991, 91, 165. 10.1021/cr00002a004. [DOI] [Google Scholar]
- Corbin D. A.; Miyake G. M. Photoinduced Organocatalyzed Atom Transfer Radical Polymerization (O-ATRP): Precision Polymer Synthesis Using Organic Photoredox Catalysis. Chem. Rev. 2022, 122, 1830. 10.1021/acs.chemrev.1c00603. [DOI] [PMC free article] [PubMed] [Google Scholar]
- Celik H.; Ekmekci G.; Ludvik J.; Picha J.; Zuman P. Electroreduction of Aromatic Oximes: Diprotonation, Adsorption, Imine Formation, and Substituent Effects. J. Phys. Chem. B 2006, 110, 6785. 10.1021/jp056808t. [DOI] [PubMed] [Google Scholar]
- Bao Z.; Locklin J.. Organic Field-Effect Transistors; CRC Press: Boca Raton, 2007. [Google Scholar]
- Matero-Alonso A. π-Conjugated Materials: Here, There, and Everywhere. Chem. Mater. 2023, 35, 1467. [Google Scholar]
- Someya T.; Bao Z.; Malliaras G. G. The Rise of Plastic Bioelectronics. Nature 2016, 540, 379. 10.1038/nature21004. [DOI] [PubMed] [Google Scholar]
- Zheng Y.; Zhang S.; Tok J. B.; Bao Z. Molecular Design of Stretchable Polymer Semiconductors: Current Progress and Future Directions. J. Am. Chem. Soc. 2022, 144, 4699. 10.1021/jacs.2c00072. [DOI] [PubMed] [Google Scholar]
- Lee Y. J.; Cho H. Y.; Yoon H.; Kang H. Y. B.; Yoo H.; Zhou H. Y.; Jeong S.; Lee G. H.; Kim G.; Go G. T.; Seo J.; Lee T. W.; Hong Y. T.; Yun Y. J. Advancements in Electronic Materials and Devices for Stretchable Displays. Adv. Mater. Technol. 2023, 202201067 10.1002/admt.202201067. [DOI] [Google Scholar]
- Hagfeldt A.; Boschloo G.; Sun L.; Kloo L.; Pettersson H. Dye-Sensitized Solar Cells. Chem. Rev. 2010, 110, 6595. 10.1021/cr900356p. [DOI] [PubMed] [Google Scholar]
- Li X.; Zhang Q.; Yu J.; Xu Y.; Zhang R.; Wang C.; Zhang H.; Fabiano S.; Liu X.; Hou J.; Gao F.; Fahlman M. Mapping the Energy Level Alignment at Donor/Acceptor Interfaces in Non-Fullerene Organic Solar Cells. Nat. Commun. 2022, 13, 2046. 10.1038/s41467-022-29702-w. [DOI] [PMC free article] [PubMed] [Google Scholar]
- Ko S.; Mondal R.; Risko C.; Lee J. K.; Hong S. H.; McGehee M. D.; Bredas J. L.; Bao Z. Tuning the Optoelectronic Properties of Vinylene-Linked Donor-Acceptor Copolymers for Organic Photovoltaics. Macromolecules 2010, 43, 6685. 10.1021/ma101088f. [DOI] [Google Scholar]
- Duhm S. Interface Energetics Make Devices. Electron. Struct. 2022, 4, 0340003 10.1088/2516-1075/ac884d. [DOI] [Google Scholar]
- Bures F. Fundamental Aspects of Property Tuning in Push-Pull Molecules. RSC Adv. 2014, 4, 58826. 10.1039/C4RA11264D. [DOI] [Google Scholar]
- Eakins G. L.; Alford J. S.; Tiegs B. J.; Breyfogle B. E.; Stearman C. J. Tuning HOMO-LUMO Levels: Trends Leading to the Design of 9-Fluorenone Scaffolds with Predictable Electronic and Optoelectronic Properties. J. Phys. Org. Chem. 2011, 24, 1119. 10.1002/poc.1864. [DOI] [Google Scholar]
- Ha J. M.; Hur S. H.; Pathak A.; Jeong J. E.; Woo H. Y. Recent Advances in Organic Luminescent Materials with Narrowband Emission. NPG Asia Mater. 2021, 13, 53. 10.1038/s41427-021-00318-8. [DOI] [Google Scholar]
- Zhang X. F.; Zhang J.; Liu L. Fluorescence Properties of Twenty Fluorescein Derivatives: Lifetime, Quantum Yield, Absorption and Emission Spectra. J. Fluoresc. 2014, 24, 819. 10.1007/s10895-014-1356-5. [DOI] [PubMed] [Google Scholar]
- Neckers D. C.; Valdes-Aguilera O. M.. Photochemistry of the Xanthene Dyes; John-Wiley and Sons, 1993. [Google Scholar]
- Asanuma D.; Sakabe M.; Kamiya M.; Yamamoto K.; Hiratake J.; Ogawa M.; Kosaka N.; Choyke P. L.; Nagano T.; Kobayashi H.; Urano Y. Sensitive β-Galactosidase-Targeting Fluorescence Probe for Visualizing Small Peritoneal Metastatic Tumours in Vivo. Nat. Commun. 2015, 6, 6463. 10.1038/ncomms7463. [DOI] [PMC free article] [PubMed] [Google Scholar]
- Keller S. G.; Kamiya M.; Urano Y. Recent Progress in Small Spirocyclic, Xanthene-Based Fluorescent Probes. Molecules 2020, 25, 5964. 10.3390/molecules25245964. [DOI] [PMC free article] [PubMed] [Google Scholar]
- Vacca L. L.Laboratory Manual of Histochemistry; Raven Press: New York, 1985. [Google Scholar]
- Lewandowska-Andralojc A.; Larowska D.; Gacka E.; Pedzinski T.; Marciniak B. How Eosin Y/Graphene Oxide-Based Materials Can Improve Efficiency of Light-Driven Hydrogen Generation: Mechanistic Aspects. J. Phys. Chem. C 2020, 124, 2747. 10.1021/acs.jpcc.9b09573. [DOI] [Google Scholar]
- Chan J.; Dodani S. C.; Chang C. J. Reaction-Based Small-Molecule Fluorescent Probes for Chemoselective Bioimaging. Nat. Chem. 2012, 4, 973. 10.1038/nchem.1500. [DOI] [PMC free article] [PubMed] [Google Scholar]
- Kobayashi H.; Ogawa M.; Alford R.; Choyke P. L.; Urano Y. New Strategies for Fluorescent Probe Design in Medical Diagnostic Imaging. Chem. Rev. 2010, 110, 2620. 10.1021/cr900263j. [DOI] [PMC free article] [PubMed] [Google Scholar]
- Zhou X.; Lee S.; Xu Z. C.; Yoon J. Recent Progress on the Development of Chemosensors for Gases. Chem. Rev. 2015, 115, 7944. 10.1021/cr500567r. [DOI] [PubMed] [Google Scholar]
- Hu J.; Wang J.; Nguyen T. H.; Zheng N. The Chemistry of Amine Radical Cations Produced by Visible Light Photoredox Catalysis. Beilstein J. Org. Chem. 2013, 9, 1977. 10.3762/bjoc.9.234. [DOI] [PMC free article] [PubMed] [Google Scholar]
- Hari D. P.; Schroll P.; Konig B. Metal-Free, Visible-Light-Mediated Direct C-H Arylation of Heteroarenes with Aryl Diazonium Salts. J. Am. Chem. Soc. 2012, 134, 2958. 10.1021/ja212099r. [DOI] [PubMed] [Google Scholar]
- Romero N. A.; Nicewicz D. A. Organic Photoredox Catalysis. Chem. Rev. 2016, 116, 10075. 10.1021/acs.chemrev.6b00057. [DOI] [PubMed] [Google Scholar]
- Corrigan N.; Shanmugam S.; Xu J.; Boyer C. Photocatalysis in Organic and Polymer Synthesis. Chem. Soc. Rev. 2016, 45, 6165. 10.1039/C6CS00185H. [DOI] [PubMed] [Google Scholar]
- Lee S. H.; Nam D. H.; Park C. B. Screening Xanthene Dyes for Visible Light-Driven Nicotinamide Adenine Dinucleotide Regeneration and Photoenzymatic Synthesis. Adv. Synth. Catal. 2009, 351, 2589. 10.1002/adsc.200900547. [DOI] [Google Scholar]
- Niu J.; Lunn D. J.; Pusuluri A.; Yoo J. I.; O’Malley M. A.; Mitragotri S.; Soh H. T.; Hawker C. J. Engineering Live Cell Surfaces with Functional Polymers via Cytocompatible Controlled Radical Polymerization. Nat. Chem. 2017, 9, 537. 10.1038/nchem.2713. [DOI] [PubMed] [Google Scholar]
- Romero G.; Lilly J. J.; Abraham N. S.; Shin H. Y.; Balasubramaniam V.; Izumi T.; Berron B. J. Protective Polymer Coatings for High-Throughput, High-Purity Cellular Isolation. ACS Appl. Mater. Interfaces 2015, 7, 17598. 10.1021/acsami.5b06298. [DOI] [PMC free article] [PubMed] [Google Scholar]
- Lilly J. L.; Berron B. J. The Role of Surface Receptor Density in Surface-Initiated Polymerizations for Cancer Cell Isolation. Langmuir 2016, 32, 5681. 10.1021/acs.langmuir.6b01146. [DOI] [PMC free article] [PubMed] [Google Scholar]
- Kim H.; Jung Y. J.; Lee J. K. Naked-Eye Detection of Hg(II) Ions by Visible Light-Induced Polymerization Initiated by a Hg(II)-Selective Photoredox Catalyst. Polym. Chem. 2021, 12, 970. 10.1039/D0PY01616K. [DOI] [Google Scholar]
- Nganga J. B.; Jung Y. J.; Si Y.; Kim M.; Ko H.; Hwang G. T.; Lee H. J.; Lee H. I.; Lee J. K. Photoinduced Radical Polymerization by Methyl Fluoresceins under Visible Light and the Application to Signal Amplification of Hydrogen Peroxide. Dyes Pigm. 2022, 200, 110163 10.1016/j.dyepig.2022.110163. [DOI] [Google Scholar]
- Heimer B. W.; Shatova T. A.; Lee J. K.; Kaastrup K.; Sikes H. D. Evaluating the Sensitivity of Hybridization-Based Epigenotyping Using a Methyl Binding Domain Protein. Analyst 2014, 139, 3695. 10.1039/C4AN00667D. [DOI] [PMC free article] [PubMed] [Google Scholar]
- Kim S.; Sikes H. D. Radical Polymerization Reactions for Amplified Biodetection Signals. Polym. Chem. 2020, 11, 1424. 10.1039/C9PY01801H. [DOI] [Google Scholar]
- Wu C.; Corrigan N.; Lim C. H.; Jung K.; Zhu J.; Miyake G.; Xu J. T.; Boyer C. Guiding the Design of Organic Photocatalyst for PET-RAFT Polymerization: Halogenated Xanthene Dyes. Macromolecules 2019, 52, 236. 10.1021/acs.macromol.8b02517. [DOI] [PMC free article] [PubMed] [Google Scholar]
- Wu C.; Chen H. Q.; Corrigan N.; Jun K.; Kan X. N.; Li Z. B.; Liu W. J.; Xu J. T.; Boyer C. Computer-Guided Discovery of a pH-Responsive Organic Photocatalyst and Application for pH and Light Dual-Gated Polymerization. J. Am. Chem. Soc. 2019, 141, 8207. 10.1021/jacs.9b01096. [DOI] [PubMed] [Google Scholar]
- Yoon J.; Jung Y. J.; Yoon J. B.; Damodar K.; Kim H.; Shin M.; Seo M.; Cho D. W.; Lee J. T.; Lee J. K. The Heavy-Atom Effect on Xanthene Dyes for Photopolymerization by Visible Light. Polym. Chem. 2019, 10, 5737. 10.1039/C9PY01252D. [DOI] [Google Scholar]
- Jung Y. J.; Nganga J. B.; Cho J. H.; Lee H. I.; Lee J. K. Photoinitiated Free-Radical Polymerization of 4,5,6,7-Tetrahalogenated Fluoresceins. Chem.—Asian J. 2021, 16, 2413. 10.1002/asia.202100619. [DOI] [PubMed] [Google Scholar]
- Zhang Z.; Luo Q.; Yan X.; Li Z.; Luo Y.; Yang L.; Zhang B.; Chen H.; Wang Q. Interin-Targeted Trifunctional Probe for Cancer Cells: A “Seeing and Counting” Approach. Anal. Chem. 2012, 84, 8946. 10.1021/ac302029w. [DOI] [PubMed] [Google Scholar]
- Petri L.; Szijj P. A.; Kelemen Á.; Imre T.; Gömöry Á.; Lee M. T. W.; Hegedűs K.; Ábrányi-Balogh P.; Chudasama V.; Keserű G. M. Cysteine Specific Bioconjugation with Benzyl Isothiocyanates. RSC Adv. 2020, 10, 14928. 10.1039/D0RA02934C. [DOI] [PMC free article] [PubMed] [Google Scholar]
- Woodroofe C. C.; Masalha R.; Barnes K. R.; Frederickson C. J.; Lippard S. J. Membrane-Permeable and -Impermeable Sensors of the Zinpyr Family and Their Application to Imaging of Hippocampal Zinc In Vivo. Chem. Biol. 2004, 11, 1659. 10.1016/j.chembiol.2004.09.013. [DOI] [PubMed] [Google Scholar]
- Han G.; Hong D.; Lee B. S.; Ha E.; Park J. H.; Choi I. S.; Kang S. M.; Lee J. K. Systematic Study of Functionalizable, Non-Biofouling Agarose Films with Protein and Cellular Patterns on Glass Slides. Chem.—Asian J. 2017, 12, 846. 10.1002/asia.201700010. [DOI] [PubMed] [Google Scholar]
- Aguirre-Soto A.; Kaastrup K.; Kim S.; Ugo-Beke K.; Sikes H. D. Excitation of Metastable Intermediates in Organic Photoredox Catalysis: Z-Scheme Approach Decreases Catalyst Inactivation. ACS Catal. 2018, 8, 6394. 10.1021/acscatal.8b00857. [DOI] [Google Scholar]
- Lambert C. R.; Kochevar I. E. Electron Transfer Quenching of the Rose Bengal Triplet State. Photochem. Photobiol. 1997, 66, 15. 10.1111/j.1751-1097.1997.tb03133.x. [DOI] [PubMed] [Google Scholar]
- Zhang X. F. The Effect of Phenyl Substitution on the Fluorescence Characteristics of Fluorescein Derivatives via Intramolecular Photoinduced Electron Transfer. Photochem. Photobio. Sci. 2010, 9, 1261–1268. 10.1039/c0pp00184h. [DOI] [PubMed] [Google Scholar]
- Chen M. C.; Chen D. G.; Chou P. T. Fluorescent Chromophores Containing the Nitro Group: Relatively Unexplored Emissive Properties. ChemPlusChem. 2021, 86, 11–27. 10.1002/cplu.202000592. [DOI] [PubMed] [Google Scholar]
- Brouwer A. M. Standards for Photoluminescence Quantum Yield Measurements in Solution (IUPAC Technical Report). Pure Appl. Chem. 2011, 83, 2213. 10.1351/PAC-REP-10-09-31. [DOI] [Google Scholar]
- Chambers R. W.; Kearns D. R. Triplet States of Some Common Photosensitizng Dyes. Photochem. Photobiol. 1969, 10, 215. 10.1111/j.1751-1097.1969.tb05681.x. [DOI] [PubMed] [Google Scholar]
- Pellegrin Y.; Odobel F. Sacrificial Electron Donor Reagents for Solar Fuel Production. C. R. Chimie. 2017, 20, 283. 10.1016/j.crci.2015.11.026. [DOI] [Google Scholar]
- Lee J. K.; Heimer B. W.; Sikes H. D. Systematic Study of Fluorescein-Functionalized Macrophotoinitiators for Colorimetric Bioassays. Biomacromolecules 2012, 13, 1136. 10.1021/bm300037t. [DOI] [PubMed] [Google Scholar]
- Kaastrup K.; Sikes H. D. Using Photo-Initiated Polymerization Reactions to Detect Molecular Recognition. Chem. Soc. Rev. 2016, 45, 532. 10.1039/C5CS00205B. [DOI] [PubMed] [Google Scholar]
- https://tools.niehs.nih.gov/stdb/index.cfm/spintrap/, 2023.
- Taniguchi H.; Madden K. P. DMPO-Alkyl Radical Spin Trapping: An In Situ Radiolysis Steady-State ESR study. Radiat. Res. 2000, 153, 447. 10.1667/0033-7587(2000)153[0447:DARSTA]2.0.CO;2. [DOI] [PubMed] [Google Scholar]
- Peyrot F.; Lajnef S.; Versace D. L. Electron Paramagnetic Resonance Spin Trapping (EPR-ST) Technique in Photopolymerization Processes. Catalysts 2022, 12, 772. 10.3390/catal12070772. [DOI] [Google Scholar]
- Guo Q.; Qian S. Y.; Mason R. P. Separation and Identification of DMPO Adducts of Oxygen-Centered Radicals Formed from Organic Hydroperoxides by HPLC-ESR, ESI-MS and MS/MS. J. Am. Soc. Mass Spectrom. 2003, 14, 862. 10.1016/S1044-0305(03)00336-2. [DOI] [PubMed] [Google Scholar]
- Harbour J. R.; Hair M. L. The Adsorption of Spin-Labeled Stearic Acids onto Zinc Oxide in Acetone: Photoinstability of the Absorbed Nitroxide. J. Phys. Chem. A 1978, 82, 1397. 10.1021/j100501a015. [DOI] [Google Scholar]
- Dabestani R.; Hall R. D.; Sik R. H.; Chignell C. F. Spectroscopic Studies of Cutaneous Photosensitizing Agents-XV. Anthralin and Its Oxidation-Product 1,8-Dihydroxyanthraquinone. Photochem. Photobiol. 1990, 52, 961. 10.1111/j.1751-1097.1990.tb01812.x. [DOI] [PubMed] [Google Scholar]
- Bilski P.; Reszka K.; Bilska M.; Chignell C. F. Oxidation of the Spin Trap 5,5-Dimethyl-1-Pyrroline N-Oxide by Singlet Oxygen in Aqueous Solution. J. Am. Chem. Soc. 1996, 118, 1330. 10.1021/ja952140s. [DOI] [Google Scholar]
- Stoll S.; Schweiger A. EasySpin, a Comprehensive Software Package for Spectral Simulation and Analysis in EPR. J. Magn. Reson. 2006, 178, 42. 10.1016/j.jmr.2005.08.013. [DOI] [PubMed] [Google Scholar]
- Takeda N.; Miller J. R. Inverted Region in Bimolecular Electron Transfer in Solution Enabled by Delocalization. J. Am. Chem. Soc. 2020, 142, 17997. 10.1021/jacs.0c04780. [DOI] [PubMed] [Google Scholar]
- Braslavsky S. E. Glossary of Terms Used in Photochemistry 3rd Edition. Pure Appl. Chem. 2007, 79, 293. 10.1351/pac200779030293. [DOI] [Google Scholar]
Associated Data
This section collects any data citations, data availability statements, or supplementary materials included in this article.