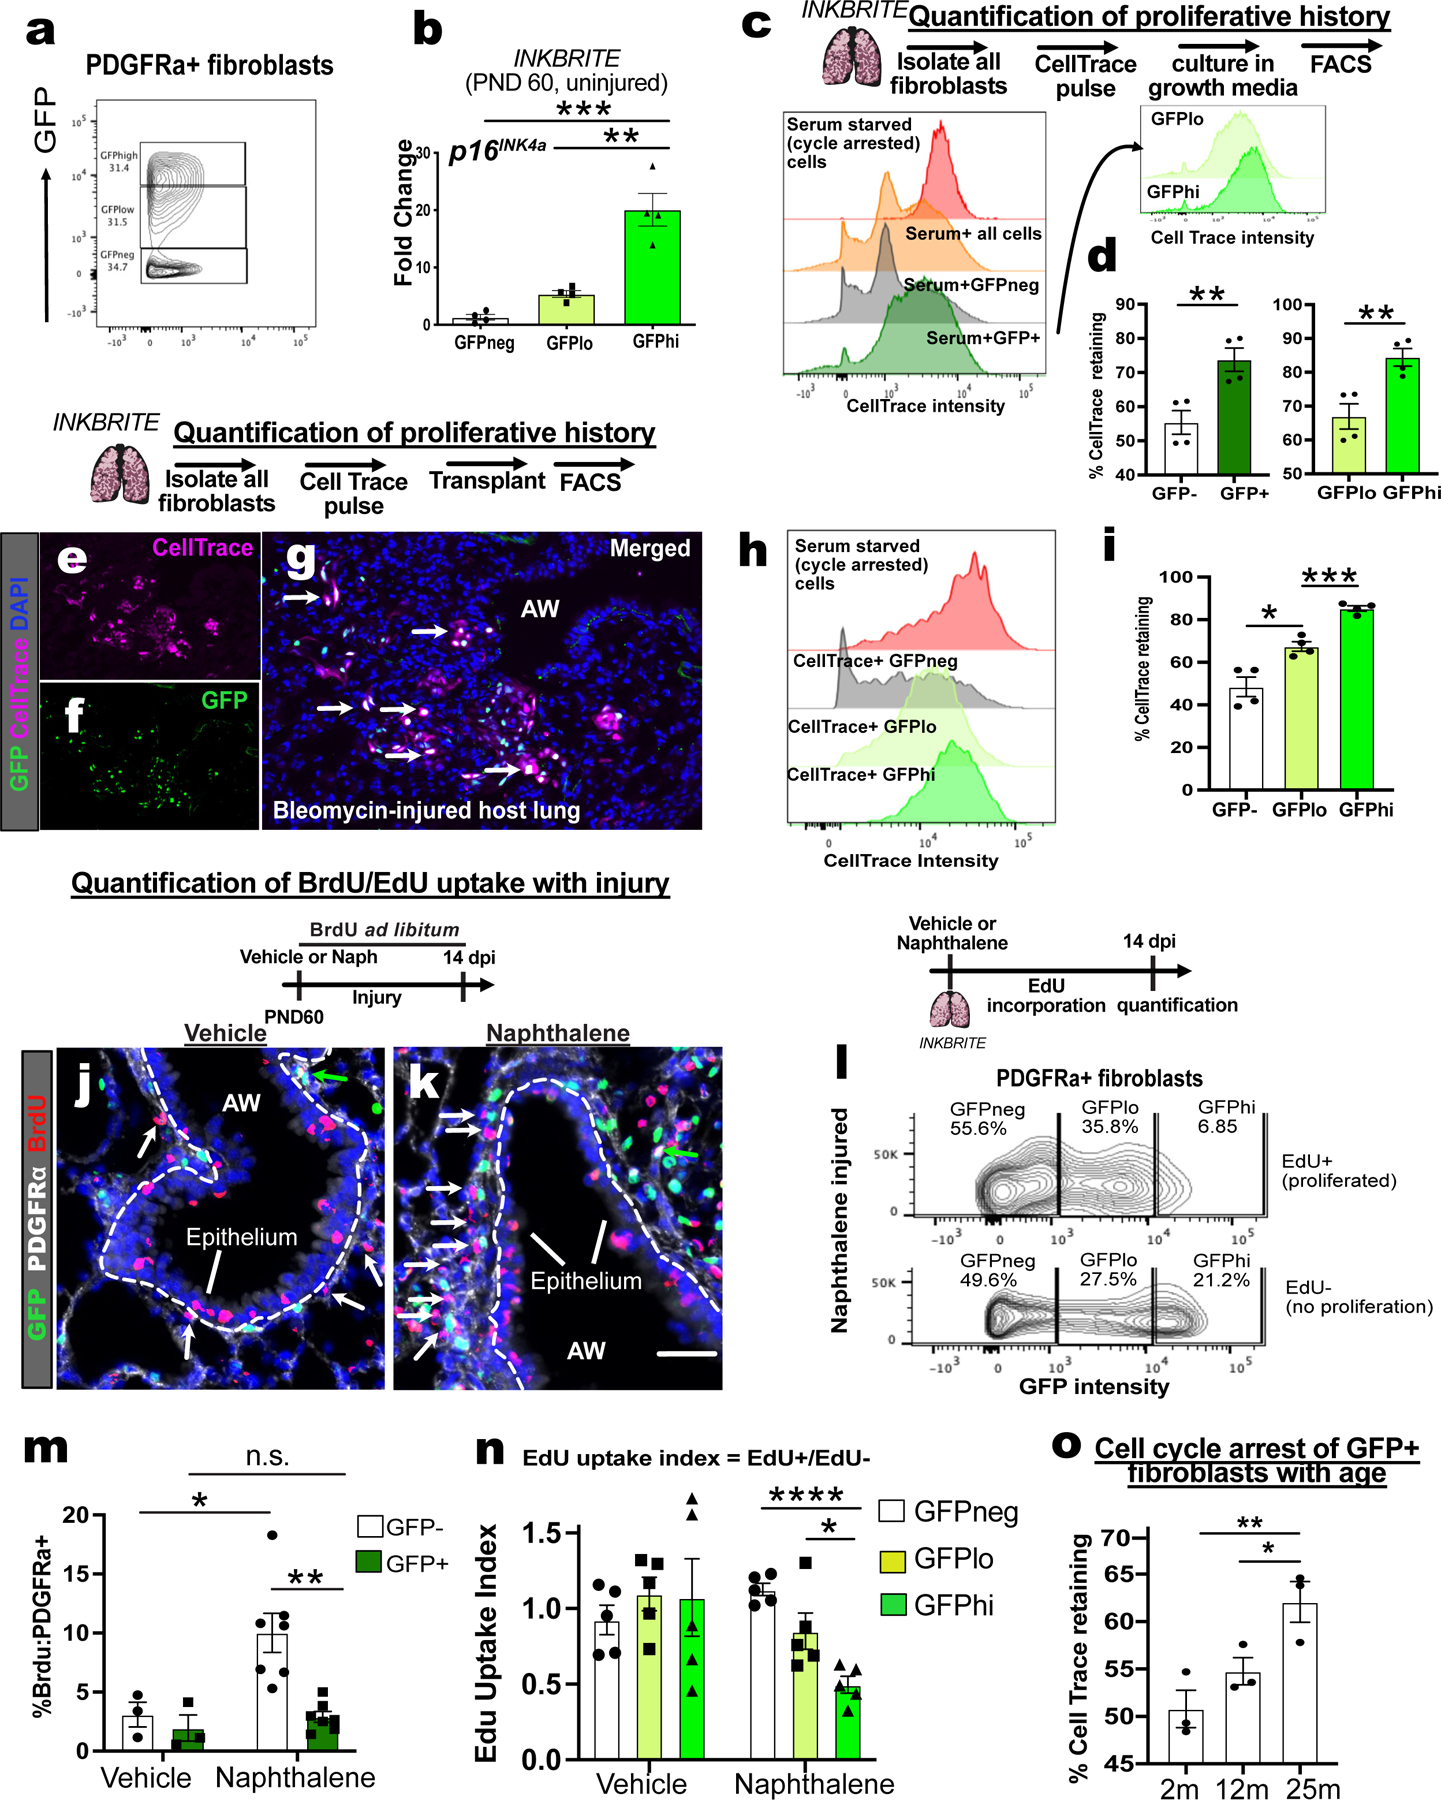
Figure 2. Range of p16INK4a expression correlates with proliferative cell cycle arrest.

(A) Sorting strategy for GFP−high, low, and negative (hi/lo/neg) fibroblasts cells from uninjured INKBRITE lungs using GFP fluorescent intensity. (B) qPCR of p16INK4A transcript in GFPhi/lo/neg populations (n=4, >2 experiments). (C) Histogram of CellTrace Far Red (CTFR) intensity in INKBRITE lung fibroblasts. (D) quantification of % cell cycle arrest based on percentage of cells with CTFR intensity of serum-deprived cells (n=4, >2 experiments). (E to I) Histology, FACS and quantification of CTFR+ transplanted INKBRITE fibroblasts into Bleomycin injured NGS™ mice (2 experiments, n=4). (J to L) IHC and quantification of BrdU incorporation into PDGFRα+ and GFP–(white arrows) or PDGFRα+ and GFP+ (green arrows) cells in vehicle or naphthalene-injured (14 dpi) lungs (n = 3 for vehicle, 6 for naphthalene). (M) GFP intensity distribution of EdU+ and EdU− fibroblast isolated from naphthalene injured lungs (14 dpi). (N) EdU uptake Index (%EdU+/%EdU−) of GFPhi/lo/neg fibroblast populations in vehicle and naphthalene treated (14 dpi) fibroblasts (n = 5 per condition, 2 experiments). (O) CTFR retention in GFP+ fibroblasts of 2m, 12m, and 25m old INKBRITE lungs (n = 3 per timepoint, 2 experiments). AW = airway, dpi = days post injury. Each point in graph represents one animal with mean ± s.e.m. All p values determined by one-tailed t-test or two-way ANOVA when applicable. * p<0.05, ** p<0.01, *** p<0.001, **** p<0.0001.
