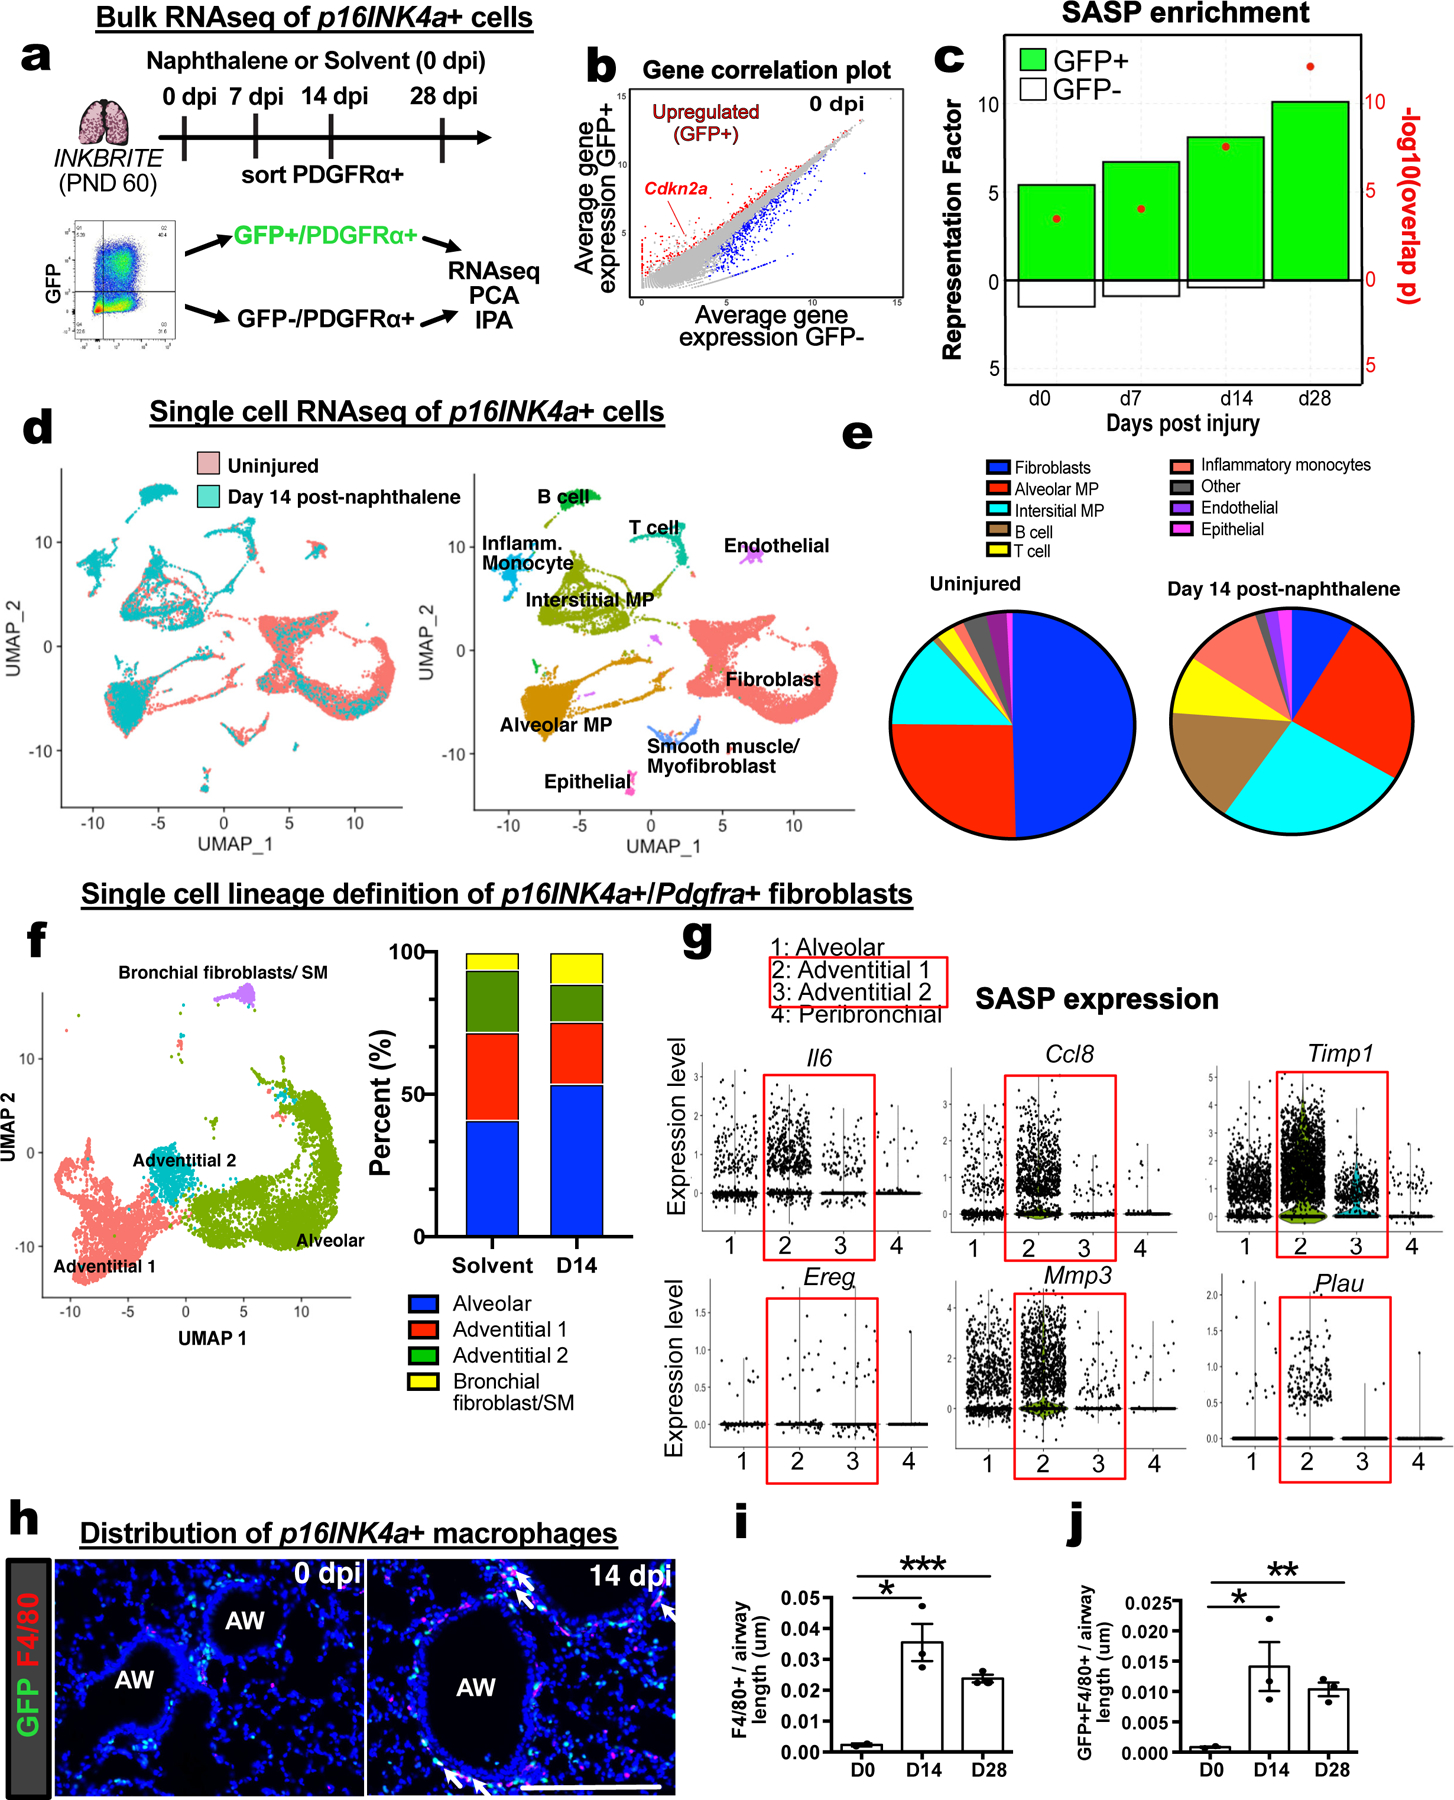
Figure 3. Single cell and bulk RNA sequencing analysis of p16INK4A+ cells in the lung.

(A) Bulk RNAseq of p16INK4A+ and – fibroblasts during homeostasis (0 dpi) and injury (7,14,28 dpi) (n=3 animals per timepoint). (B) Gene correlation plot showing Cdkn2a expression. (C) Hypergeometric probability test for enrichment of differentially expressed genes (DEGs) between GFP+ and GFP−neg fibroblasts at each timepoint with SASP genes as quantified by Representation Factor and p-value. (D and E) Single cell analysis of all p16INK4A+ cells in 0 dpi and 14 dpi INKBRITE lungs. (F) Clustering of p16INK4A+ fibroblasts into distinct subsets in 0 dpi and 14 dpi INKBRITE lungs. (G) SASP gene expression at the single cell level in the 4 fibroblast subsets. (H to J) Histologic analysis of F4/80+ and GFP+ and F4/80+ macrophage/monocyte population in 0 dpi and 14 dpi INKBRITE lungs (0, 14, and 28 dpi; n=3). AW = airway, dpi = day post injury. Each point in graph represents one animal with mean ± s.e.m. All p values determined by one-tailed t-test. * p<0.05, ** p<0.01, *** p<0.001, **** p<0.0001.
