

Abstract
Media portrayals of a loneliness “epidemic” are premised on an increase in the proportion of people living alone and decreases in rates of civic engagement and religious affiliation over recent decades. However, loneliness is a subjective perception that does not correspond perfectly with objective social circumstances. In this study, we examine whether perceived loneliness is greater among the Baby Boomers—individuals born 1948–1965—relative to those born 1920–1947, and whether older adults have become lonelier over the past decade (2005–2016). We use data from the National Social Life, Health and Aging Project (NSHAP) and from the Health and Retirement Study (HRS) collected during 2005–16 to estimate differences in loneliness associated with age, birth year and survey timepoint. Overall, loneliness decreases with age through the early 70s, after which it increases. We find no evidence that loneliness is substantially higher among the Baby Boomers or that it has increased over the past decade. Loneliness is however associated with poor health, living alone or without a spouse/partner and having fewer close family and friends, which together account for the overall increase in loneliness after age 75. Although these data do not support the idea that older adults are becoming lonelier, the actual number of lonely individuals may increase as the Baby Boomers age into their 80s and beyond. Our results suggest that attention to social factors and improving health may help to mitigate this.
Keywords: Loneliness, age-period-cohort effects, Baby Boom cohorts
In recent years, media portrayals of loneliness have depicted a growing and pressing problem—an “epidemic” (Hafner, 2016; Kar-Purkayastha, 2010; Murthy, 2017) deemed urgent largely because of the link between loneliness and morbidity (Hawkley & Cacioppo, 2010), greater healthcare utilization (Gerst-Emerson & Jaywardhana, 2016), and mortality (Holt-Lunstad et al., 2015). Concern about rising rates of loneliness is typically premised on an increase in the proportion of people living alone, smaller core social networks, less civic engagement, and lower rates of religious affiliation in recent decades (Holt-Lunstad, 2017; Holt-Lunstad, Robles, & Sbarra, 2017), each suggestive of rising rates of individualism. Yet loneliness is not synonymous with structural indicators of social connection but is instead defined by a perceived discrepancy between desired and attained social relationships (Peplau & Perlman, 1982). Thus, structural changes in society may not necessarily yield changes in loneliness prevalence or intensity. The purpose of this analysis is to examine the evidence for an increase in loneliness among older U.S. adults over the past decade (2005–16). Such an increase might reflect either higher levels of loneliness among the Baby Boomers who are now entering older ages (a cohort effect) or an overall increase in loneliness in the population (a period effect).
In addition to possible changes in loneliness at the population level, we also examine several established risk factors for loneliness at the individual level (Cohen-Mansfield, Hazan, Lerman, & Shalom, 2016; Pinquart & Sorenson, 2001; Theeke, 2009). Specifically, we examine whether the associations between these factors and loneliness differ among the Baby Boomers as compared to previous generations. For instance, although being married protects against loneliness (Stack, 1998), this effect may have become less strong among more recent generations, due to increasing tolerance of divorce and singlehood (Van Tilburg, Aartsen & Van der Pas, 2015). Changes in the prevalence of risk factors as well as in their association with loneliness may have implications for the amount of loneliness in the population. Moreover, understanding these risk factors is critical for developing effective interventions to reduce loneliness among older adults.
Background
As noted above, increases in loneliness in the older adult population over the last few decades (i.e., period effects) have been posited on the basis of the growing prevalence of living alone, decreased rates of social and religious involvement, and an aging population that is increasingly isolated as older adults age-in-place with poor health and limited mobility (Holt-Lunstad, 2017; Nyquist et al., 2017). Despite these societal changes, extant data do not support the assumption that these changes are evident in the prevalence or intensity of loneliness. A nationally representative study of the oldest old in Sweden that used a repeated cross-sectional design found no change in loneliness prevalence in 77+-year-olds (mean age=83 years) over a 22-year interval between 1992 and 2014 (Dahlberg, Agahi, & Lennartsson, 2018). In addition, a repeated cross-sectional study of Swedish adults aged 85, 90, and 95 years found no increase in loneliness over a ten-year interval between 2000-2002 and 2010-2012 (Nyqvist, Cattan, Conradsson, Näsman, & Gustafsson, 2017).
Other research has examined period effects in conjunction with cohort effects, which are of primary concern in the present study. Most of this research has been conducted in European countries. Period and cohort differences in the prevalence or intensity of loneliness have typically not been seen, although results are sometimes mixed depending on the country and time period being studied. Pitkala et al. (Pitkala, Valvanne, Kulp, Strandberg, & Tilvis, 2001) found no difference in loneliness rates among Finnish 75, 80, and 85 year-olds born ten years apart (i.e., born 1904-1914 versus 1914-1924), although actual rates were not reported. Victor et al. (Victor, Scambler, Shah, Cook, Harris, … & De Wilde, 2002) reviewed four early surveys conducted in England and found no differences in the prevalence of frequent loneliness among 60–75+ year-old adults in birth cohorts that ranged from 1865 to 1934. These cohorts did however differ in the prevalence of never feeling lonely, which decreased across cohorts, and sometimes feeling lonely, which increased across cohorts. Using data from the Berlin Aging Study, Hülür et al. (2016) found that loneliness levels were substantially lower among 75-year-olds in the more recent 1925-1949 birth cohort than in the earlier 1901-1922 birth cohort. Similarly, Eloranta et al. (Eloranta, Arve, Isoaho, Lehtonen, & Viitanen, 2015) found lower rates of loneliness in more recent Finnish cohorts of 70-year-olds born in 1940 compared to 70-year-olds born in 1920. None of these studies has compared adults born in 1948–65 (corresponding to the Baby Boomers) to earlier generations. In addition, no studies have examined cohort differences in loneliness in older adults in the U.S.
Dykstra (2009) identifies three factors that might contribute to differences in loneliness between the U.S. and European countries. One is differences in the distributions of individual characteristics such as wealth, health, and marital status—all of which have been found to be associated with loneliness (Fokkema, De Jong Gierveld & Dykstra, 2012). A second potential factor is differences in social and cultural characteristics. For example, social peripheralization of older adults is common, and social exclusion is robustly linked to loneliness (Hagerty, Williams, Coyne, & Early, 1996; Leary, 1990; Schirmer & Michailakis, 2018). This effect is exacerbated in countries with more marked income inequality (Yan, Yang, Wang, Zhao, & Yu, 2014), and income inequality is greater in the U.S. than in European countries on average (World Bank, 2017). Third, effects of individual characteristics may vary between the U.S. and Europe. For example, poor health and disability may lead to greater risk for loneliness in the U.S. than in Europe because health care access and affordability is poorer in the U.S. (He, 2016).
In addition to creating overall differences in loneliness across countries, these factors may also combine with country-specific changes in the population to yield differences in temporal patterns of loneliness. For instance, Banks et al. (2010) found that among adults born before 1930, those in the U.S. were more likely than those in England to have children, whereas among those born in 1940 or later, English adults were more likely than U.S. adults to have children. Thus the “Baby Boom” was not experienced in the same way in the U.S. as in the UK (see also Reher & Requena, 2015). At the same time, English parents had more frequent contact with their children than did U.S. parents, whereas U.S. parents felt closer to their children than did English parents. Contact with adult children, if the parent-child relationship is of high quality, has been shown to be associated with lower levels of loneliness (Fokkema & Naderi, 2013). Thus, changes in loneliness across cohorts may differ in the U.S. as compared to the UK.
Societal changes affecting Baby Boomers
While much has been published on how individual-level characteristics are associated with loneliness, less attention has been paid to possible historical, contextual effects (Elder, 1994; Elder, Johnson, & Crosnoe, 2003). According to the “principle of timing” (Elder et al., 2003), age at exposure to events differentially alters the life course. For instance, the availability of oral contraception starting in 1960, and legalized abortions in 1973, drastically altered the behavior, attitudes and intimate relationships among those who came of age during this time period (i.e., the so-called leading-edge Baby Boomers), but would have had very different effects on those already married. Similarly, increasing rates of employment among women were differentially experienced across birth cohorts. The increase in women’s participation in the labor force, from approximately 30% of the civilian labor force in 1948 to 47% in 2016, was a phenomenon experienced disproportionately by cohorts born later; among women 16-24 years old in 1950 (i.e., born approximately 1926-1934), only 44% were in the work force, while among women of the same age in 1980, 62% were in the work force (U.S. Department of Labor, 2019). Changing gender roles and intimate relationship histories and expectations, among other influences, exerted unique pressures on later relative to earlier cohorts, including delay of marriage and childbearing. These changes may have weakened partnership and family ties leading to greater loneliness in later life. On the other hand, as societal norms shifted, individuals born in later cohorts may have adapted and adopted new standards against which to evaluate their social satisfaction. A recent study found that the negative association between being married and loneliness weakens with age (i.e., widowhood can be considered normative in later life) and is also weaker among later relative to earlier born cohorts (Böger & Huxhold, 2018), perhaps due to singlehood becoming more accepted.
In the U.S., there have been many macro-level societal changes over the last 50 years in the domains of education, health, and social relationships—each of which is potentially relevant for loneliness at the individual level. However, individuals have the capacity to determine whether and how these influences affect their personal life course trajectories, including their loneliness (i.e., the “principle of agency”; Elder et al., 2003). Moreover, an individual’s responses to these changes may have differential effects on outcomes depending on the individual’s age or cohort (e.g., the less detrimental effect of singlehood on loneliness in more recent cohorts cited above). Below we review the major changes in these three domains and their potential implications for loneliness among specific cohorts.
Education.
Education is believed to protect against loneliness because more education imparts individuals with greater resourcefulness in developing and accessing social supports that alleviates stress and thereby indirectly reduces risk for loneliness (Bishop & Martin, 2007). The percent of the population with a bachelor’s degree (or higher) has risen from less than 10% in 1947 to over 25% in 2012 (Bauman, 2016), and for women, the rate of increase has accelerated with each successive 10-year cohort. High school graduation rates have also increased over this time period, from about 50% in 1950 to more than 70% in the 1990s (Snyder, 1993). Since higher levels of education are associated with lower levels of loneliness (Pinquart & Sorensen, 2003), we might expect loneliness to be lower among more recent cohorts.
Health.
Poor health is considered a predisposing condition for loneliness (Dykstra, 2009). Chronic conditions, functional limitations, cognitive decline, and sensory loss are examples of the types of health concerns that can affect people’s ability to remain socially active and to have good quality social interactions. In turn, social deficits increase risk for loneliness.
Self-rated health.
Lonelier individuals consistently report worse health than their less lonely peers (Pinquart & Sorensen, 2003). Recent evidence indicates a consistent pattern of cohort differences in self-rated health such that more recent cohorts report worse health than earlier cohorts. For instance, self-rated health was lower among Baby Boom women than among pre-boom women, and declined more rapidly with age over a three decade follow-up from 1975 to 2003 (Chen, Cohen, & Kasen, 2007). Similarly, a 1925-1942 birth cohort of older adults in the Berlin Aging Study rated their health more poorly than did an older cohort born 1907-1922 (König et al., 2018), despite objectively having better health as indicated by measures of cholesterol, HbA1c, physical activity, smoking, and diet. Recent evidence suggests that self-rated health is more highly related to emotional well-being in recent than earlier cohorts (Spuling, Wurm, Tesch-Römer, & Huxhold, 2015). Given that loneliness has an emotional dimension, we might expect age-related declines in self-rated health to be associated with greater increases in loneliness among younger cohorts.
Chronic health conditions.
Certain chronic health conditions have become more prevalent in recent decades. For instance, between 1988–1994 and 2005–2010, diabetes prevalence among those 65 and older increased from approximately 13% to 18% (Selvin, Parrinello, Sacks, & Coresh, 2014). Data from the Health and Retirement Study showed that the proportion of older adults reporting no chronic disease decreased from 13.1% in 1998 to 7.8% in 2008, whereas the proportion reporting one or more chronic disease increased from 86.9% to 92.2%, and the proportion with 4 or more chronic diseases increased from 11.7% to 17.4% (Hung, Ross, Boockvar, & Siu, 2011). Given the association between chronic health conditions and loneliness (Petitte, Mallow, Barnes, Petrone, Barr, & Theeke, 2015), a concomitant increase in loneliness may be evident in more recent cohorts.
Disability.
Functional limitations are associated with loneliness and contribute to increases in loneliness over time (Luo, Hawkley, Waite, & Cacioppo, 2012; Perissonotto, Cenzer, & Covinsky, 2012). Disability data typically rely on assessments of individuals’ capacity to perform the Activities of Daily Living (ADL; Katz, Ford, Moskowitz, Jackson, & Jaffe, 1963) and the Instrumental Activities of Daily Living (IADL; Lawton & Brody, 1969). Population-level data from the National Health Interview Survey indicate relative stability in the probability of ADL disability, and a decline in IADL disability, between 1982 and 2009 among individuals 70 years and older (period effect). However, ADL and IADL disability rates are increasing with successive cohorts net of aging and period effects (Lin, Beck, Finch, Hummer, & Master, 2012). This phenomenon might be expected to result in greater loneliness in more recent cohorts.
Sensory function.
Vision and hearing are critical to meaningful social interactions, and deficits in each sense have been associated with loneliness (Sung, Li, Blake, Betz, & Lin, 2016; Wallhagen, Strawbridge, Shema, Kurata, & Kaplan, 2001). The treatment of visual and hearing impairments has significantly improved over the last several decades, and vision and hearing problems have correspondingly decreased in prevalence (Bainbridge & Wallhagen, 2014). This may help to reduce loneliness among recent cohorts.
Cognitive health.
Data from community-based studies and national surveys provide evidence for a recent reduction in the prevalence of cognitive impairment (Rocca et al., 2011). Similarly, dementia incidence and prevalence have shown a declining age-specific risk in the U.S. (Langa, 2015; Langa et al., 2017) and in other countries. In Sweden, cognitive functioning improved for 70 year-olds in the 1930 birth cohort relative to the 1901-02 cohort (Sacuiu, Gustafson, Sjöberg, Guo, Östling, Johansson, & Skoog, 2010). Loneliness is known to be a risk factor for cognitive decline (Donovan, Wu, Rentz, Sperling, Marshall, & Glymour, 2017), and conversely, cognitive decline has been shown to predict loneliness (Zhong, Chen, Tu, & Conwell, 2016). Together these findings suggest that a reduction in loneliness may parallel the declining prevalence of cognitive impairment among more recent cohorts.
Social relationships.
The most frequent explanation for loneliness is a deficit in one’s social relationships. Indeed, the number and quality of people’s social relationships and activities play a prominent role in determining feelings of loneliness (Hawkley et al., 2008). Cohort differences in how people structure their social lives may therefore be reflected in cohort differences in loneliness.
Marital status.
The prevalence of divorce has increased among older adults, and this has been accompanied by an increased rate of remarriage together with a declining prevalence of widowhood (Brown & Lin, 2012). Being divorced is associated with greater loneliness than being married, but loneliness tends not to differ between married and re-married individuals. In fact, some research indicates that remarried older men are less lonely than first-married older men (Dykstra & De Jong Gierveld, 2004). The proportion of older adults who were married decreased from 1960–2010 (Cohn, Passel, Wang, & Livingston, 2011), while the proportion of older adults who were never married increased from 1986–2009 (Kreider & Ellis, 2011). Given the strong negative association between marriage and loneliness (Stack, 1998), this decline in the proportion of married older adults may have resulted in greater loneliness among more recent cohorts. On the other hand, a recent study found that partnership status has become less predictive of loneliness in more recent cohorts while satisfaction with singlehood has increased (Böger & Huxhold, 2018). In addition, although loneliness was significantly greater in divorcees than in first married adults across three cohorts of Dutch 54-65-year-old adults, “social” loneliness—a dimension of loneliness that refers to a lack of meaningful relationships—decreased steadily among divorcees from 1992 to 2002 and 2012 (Van Tilburg, Aartsen, & Van der Pas, 2015). These data suggest that the marriage advantage in lowering loneliness may be smaller in more recent cohorts, perhaps because recent cohorts are more likely to develop and nurture relationships that compensate for the lack of a spouse or partner.
Living arrangements.
Living alone and living with people other than a spouse or partner (e.g., children, other relatives) have each been associated with greater loneliness than living with a spouse (Russell, 2009). Historical data from 1967–2016 show that living alone became more prevalent in the U.S. among 50–64 year-olds, whereas among those over age 65, living with a spouse or unmarried partner became more prevalent and the proportion living with other relatives became less prevalent (Vespa, 2017). These changes suggest a lower risk for loneliness among older cohorts relative to younger ones.
Social network size.
Larger networks are associated with lower levels of loneliness, but the association is typically small to moderate in size (York Cornwell & Waite, 2009; Hawkley et al., 2008). Very little research has examined cohort differences in social network size. A recent exception is a study that found no differences in network size between 55–64 year-olds born in 1928-37 and a more recent cohort born 1938-47. The more recent birth cohort showed an increase in network size at follow-up about 2 years later that was not evident in the earlier cohort, but declined subsequently such that network size at the final follow-up about 9 years later again revealed no difference between cohorts (Suanet & Huxhold, 2018). Evidence to date thus provides little basis for positing cohort differences in loneliness.
Friends
Friendships are important in reducing feelings of loneliness (Pinquart & Sörensen, 2001; Stevens & Van Tilburg, 2000), particularly among unmarried older adults (Pinquart, 2003). Typically, the proportion of nonkin in personal social networks—of which friends constitute the majority—declines with age. In more recent cohorts of older adults (i.e., 1922 and earlier versus after 1922), the age-related decline is delayed or slower (Suanet, Van Tilburg, Broese van Groenou, 2013). Additional data from the Longitudinal Aging Study Amsterdam found that a younger cohort (born 1927–37) was more likely to have friends in their network than were older cohorts (born before 1927) (Stevens & Van Tilburg, 2011). Similar differences, if observed in the U.S., would tend to reduce loneliness among more recent cohorts.
Close family/relatives.
Family members and close relatives form the core of most older adults’ social networks, and their presence can also attenuate risk for loneliness. Sibling contact, for instance, has been associated with reduced loneliness in rural elderly adults (Dugan & Kivett, 1994), as has having children who show affection to and receive affection from their parents (Long & Martin, 2000). Family members are also critical in providing elder care and increasing older adults’ ability to age in place, factors that protect against loneliness (Prieto-Flores et al., 2011). Recent data indicate that kinlessness is prevalent at 6.6% of 50+ year-olds, and is expected to increase over the coming decades (Margolis & Verdery, 2017). Between the 1970’s and 2010, family size shrank and geographic distance from family members increased (Fischer, 2011). In combination, these data suggest that more recent cohorts may be at greater risk for loneliness than earlier cohorts of older adults.
In sum, there have been many changes in the distributions of factors known to be associated with loneliness, some of which suggest a possible increase in loneliness among more recent cohorts while others suggest a decrease. The objective of this study is to determine whether there is any evidence of overall changes in loneliness among more recent cohorts, and whether the associations between known predictors of loneliness differ among those born from 1948–65 as compared to those born earlier. Our results provide insight into the prognosis regarding loneliness among older adults in the U.S. over the coming decades, as well as regarding possible steps that might be taken to reduce loneliness among older adults.
METHODS
Study population
The National Social Life, Health and Aging Project (NSHAP) is an omnibus survey study (including physical and biomeasures) of health and aging, with a focus on intimate and other social relationships. Data were first collected in 2005–06 from a probability sample of 3,005 U.S. community-dwelling adults born 1920–47; this sample consisted of only one respondent per household and included oversamples of both African Americans and Hispanics, as well as of older men (O’Muircheartaigh, Eckman, & Smith, 2009). A second wave of data was collected in 2010–11 (n = 3,377) from all surviving respondents and their co-resident spouses or partners (if present, regardless of age) (O’Muircheartaigh, English, Pedlow, & Kwok, 2014). The third wave of data was collected in 2015–16 (n = 4,777) from all surviving previous respondents; in addition, a new sample of U.S. adults born 1948–1965 (including their co-resident spouses or partners, regardless of age) was added. Overall response rates were 75.5%, 74% and 71%, respectively. Attrition in Wave 2 was due to death (14%), moving to a nursing home (< 1%), health poor enough to preclude an interview (5%), or non-response (6%); corresponding percentages for Wave 3 were 18%, < 1%, 5% and 8%, respectively. Our analytic sample included all respondents born 1920–65 (i.e., spouses or partners born outside this range were excluded). Data were collected by the National Opinion Research Center (NORC). Interviews were conducted in the home by trained interviewers using Computer Assisted Personal Interviewing (CAPI) along with a leave-behind questionnaire (LBQ) that the respondents completed and mailed back. This study was approved by the Institutional Review Boards of NORC and the University of Chicago. All respondents provided written, informed consent.
To confirm our findings, we replicated our basic age, period and cohort analyses using comparable data collected in 2006–16 by the Health and Retirement Study (HRS). Like NSHAP, HRS is a U.S. national, longitudinal study of older adults. Although much of the study’s content is focused on retirement and financial decision-making, HRS also includes a rich set of health measures (including physical and biomeasures) and psychosocial measures (collected via an LBQ). As part of the latter, HRS added questions from the UCLA loneliness scale starting in 2002 which were later adopted by NSHAP (described below) (Hughes, Waite, Hawkley, & Cacioppo, 2004). Since 1998, HRS has maintained a sample representative of U.S. adults age 51 and older, replenishing the sample every six years with younger cohorts; Early Baby Boomers (born 1948–53) were added in 2004, Mid Baby Boomers (born 1954–59) in 2010 and Late Baby Boomers (born 1960–65) in 2016. Like NSHAP, both members of a couple are included for all cohorts. Since our objective was to replicate the NSHAP results, we used a subsample that closely matched the NSHAP sample: respondents born 1920–65 who were 50–95 at the time of data collection. The HRS (Health and Retirement Study) is sponsored by the National Institute on Aging (grant number NIA U01AG009740) and is conducted by the University of Michigan. This analysis uses Early Release data from the Health and Retirement Study (HRS 2016 Core). These data have not been cleaned and may contain errors that will be corrected in the Final Public Release version of the dataset.
Measures
Loneliness.
A validated 3-item version of the UCLA Loneliness Scale (Hughes et al., 2004) was used in both NSHAP and HRS (“How often do you feel that you lack companionship,” “… left out” and “… isolated from others”), with the questions administered in a Leave Behind Questionnaire (LBQ). The NSHAP LBQ was completed and returned by 84% of the sample in 2005–06, 87% of the sample in 2010–11 and 85% of sample in 2015–16 (the HRS LBQ had slightly lower response rates ranging from 73–88% during 2006–2014; Smith, Sonnega, & Weir, 2017). Individual characteristics associated with non-response to the NSHAP LBQ are discussed in Hawkley et al. (2014). In NSHAP 2005–06 and HRS (all years), the response categories were “Hardly ever (or never),” “Some of the time” or “Often”; these were changed in NSHAP starting in 2010–11 to “Never,” “Hardly ever,” “Some of the time” or “Often.” For consistency across time and between studies, the NSHAP responses from 2010–11 and 2015–16 were recoded to combine “Never” and “Hardly ever” into a single category. These three items, each coded 1–3, were summed to yield a loneliness score ranging from 3–9. Cronbach’s alpha was 0.80 in Wave 1 and 0.79 in Wave 2 (Hawkley & Kocherginsky, 2018).
Demographics.
Age at the time of the interview was calculated from the respondent-reported date of birth. Gender was coded by the interviewer, with clarification by the respondent (if necessary). Race/ethnicity was determined based on the following two questions: “Do you consider yourself primarily white or Caucasian, black or African American, American Indian, Asian, or something else?” and “Do you consider yourself Hispanic or Latino?”; for these analyses all who reported themselves to be black or African American were included in this group (regardless of their response to the second question). Self-reported educational attainment was categorized as: less than high school, high school graduate or GED, some college or associates degree or vocational certificate, and bachelor’s degree or higher.
Health characteristics.
Self-reported physical health, vision, and hearing were each rated on a scale of “Poor” (1) to “Excellent” (5); the latter two items were not asked in 2015–16. Respondents were asked whether they had been told by a doctor that they had the following conditions, and these were summed to construct a comorbidity score (Vasilopoulos, Kotwal, Huisingh-Scheetz, Waite, McClintock, & Dale, 2014) with a possible range of 0–16 (points assigned in parentheses): congestive heart failure (1), heart attack (1), coronary procedure (1), stroke (1), diabetes (1), arthritis (1), chronic pulmonary disease (1), dementia (1), non-metastatic cancer excluding skin-cancer (2), and metastatic cancer other than skin cancer (6). Six Activities of Daily Living (ADLs) were measured (walking across room, dressing, bathing, eating, getting in and out of bed, toileting), and the total number for which the respondent reported having at least “some difficulty” was calculated. A survey-adapted version of the Montreal Cognitive Assessment (MoCA-SA) was introduced starting in 2010–11 with ranges from 0–20 (higher scores indicate better cognitive function) (Dale et al., 2018; Kotwal et al., 2015).
Social characteristics.
Network size (with a possible range of 0–5) was calculated based on the number of alters named in response to a question asking the respondent to identify “the people with whom you most often discussed things that were important to you” over the past year (Cornwell, Schumm, Laumann, & Graber, 2009). Three distinct living arrangements were identified based on reported marital status and a roster of household members: living with a spouse or cohabiting partner, living alone, or living with at least one other person not including a spouse or partner. Questions were asked about the number of family members or relatives the respondent “feels close to” and the number of friends he or she has using the following response categories: “None” (0), “One” (1), “2–3” (2), “4–9” (3), “10–20” (4) and “More than 20” (5).
Statistical analyses
Three sets of analyses were performed, each to answer a different question. First, we used NSHAP data to generate population estimates of the distributions of loneliness and of the covariates in 2005–06 and 2015–16, in order to determine whether (and how) these have changed during the decade. Since the NSHAP sample in 2005–06 was representative of the population aged 57–85, we also restricted the 2015–16 sample to this age range, for comparability. Population estimates were obtained by using the weights distributed with the dataset to adjust for differences in the probability of selection and non-response. Standard errors for the differences between timepoints were obtained using the clustered version of the sandwich (i.e., robust) variance estimator (Angrist & Pischke, 2009) to account for within-respondent correlation among respondents interviewed at both timepoints, and Wald tests were constructed based on these standard errors.
Second, we examined the associations between loneliness and age, birth year (i.e., cohort) and survey year (i.e., period) using all observations for which the respondent was 50 or older at the time of data collection. Effects of age and birth year were modeled using restricted cubic splines with 4 degrees of freedom (i.e., 3 knots), orthogonalized using the Gram-Schmidt procedure to facilitate interpretation. Mean loneliness was first plotted as a function of age separately by gender, together with 95% pointwise confidence bands. A mixed-effects ordinal logit model (Skrondal & Rabe-Hesketh, 2004) was then used to estimate simultaneously the effects of age, birth year and survey year, including a random intercept to account for within-respondent correlation over time. As above, survey weights were used as well as the cluster robust variance estimator to ensure accurate standard errors even if the random effects model does not capture the true correlation structure. Due to the linear dependency among age, period and cohort (i.e., age = period - cohort), it is not possible to include linear terms for age, survey year and birth year in the same model (Holford, 2006). Thus, we fit two models: (1) a model excluding the linear term for birth year and modeling survey year using individual contrasts relative to baseline, and (2) a model including the linear term for birth year but excluding a linear effect for survey year (for NSHAP, a single contrast comparing 2010–11 to 2005–06 and 2015–16, and for HRS, the same restricted cubic splines as for age and birth year but excluding the linear component). These models permit us to examine the linear trends for two of the three variables under the assumption that the linear trend for the third is negligible, while the non-linear components for all three variables are interpretable regardless. This analysis was performed first using the NSHAP dataset and then replicated using the HRS dataset. Results are presented together by plotting the linear predictor versus each covariate together with 95% confidence bands.
Finally, we used mixed-effects ordinal logit models to examine the associations between the covariates and loneliness. One model used the entire NSHAP dataset for maximum precision; age was modeled using both linear and quadratic effects (based on results from the analyses above), and birth year was excluded. We then fit cross-sectional ordinal logistic regression models separately to two groups: those born in 1920–47 using data collected in 2010–11, and those born in 1948–65 (comprising the Baby Boom cohorts) using data collected in 2015–16. The samples for these two models are independent (i.e., different respondents and a different sampling frame), and so one may be viewed as a replication of the other. The objective was to compare the associations between loneliness and the covariates among the Baby Boomers relative to earlier cohorts; data from 2010–11 were used for those born 1920–47 to maximize sample size. In both cases, survey weights were used together with the cluster robust variance estimator (note that for the cross-sectional models, each respondent is included in only a single model). Results from the cross-sectional models are presented graphically using a forest plot to facilitate comparison of effect sizes.
RESULTS
During the 10-year period from 2005–06 to 2015–16, we estimate that the mean loneliness score among U.S. community-dwelling adults aged 57–85 remained nearly unchanged from 4.0 to 4.1 (95% CI for change = [−0.002, 0.2]; p = 0.055), and the proportion with a loneliness score greater than four increased only slightly from 0.28 to 0.31 (95% CI for change = [0.002, 0.06]; p = 0.035) (Table 1). At the same time, the population distributions of several individual characteristics previously reported to be associated with loneliness exhibited modest, or in some cases even moderate, changes. For example, the proportion who did not graduate from high school decreased from 0.19 to 0.11 while the proportion with at least some college increased from 0.55 to 0.66. Improvements in objective health measures were also observed, with the proportion exceeding a score of one on the comorbidity index decreasing from 0.41 to 0.28, and the proportion reporting at least one ADL decreasing from 0.25 to 0.22; despite these however, there was little evidence of an increase in self-rated health. The proportion living alone declined slightly (0.24 to 0.21), matched by a similar increase in the proportion living with others (0.09 to 0.13). Finally, although there was a modest increase in network size, both the mean number of close family members and the mean number of friends decreased.
Table 1.
Estimated means (or proportions) of loneliness and selected covariates for the U.S. community-dwelling population aged 57–85 in 2005–06 and 2015–16, based on NSHAP
| Variable | |||
|---|---|---|---|
| 2005–06 | 2015–16 | Difference1 | |
|
|
|||
| Loneliness (3–9) | |||
| Mean (SD) | 4.0 (1.4) | 4.1 (1.4) | 0.1 (−0.002, 0.2) |
| Proportion > 4 | 0.28 | 0.31 | 0.03 (0.002, 0.06) * |
| Demographics | |||
| Age in years (SD) | 68.0 (7.7) | 66.8 (7.4) | −1.3 (−1.7, −0.8) ‡ |
| Proportion women | 0.52 | 0.52 | 0.01 (−0.01, 0.03) |
| Race/ethnicity (proportions) | |||
| Black/African American | 0.10 | 0.11 | 0.01 (0.001, 0.03) * |
| Hispanic | 0.07 | 0.07 | 0.01 (−0.005, 0.02) |
| Education (proportions) | |||
| < HS | 0.19 | 0.11 | −0.08 (−0.09, −0.06) ‡ |
| Some college | 0.30 | 0.37 | 0.07 (0.05, 0.09) ‡ |
| Bachelors or more | 0.25 | 0.29 | 0.05 (0.02, 0.07) ‡ |
| Health characteristics | |||
| Self-rated health (1–5) | |||
| Mean (SD) | 3.3 (1.1) | 3.3 (1.0) | 0.02 (−0.04, 0.1) |
| Proportion good or better | 0.75 | 0.77 | 0.02 (−0.001, 0.05) |
| Comorbidities (0–11) | |||
| Mean (SD) | 1.5 (1.4) | 1.1 (1.3) | −0.4 (−0.5, −0.3) ‡ |
| Proportion > 1 | 0.41 | 0.28 | −0.13 (−0.16, −0.10) ‡ |
| ADLs (0–6) | |||
| Mean (SD) | 0.6 (1.3) | 0.5 (1.2) | −0.1 (−0.2, −0.03) † |
| Proportion > 0 | 0.25 | 0.22 | −0.03 (−0.05, −0.003) * |
| Social characteristics | |||
| Living arrangements (proportions) | |||
| Living alone | 0.24 | 0.21 | −0.02 (−0.05, −0.003) * |
| Living with others2 | 0.09 | 0.13 | 0.04 (0.02, 0.06) ‡ |
| Network size, 0–5 (SD) | 3.5 (1.5) | 3.8 (1.4) | 0.4 (0.3, 0.4) ‡ |
| Number of close family members, 0–5 (SD) | 2.9 (1.0) | 2.5 (1.0) | −0.4 (−0.5, −0.4) ‡ |
| Number of friends, 0–5 (SD) | 3.3 (1.3) | 3.1 (1.1) | −0.2 (−0.2, −0.1) ‡ |
| Number of respondents3 | 2,385 | 2,829 | |
p < 0.05;
p < 0.01;
p < 0.001.
Estimated change from 2005–05 to 2015–16 (95% CI)
Excludes spouse or cohabiting partner.
The loneliness items were asked in the leave-behind, which was returned by 2,524 respondents (84%) aged 57–85 in 2005–06 and 3,010 respondents (88%) aged 57–85 in 2015–16; item non-response accounts for the remaining missing cases.
Age, period and cohort differences
Figure 1 shows population estimates of mean loneliness for NSHAP (2015–16) and HRS (2014) plotted by age, separately for men and women. Overall, mean loneliness for women is slightly higher than that for men, and decreases with age for both until just after 75, after which it increases. Mean loneliness is consistently higher for HRS than for NSHAP, likely due to the fact that HRS presented the “Often” response first while NHSAP presented it last. Such response order effects are described by Krosnick and Alwin (1987).
Figure 1.
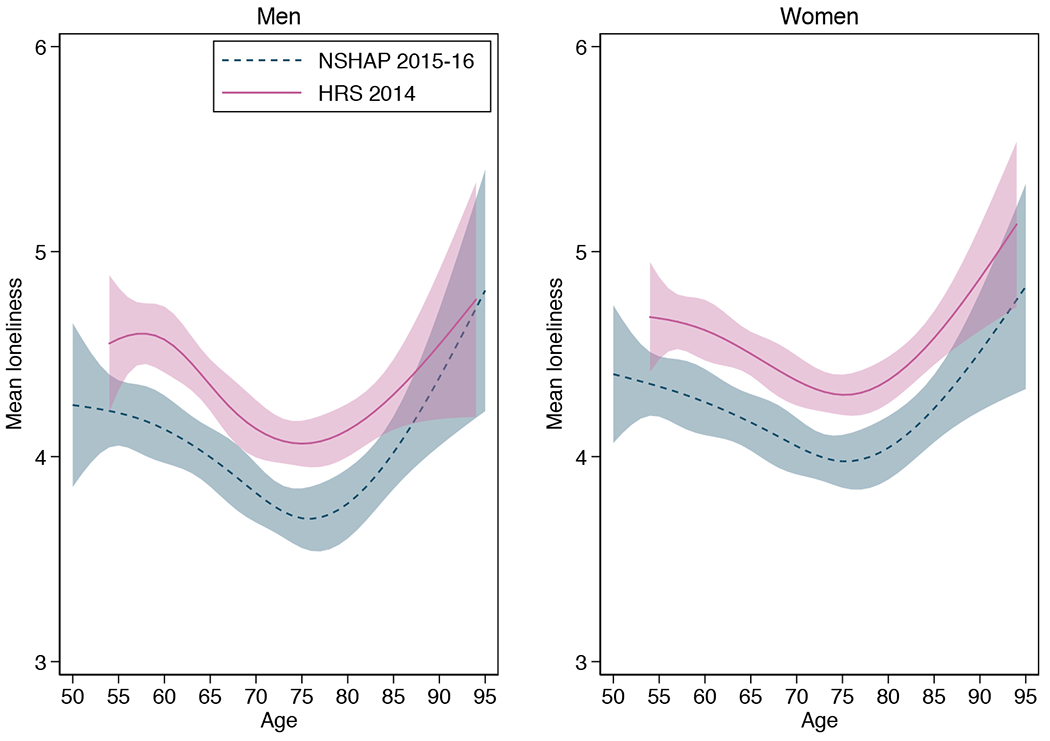
Mean loneliness as a function of age, estimated using restricted cubic splines separately by gender (shaded regions indicate 95% confidence bands).
Figure 2 shows estimated differences in loneliness by age (A), birth year (B) and survey year (C) based on a mixed-effects ordinal logit model including a linear term for age but excluding a linear term for birth year (n = 8,763 observations from 5,293 respondents for NSHAP; 38,626 observations from 18,646 respondents for HRS). Plotted on the y-axis is the value of the linear predictor (xb) reflecting the change on the logit scale in the likelihood of exceeding a loneliness cutpoint associated with the covariate. Consistent with the pattern in Figure 1, loneliness decreases with age through the early 70s and then increases again at older ages (p = 0.003 for joint test of 4 age splines). The differences associated with birth year are smaller. Although the non-linear terms are not statistically significant for NSHAP (p = 0.590 for 3 d.f. test of non-linear terms), the additional precision provided by the larger HRS sample reveals slightly lower loneliness among those born in the early 1940s followed by slightly higher loneliness among those born in the early 1950s (p = 0.020 for 3 d.f. test of non-linear terms). While the NSHAP data show an increase in loneliness in 2010–11 relative to 2005–06 and 2015–16 (p = 0.003 for 2 d.f. test), the HRS data suggest very small decreases in loneliness in 2010 and perhaps also 2014 (p = 0.028 for 5 d.f. test). Finally, with the linear term for survey year removed, a linear term for birth year was not statistically significant for either dataset; the estimated odds ratios were 1.15 (95% CI = [0.92, 1.42]) for NSHAP and 1.04 (95% CI = [0.94, 1.14]) for HRS, both for a 10 year increase in birth year. Thus, with the HRS dataset we can rule out even small linear increases in loneliness with increasing birth year. The estimated curves for both age (2D) and birth year (2E) are similar to those for the first model.
Figure 2.
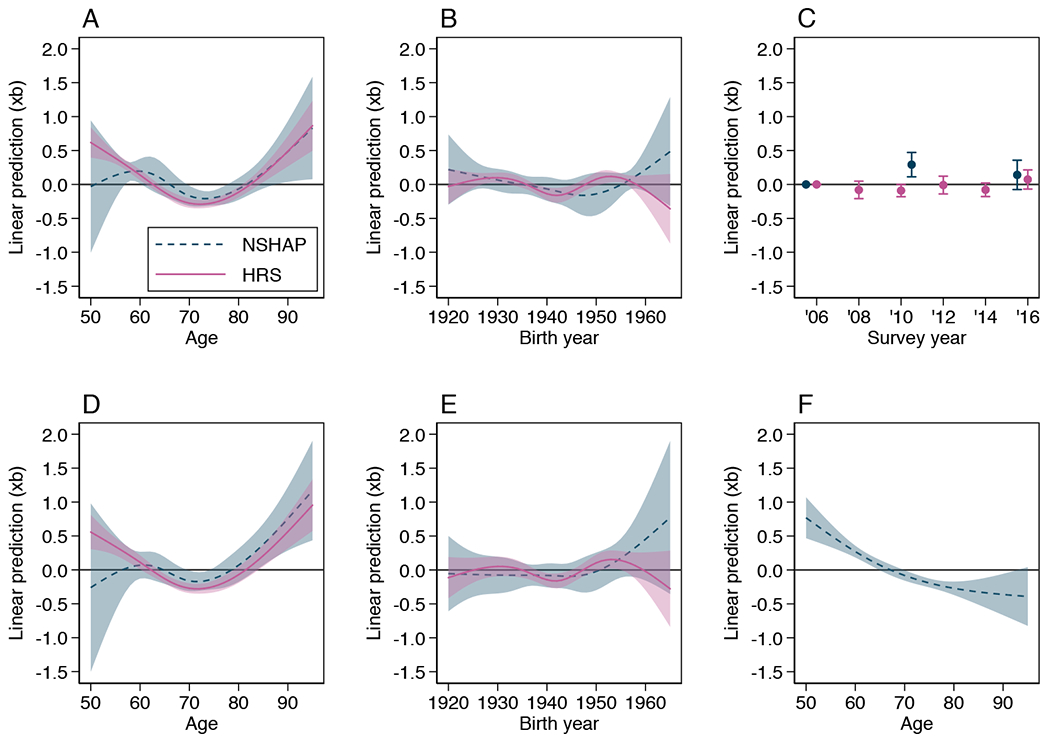
Estimated effects of age (A), birth year (B) and survey year (C) on loneliness from a mixed-effects ordinal logit model excluding the linear effect for birth year, together with 95% confidence bands; effects of age (D) and birth year (E) from a model including the linear effect of birth year but excluding the linear effect for survey year. Estimated quadratic effect of age (F) from a model fit to the NSHAP data including demographic, health and social covariates (Table 2, Model 4). Plotted is the value of the linear predictor (xb) reflecting the change on the logit scale in the likelihood of exceeding a loneliness cutpoint associated with the covariate.
Correlates of loneliness
Table 2 shows results from a series of mixed-effects ordinal logit models fit to the NSHAP data including demographic, health and social characteristics as covariates. In Model 1, age has a pronounced U-shaped effect with loneliness lowest at 72 years old and increasing thereafter. However, the increase at older ages disappears when adjusting for the other covariates (Model 4, Figure 2F), especially the social characteristics. Women have higher loneliness in Model 1 (OR = 1.4, 95% CI = [1.2, 1.7]), however this effect is reduced by more than half when adjusting for differences in social characteristics (Model 3). Similarly, African Americans have higher loneliness than Whites in Model 1 (OR = 2.0, 95% CI = [1.5, 2.6]), but this difference is also reduced by more than half in Model 4. In contrast, Hispanics have lower loneliness than Whites and this difference increases when adjusting for health and social characteristics, yielding an adjusted difference approximately equal in magnitude to the adjusted difference between African Americans and Whites. Finally, loneliness decreases steadily with increasing education (OR for bachelor’s versus HS = 0.6, 95% CI = [0.5, 0.8]), an effect that is also reduced by more than half when adjusting for health and social characteristics (the overall effect of education would still be considered statistically significant, however, with p = 0.031 for the linear trend in Model 4).
Table 2.
Mixed-effects ordinal logistic models predicting loneliness from demographic, health and social characteristics among the U.S. community-dwelling population born 1920–65 (estimated coefficients and 95% CIs), based on NSHAP
| Covariates | ||||
|---|---|---|---|---|
| Model 1 | Model 2 | Model 3 | Model 4 | |
|
|
||||
| Demographics | ||||
| Age (decades from 70) | −0.07 (−0.16, 0.01) | −0.12 (−0.21, −0.03) † | −0.23 (−0.32, −0.14) ‡ | −0.27 (−0.36, −0.19) ‡ |
| Age squared | 0.20 (0.12, 0.28) ‡ | 0.16 (0.09, 0.24) ‡ | 0.11 (0.03, 0.19) † | 0.08 (−0.0002, 0.16) |
| Women (vs. men) | 0.34 (0.16, 0.53) ‡ | 0.37 (0.19, 0.55) ‡ | 0.13 (−0.06, 0.32) | 0.16 (−0.02, 0.35) |
| Race/ethnicity (vs. white) | ||||
| Black/African American | 0.67 (0.40, 0.94) ‡ | 0.55 (0.28, 0.82) ‡ | 0.37 (0.10, 0.65) † | 0.29 (0.01, 0.56) * |
| Hispanic | −0.12 (−0.44, 0.19) | −0.20 (−0.51, 0.11) | −0.29 (−0.60, 0.02) | −0.35 (−0.66, −0.04) * |
| Other | 0.23 (−0.31, 0.77) | 0.21 (−0.31, 0.72) | 0.14 (−0.38, 0.66) | 0.13 (−0.38, 0.63) |
| Education (vs. HS) | ||||
| < HS | 0.46 (0.14, 0.79) † | 0.27 (−0.05, 0.59) | 0.40 (0.08, 0.71) * | 0.23 (−0.08, 0.54) |
| Some college | −0.19 (−0.44, 0.05) | −0.13 (−0.37, 0.11) | −0.12 (−0.37, 0.12) | −0.06 (−0.30, 0.18) |
| Bachelors or more | −0.49 (−0.75, −0.22) ‡ | −0.27 (−0.53, −0.004) * | −0.35 (−0.62, −0.08) * | −0.15 (−0.42, 0.12) |
| Health characteristics | ||||
| Self-rated health (1–5) | −0.36 (−0.45, −0.27) ‡ | −0.35 (−0.43, −0.26) ‡ | ||
| Comorbidities (0-11) | 0.01 (−0.05, 0.06) | −0.0003 (−0.06, 0.06) | ||
| ADLs (0-6) | 0.18 (0.11, 0.24) ‡ | 0.16 (0.09, 0.22) ‡ | ||
| Social characteristics | ||||
| Living arrangements (vs. married/cohabiting1) | ||||
| Living alone | 1.65 (1.44, 1.86) ‡ | 1.63 (1.42, 1.84) ‡ | ||
| Living with others | 1.30 (1.02, 1.58) ‡ | 1.23 (0.96, 1.50) ‡ | ||
| Network size (0–5) | 0.02 (−0.04, 0.08) | 0.03 (−0.04, 0.09) | ||
| Number of close family (0–5) | −0.22 (−0.31, −0.13) ‡ | −0.22 (−0.31, −0.14) ‡ | ||
| Number of friends (0–5) | −0.31 (−0.38, −0.24) ‡ | −0.28 (−0.35, −0.21) ‡ | ||
| Survey year | ||||
| 2010–11 vs. 2005–06 | 0.29 (0.12, 0.46) † | 0.27 (0.11, 0.44) † | 0.38 (0.20, 0.55) ‡ | 0.36 (0.19, 0.54) ‡ |
| 2015–16 vs. 2010–11 | −0.18 (−0.34, −0.03) * | −0.18 (−0.33, −0.03) * | −0.37 (−0.53, −0.21) ‡ | −0.36 (−0.52, −0.21) ‡ |
| Var(u)2 | 4.3 (3.7, 5.1) | 4.0 (3.4, 4.7) | 3.9 (3.3, 4.6) | 3.7 (3.1, 4.3) |
| Number of respondents | 5,282 | 5,276 | 5,212 | 5,205 |
| Number of observations | 8,739 | 8,721 | 8,543 | 8,525 |
p < 0.05;
p < 0.01;
p < 0.001
Excludes those who are married but do not live with their spouse.
Estimated variance of random effect.
Higher self-rated health is associated with lower loneliness, with an estimated odds ratio of 0.71 for an increase of one category (95% CI = [0.65, 0.77]) (Model 4). Similarly, each additional ADL difficulty is associated with an increase in loneliness (OR = 1.2, 95% CI = [1.1, 1.2]). These estimates are unaffected by adjusting for the social characteristics (Model 2 versus Model 4). The number of comorbidities was not associated with loneliness.
As expected, living arrangements are strongly associated with loneliness. In Model 4, the odds ratio for living alone versus living with a spouse or partner is 5.1 (95% CI = [4.1, 6.3], while that for living with others (versus a spouse/partner) is 3.4 (95% CI = [2.6, 4.5])); the p-value for comparing living alone versus living with others is 0.004. In addition, increases in the number of close family members and friends are both associated with a decrease in loneliness; each has an estimated odds ratio of 0.8 for an increase of one category (95% CI = [0.7, 0.9] and [0.7, 0.8], respectively). In contrast, the number of network alters named was not associated with loneliness.
Figure 3 plots estimated coefficients from two cross-sectional models: one fit to NSHAP respondents born 1920–47 using data collected in 2010–11 (respondents aged 62–91), and another fit to NSHAP respondents born 1948–1965 using data collected in 2015–16 (respondents aged 49–68) (estimates are provided in Supplementary Table S1). We chose data from different years to conduct the comparison because we gave priority to using the largest samples and thus maximizing our ability to detect cohort differences in associations. The initial sample in this comparison, a group assessed in 2010–11, was larger than the group assessed in 2015–16 due to mortality. Thus, this design provides the greatest power to detect what are essentially interaction effects. Even if there had been small changes in overall loneliness during the 5 intervening years, this would not affect the validity of comparisons of the associations between covariates and loneliness between the two groups. Both include the covariates in Model 4 of Table 2, together with the MoCA-SA measuring cognitive function (added in 2010–11) and self-rated vision and hearing (not asked in 2015–16). There is less evidence of an age effect in these models (i.e., p = 0.079 and 0.070 for the linear terms and p = 0.804 and 0.173 for the quadratic terms, respectively), which unlike Model 4 each utilize a restricted age range and are not longitudinal. As with the previous models, better self-rated health is associated with a reduction in loneliness in both groups, while the evidence for an effect of ADLs is somewhat greater in the older group. In addition, poor vision is associated with greater loneliness among the older cohort (OR = 1.13; 95% CI = [1.02, 1.25]), and cognitive function is not significantly associated with loneliness in either.
Figure 3.
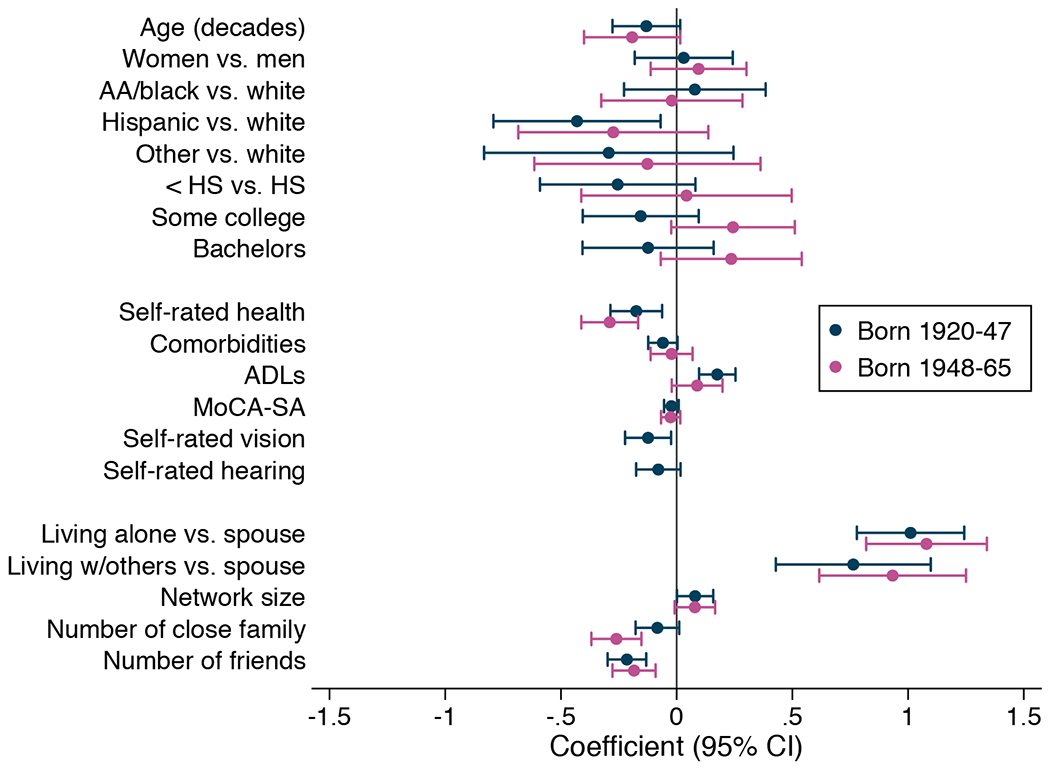
Estimated coefficients and 95% CIs from two cross-sectional ordinal logit models: one fit to NSHAP respondents born 1920–47 using data collected in 2010–11, and another fit to NSHAP respondents born 1948–1965 using data collected in 2015–16.
Both living arrangements and the number of close family members and friends have similar associations with loneliness to those observed in Table 2 (Model 4), and although there are some differences in the magnitude of the coefficients between cohorts, only that for number of close family would be considered statistically significant, with the effect observed to be larger among the younger cohort (p = 0.015). Surprisingly, an increase in the number of network alters is associated with a modest increase in loneliness in both cohorts, though given that we are already adjusting for the number of family and friends, it is possible that this reflects a tendency among lonely respondents to be more willing to prolong the interview by naming more individuals on the network roster.
DISCUSSION
Our results indicate that loneliness among older U.S. adults did not increase during the decade from 2005–2016. Moreover, we find no evidence that younger cohorts (e.g., those born 1948–65) report greater loneliness than older cohorts, adjusting for age. While the larger HRS dataset suggests small differences associated with cohort, these oscillate and there is no overall (i.e., linear) change in loneliness with birth year from 1920–65. This is consistent with a review of prior research which found no evidence of increased loneliness over the past few decades (Dykstra, 2009), and with a recent study of Dutch adults 65 years and older that found no evidence of increased loneliness between 2005 and 2010 (Honigh-de Vlaming, Haveman-Nies, Groeniger, De Groot, & Van ‘t Veer, 2014).
The NSHAP data do indicate an increase in loneliness in 2010–11 relative to 2005–06, a difference that persisted after adjusting for the demographic, health, and social covariates. Prior research has shown that depressive symptoms, which are closely related to loneliness, increased during the Great Recession of 2008–10 (McInerney, Mellor, & Nicholas, 2013), and because the 2005–10 interval in NSHAP straddles the Great Recession, it is possible that the increase in loneliness in 2010–11 is at least partly attributable to this significant societal exposure. However, this increase was not replicated in the HRS dataset, which casts doubt on this explanation. Alternatively, the temporary 2010–11 increase in NSHAP may have been due to aspects of the survey instrument and/or interview protocol that were unique to that wave.
Overall, age-related differences in loneliness followed an expected pattern in which loneliness decreases after age 50 until about 75, after which it begins to increase (Pinquart & Sörensen, 2001). Also consistent with prior research is the fact that the increase in loneliness after 75 may be accounted for by decreases in health and the loss of a spouse/partner and other social relationships (Luhmann & Hawkley, 2016; Pinquart & Sörensen, 2001). When adjusting for these factors, loneliness is estimated to continue declining into oldest old age (though at a slower rate, Figure 2F).
Our results are consistent with prior research (Petersen et al., 2015) showing that living alone is a substantial risk factor for loneliness, and living with persons other than a spouse or partner mitigates this only slightly. Moreover, there was no evidence that this effect differed between the Baby Boomers and earlier cohorts. Eloranta et al. (2015) reported similar results for Finnish cohorts born in 1920 and 1940. However, differences in marital trajectories may moderate the association between being married and loneliness (Dykstra & De Jong Gierveld, 2004; Pinquart, 2003), and the Baby Boom cohorts are known to exhibit a wider range and number of marital transitions than earlier cohorts. Future work using the NSHAP and HRS datasets could be done to investigate this possibility, since both include detailed information on marital history.
In addition to living arrangements, our results also provide strong evidence that having more close family members and friends is associated with less loneliness, with the number of close family members having a stronger effect among the Baby Boomers than among previous cohorts. Better self-rated health, as well as fewer ADLs and better vision, were also all associated with less loneliness. These effects of living arrangements and of social and health characteristics account for much of the demographic differences in loneliness. For example, women are more likely to be widowed (and therefore to be living without a spouse) at older ages. Similarly, African Americans exhibit disparities on several health measures relative to whites; they are also less likely than whites to live with a spouse or partner, especially African American women (Raley, Sweeney, & Wondra, 2016). Finally, low education is associated with poor health, whereas high education is associated not only with good health but also with more supportive social environments. In contrast, adjusting for social and health characteristics increases the difference in loneliness for Hispanics, among whom loneliness is lower than for whites or African Americans.
The National Health and Aging Trends Study In 2011 characterized 24% of community-dwelling adults over the age of 65 as socially isolated based on living arrangements, core social network size, religious service attendance, and social participation (Cudjoe et al., 2018). Although heavy social media use has been associated with elevated loneliness in younger adults (Primack et al., 2017), its use in older adults may protect against loneliness when used as older adults typically use social media—to maintain contact with and obtain support from family members (Yu, McCammon, Ellison, & Langa, 2016). This may become more important among Baby Boomers due to their greater familiarity with digital technology relative to earlier cohorts. More work is required to determine and monitor the effect of social media use on loneliness among the Baby Boomers as they continue to age.
Our failure to find an increase in loneliness among more recent cohorts is perhaps not surprising, given the definition of loneliness as a perceived mismatch between desired and actual social relationships. Individuals may accommodate changes in the standards and opportunities for social relationships by modifying their expectations, although societal changes are most likely to affect individuals’ expectations if experienced during their formative years through young adulthood (Elder, 1998). Birth cohorts navigate societal changes as a group and share common expectations that increase the likelihood that individuals will find mutual satisfaction in their social relationships. In addition, lost opportunities for social connection may be compensated by pursuing new opportunities. For example, although increased individualism, as suggested by decreased social engagement (e.g., fewer group affiliations, less volunteering, less church attendance), may reduce certain social opportunities for Baby Boomers, this change has been accompanied by more and improved transportation and communication options thereby creating opportunities to accumulate and maintain a more diverse social network that may increase the likelihood of finding social satisfaction. Such changes in people’s strategies for avoiding loneliness and in their effectiveness are a topic for future research.
Finally, we emphasize that our findings are limited to adults over the age of 50. Potential increases in loneliness among young adults is an entirely different question—one in which there is heightened interest due to the increased use of digital communication among this group (Nowland, Necka, & Cacioppo, 2018). Interestingly, although indicators of objective isolation (e.g., smaller social networks, fewer friends) increased from 1978–2009 among American college students, loneliness among this group declined over this same period (Clark, Loxton, & Tobin, 2014), highlighting the distinction between objective and subjective isolation (i.e., loneliness). Still, young adults are at higher risk of loneliness than most older age groups (Luhmann & Hawkley, 2016), and extending our work here to younger ages would therefore be valuable.
Conclusion
In sum, we find no evidence that older adults have become lonelier over the past decade, or that Baby Boomers are lonelier than previous cohorts. However, mean loneliness increases beyond age 75, and therefore the number of older adults who are lonely may be expected to increase once the Baby Boomers reach their late 70s and 80s. At the same time, our results suggest that older adults who remain in good health and maintain social relationships with a spouse, family members and friends can avoid the increase in loneliness during the oldest ages. This presents a possible intervention target for policymakers. Efforts to ensure that older adults maintain meaningful social connections in later life in the face of increasing disability could encompass technological solutions (e.g., affordable and reliable internet access, along with age-friendly technological interfaces to facilitate remote video calls, for example), improvements in transportation options and affordability for disabled older adults whose social relationships are limited largely by poor access, and increased access to and affordability of programs designed to help older adults maintain mobility as well as meaningful engagement in the community.
Supplementary Material
Acknowledgments
The National Social Life, Health and Aging Project (PI: Linda Waite) is supported by the National Institute on Aging and the National Institutes of Health (R01AG021487; R37AG030481; R01AG033903; R01AG043538; R01AG048511). The content is solely the responsibility of the authors and does not necessarily represent the official views of the National Institutes of Health.
Footnotes
This study was preregistered with the Open Science Framework, https://osf.io/pwfkm/. The NSHAP data are available from the National Archive of Computerized Data on Aging (NACDA) at https://www.icpsr.umich.edu/icpsrweb/NACDA/series/706; the HRS data are available from their website at http://hrsonline.isr.umich.edu/index.php?p=avail. Code used to perform the analyses is available on GitHub at https://github.com/lhawkley/us-loneliness-apc
Contributor Information
Louise C. Hawkley, Academic Research Centers, NORC at the University of Chicago
Kristen Wroblewski, Department of Public Health Sciences, Biological Sciences Division, University of Chicago.
Till Kaiser, Department of Psychology, Ruhr University Bochum.
Maike Luhmann, Department of Psychology, Ruhr University Bochum.
L. Philip Schumm, Department of Public Health Sciences, University of Chicago.
REFERENCES
- Angrist JD, & Pischke J-S (2009). Mostly Harmless Econometrics: An Empiricist’s Companion. Princeton, NJ: Princeton University Press. [Google Scholar]
- Bainbridge KE, & Wallhagen MI (2014). Hearing loss in an aging American population: Extent, impact, and management. Annual Review of Public Health, 35, 139–152. [DOI] [PubMed] [Google Scholar]
- Banks J, Berkman L, & Smith JP, with Avendano M, & Glymour M (2010). Do cross-country variations in social integration and social interactions explain differences in life expectancy in industrialized countries? In Crimmins EM, Preston SH, & Cohen B (Eds.), International Differences in Mortality at Ages: Dimensions and Sources (pp. 217–256). Washington, DC: The National Academies Press. 10.17226/12945. [DOI] [Google Scholar]
- Bauman K (2016). College completion by cohort, age and gender, 1967 to 2015. Working Paper 2016.04. US Census Bureau: Social, Housing and Economic Statistics Division. Retrieved from https://www.census.gov/content/dam/Census/library/working-papers/2016/demo/SEHSD-WP2016-04.pdf [Google Scholar]
- Bishop AJ, & Martin P (2007). The indirect influence of educational attainment on loneliness among unmarried older adults. Educational Gerontology, 33, 897–917. [Google Scholar]
- Böger A, & Huxhold L (2018). The changing relationship between partnership status and loneliness: Effects related to aging and to historical time. Journals of Gerontology: Psychological and Social Sciences. In press. [DOI] [PubMed] [Google Scholar]
- Brown SL, & Lin I-F (2012). The gray divorce revolution: Rising divorce among middle-aged and older adults, 1990–2010. Journals of Gerontology: Psychological Sciences & Social Sciences, 67, 731–741. [DOI] [PMC free article] [PubMed] [Google Scholar]
- Chen H, Cohen P, & Kasen S (2007). Cohort differences in self-rated health: Evidence from a three-decade, community-based, longitudinal study of women. American Journal of Epidemiology, 166, 439–446. [DOI] [PubMed] [Google Scholar]
- Cohen-Mansfield J, Hazan H, Lerman Y, & Shalom V (2016). Correlates and predictors of loneliness in older adults: A review of quantitative results informed by qualitative insights. International Psychogeriatrics, 28, 557–576. [DOI] [PubMed] [Google Scholar]
- Cohn D, Passel JS, Wang W, Livingston G (2011). Barely half of U.S. adults are married – A record low. Pew Social & Demographic Trends. Retrieved from http://assets.pewresearch.org/wp-content/uploads/sites/3/2011/12/Marriage-Decline.pdf. [Google Scholar]
- Cornwell B, Schumm LP, Laumann EO, & Graber J (2009). Social networks in the NSHAP Study: Rationale, measurement, and preliminary findings. Journals of Gerontology: Psychological Sciences & Social Sciences, 64 (Suppl. 1), 47–55. [DOI] [PMC free article] [PubMed] [Google Scholar]
- York Cornwell E, & Waite LJ (2009). Measuring social isolation among older adults using multiple indicators from the NSHAP study. Journals of Gerontology: Social Sciences, 64B(S1), i38–i46, doi: 10.1093/geronb/gbp037. [DOI] [PMC free article] [PubMed] [Google Scholar]
- Cudjoe TKM, Roth DL, Szanton SL, Wolff JL, Boyd CM, & Thorpe RJ (2018). The epidemiology of social isolation: National Health and Aging Trends Study. Journals of Gerontology: Social Sciences. 10.1093/geronb/gby037/4953727?redirectedFrom=fulltext. [DOI] [PMC free article] [PubMed] [Google Scholar]
- Dahlberg L, Agahi N, & Lennartsson C (2018). Lonelier than ever? Loneliness of older people over two decades. Archives of Gerontology and Geriatrics, 75, 96–103. [DOI] [PubMed] [Google Scholar]
- Dale W, Kotwal AA, Shega JW, Schumm LP, Kern DW, … & McClintock MK (2018). Cognitive function and its risk factors among older US adults living at home. Alzheimer Disease and Associated Disorders, 32, 207–213. [DOI] [PMC free article] [PubMed] [Google Scholar]
- Donovan NJ, Wu Q, Rentz DM, Sperling RA, Marshall GA, & Glymour MM (2017). Loneliness, depression and cognitive function in older U.S. adults. International Journal of Geriatric Psychiatry, 32, 564–573. [DOI] [PMC free article] [PubMed] [Google Scholar]
- Dugan E, & Kivett VR (1994). The importance of emotional and social isolation to loneliness among very old rural adults. The Gerontologist, 34, 340–346. [DOI] [PubMed] [Google Scholar]
- Dykstra PA (2009). Older adult loneliness: Myths and realities. European Journal of Ageing, 6, 91–100. [DOI] [PMC free article] [PubMed] [Google Scholar]
- Dykstra PA & De Jong Gierveld J (2004). Gender and marital-history differences in emotional and social loneliness among Dutch older adults. Canadian Journal on Aging, 23, 141–155. [DOI] [PubMed] [Google Scholar]
- Elder GH Jr. (1994). Time, human agency, and social change: Perspectives on the life course. Social Psychology Quarterly, 57, 4–15. [Google Scholar]
- Elder GH (1998). The life course as developmental theory. Child Development, 69, 1–12. [PubMed] [Google Scholar]
- Elder GH Jr., Johnson MK, & Crosnoe R (2003). The emergence and development of life course theory. In Mortimer JT & Shanahan MJ (Eds.), Handbook of the Life Course (pp. 3–19). New York: Kluwer Academic/Plenum Publishers. [Google Scholar]
- Eloranta S, Arve S, Isoaho H, Lehtonen A, & Viitanen M (2015). Loneliness of older people aged 70: A comparison of two Finnish cohorts born 20 years apart. Archives of Gerontology and Geriatrics 61, 254–260. [DOI] [PubMed] [Google Scholar]
- Fischer C (2011). Still Connected: Family and Friends in America Since 1970. New York, USA: Russell Sage Foundation. [Google Scholar]
- Fokkema T, De Jong Gierveld J, & Dykstra PA (2012). Cross-national differences in older adult loneliness. The Journal of Psychology, 146:1–2, 201–228. [DOI] [PubMed] [Google Scholar]
- Fokkema T, & Naderi R (2013). Differences in late-life loneliness: A comparison between Turkish and native-born older adults in Germany. European Journal of Ageing, 10, 289–300. [DOI] [PMC free article] [PubMed] [Google Scholar]
- Gerst-Emerson K, & Jayawardhana J (2015). Loneliness as a public health issue: The impact of loneliness on health care utilization among older adults. American Journal of Public Health, 105, 1013–1019. [DOI] [PMC free article] [PubMed] [Google Scholar]
- Hafner K (2016). Researchers confront an epidemic of loneliness. The New York Times, 5. [Google Scholar]
- Hagerty BM, Williams RA, Coyne JC, & Early MR (1996). Sense of belonging and indicators of social and psychological functioning. Archives of Psychiatric Nursing, 10, 235–244. [DOI] [PubMed] [Google Scholar]
- Hawkley LC, & Cacioppo JT (2010). Loneliness matters: A theoretical and empirical review of consequences and mechanisms. Annals of Behavioral Medicine, 40, 218–227. [DOI] [PMC free article] [PubMed] [Google Scholar]
- Hawkley LC, Hughes ME, Waite LJ, Masi CM, Thisted RA, & Cacioppo JT (2008). From social structural factors to perceptions of relationship quality and loneliness: The Chicago Health, Aging, and Social Relations Study. Journal of Gerontology: Social Sciences, 63B, S375–S384. [DOI] [PMC free article] [PubMed] [Google Scholar]
- Hawkley LC, & Kocherginsky M (2018). Transitions in loneliness among older adults: A five-year follow-up in the National Social Life, Health, and Aging Project. Research on Aging, 40, 365–387. [DOI] [PMC free article] [PubMed] [Google Scholar]
- Hawkley LC, Kocherginsky M, Wong J, Kim J, & Cagney K (2014). Missing data in Wave 2 of the National Social Life, Health, and Aging Project: Prevalence, predictors, and recommended treatment. Journals of Gerontology Series B: Psychological & Social Sciences, 69, Suppl 2, S38–50. [DOI] [PMC free article] [PubMed] [Google Scholar]
- He W, Goodkind D, & Kowal P (2016). U.S. Census Bureau, International Population Reports, P95/16–1, An Aging World: 2015. Washington, DC: U.S. Government Publishing Office. [Google Scholar]
- Health and Retirement Study, (HRS Core) public use dataset. Produced and distributed by the University of Michigan with funding from the National Institute on Aging (grant number NIA U01AG009740). Ann Arbor, MI, (2006-16). [Google Scholar]
- Holford TR (2006). Approaches to fitting age-period-cohort models with unequal intervals. Statistics in Medicine, 25, 977–993. [DOI] [PubMed] [Google Scholar]
- Holt-Lunstad J, (2017). The potential public health relevance of social isolation and loneliness: Prevalence, epidemiology, and risk factors. Public Policy & Aging Report, 27, 127–130, 10.1093/ppar/prx030. [DOI] [Google Scholar]
- Holt-Lunstad J, Robles TF, & Sbarra DA (2017). Advancing social connection as a public health priority in the United States. American Psychologist, 72, 517–530. [DOI] [PMC free article] [PubMed] [Google Scholar]
- Holt-Lunstad J, Smith TB, Baker M, Harris T, & Stephenson D (2015). Loneliness and social isolation as risk factors for mortality: A meta-analytic review. Perspectives on Psychological Science, 10, 227–237. 10.1177/1745691614568352 [DOI] [PubMed] [Google Scholar]
- Honigh-de Vlaming R, Haveman-Nies A, Groeniger IB-O, de Groot L, & van ‘t Veer P (2014). Determinants of trends in loneliness among Dutch older people over the period 2005–2010. Journal of Aging and Health, 26(3), 422–440. [DOI] [PubMed] [Google Scholar]
- Hughes ME, Waite LJ, Hawkley LC, & Cacioppo JT (2004). A short scale for measuring loneliness in large surveys: Results from two population-based studies. Research on Aging, 26, 655–672. [DOI] [PMC free article] [PubMed] [Google Scholar]
- Hülür G, Drewelies J, Eibich P, Düzel S, Demuth I, Ghisletta P,…& Gerstorf D (2016). Cohort differences in psychosocial function over 20 years: Current older adults feel less lonely and less dependent on external circumstances. Gerontology, 62, 354–361. [DOI] [PubMed] [Google Scholar]
- Hung WW, Ross JS, Boockvar KS, & Siu AL (2011). Recent trends in chronic disease, impairment and disability among older adults in the United States. BMC Geriatrics, 11, 47. [DOI] [PMC free article] [PubMed] [Google Scholar]
- Kar-Purkayastha I (2010). An epidemic of loneliness. The Lancet, 376, 2114–2115 [DOI] [PubMed] [Google Scholar]
- Katz S, Ford AB, Moskowitz RW, Jackson BA, & Jaffe MW (1963). Studies of illness in the aged. Journal of the American Medical Association, 185, 914–919. [DOI] [PubMed] [Google Scholar]
- König M, Drewelies J, Norman K, Spira D, Buchmann N, … & Demuth I (2018). Historical trends in modifiable indicators of cardiovascular health and self-rated health among older adults: Cohort differences over 20 years between the Berlin Aging Study (BASE) and the Berlin Aging Study II (BASE-II). PLoS ONE 13(1), e0191699. 10.1371/journal.pone.0191699 [DOI] [PMC free article] [PubMed] [Google Scholar]
- Kotwal AA, Schumm P, Kern DW, McClintock MK, Waite LJ,...& Dale W (2015). Evaluation of a brief survey instrument for assessing subtle differences in cognitive function among older adults. Alzheimer Disease and Associated Disorders, 29, 317–324. [DOI] [PMC free article] [PubMed] [Google Scholar]
- Kreider RM & Ellis R (2011). Number, timing, and duration of marriages and divorces: 2009. Current Population Reports, P70–125. Washington, DC: U.S. Census Bureau. [Google Scholar]
- Krosnick JA, & Alwin DF (1987). An evaluation of a cognitive theory of response-order effects in survey measurement. Public Opinion Quarterly, 51, 201–219. [Google Scholar]
- Langa KM (2015). Is the risk of Alzheimer’s disease and dementia declining? Alzheimer’s Research & Therapy, 7, 34. [DOI] [PMC free article] [PubMed] [Google Scholar]
- Langa KM, Larson EB, Crimmins EM, Faul JD, Levine DA, Kabeto MU, & Weir DR (2017). A comparison of the prevalence of dementia in the United States in 2000 and 2012. JAMA Internal Medicine, 177, 51–58. [DOI] [PMC free article] [PubMed] [Google Scholar]
- Lawton MP, & Brody EM (1969). Assessment of older people: Self-maintaining and instrumental activities of daily living. The Gerontologist, 9, 179–186. [PubMed] [Google Scholar]
- Leary MR (1990). Responses to social exclusion: Social anxiety, jealousy, loneliness, depression, and low self-esteem. Journal of Social and Clinical Psychology, 9, 221–229. [Google Scholar]
- Lin S-F, Beck AN, Finch BK, Hummer RA, & Master RK (2012). Trends in US older adult disability: Exploring age, period, and cohort effects. American Journal of Public Health, 102, 2157–2163. DOI: 10.2105/AJPH.2011.300602 [DOI] [PMC free article] [PubMed] [Google Scholar]
- Long MV, & Martin P (2000). Personality, relationship closeness, and loneliness of oldest old adults and their children. Journal of Gerontology: Psychological Sciences, 55B, P311–P319. [DOI] [PubMed] [Google Scholar]
- Luhmann M, & Hawkley L (2016). Age differences in loneliness from late adolescence to oldest old age. Developmental Psychology, 52, 943–959. 10.1037/dev0000117. [DOI] [PMC free article] [PubMed] [Google Scholar]
- Luo Y, Hawkley LC, Waite LJ, & Cacioppo JT (2012). Loneliness, health, and mortality in old age: A national longitudinal study. Social Science & Medicine, 74(6), 907–914. [DOI] [PMC free article] [PubMed] [Google Scholar]
- Margolis R, & Verdery AM (2017). Older adults without close kin in the United States. Journals of Gerontology: Social Sciences, 72, 688–693. [DOI] [PMC free article] [PubMed] [Google Scholar]
- McInerney M, Mellor JM, & Nicholas LH (2013). Recession depression: Mental health effects of the 2008 stock market crash. Journal of Health Economics, 32, 1090–1104. [DOI] [PMC free article] [PubMed] [Google Scholar]
- Murthy V (2017). Work and the loneliness epidemic. Harvard Business Review, 9. [Google Scholar]
- Nowland R, Necka EA, & Cacioppo JT (2018). Loneliness and social internet use: Pathways to reconnection in a digital world? Perspectives on Psychological Science, 13¸ 70–87. [DOI] [PubMed] [Google Scholar]
- Nyqvist F, Cattan M, Conradsson M, Näsman, & Gustafsson Y (2017). Prevalence of loneliness over ten years among the oldest old. Scandinavian Journal of Public Health, 45, 411–418. doi: 10.1177/1403494817697511. [DOI] [PubMed] [Google Scholar]
- O’Muircheartaigh C, Eckman S, & Smith S (2009). Statistical design and estimation for the National Social Life, Health and Aging Project. Journals of Gerontology: Psychological Sciences & Social Sciences, 64 (Suppl. 1), i12–19. [DOI] [PMC free article] [PubMed] [Google Scholar]
- O’Muircheartaigh C, English N, Pedlow S, & Kwok PK (2014) Sample design, sample augmentation, and estimation for Wave 2 of the NSHAP. Journals of Gerontology: Psychological Sciences & Social Sciences, 69 (Suppl. 2), S15–26. [DOI] [PMC free article] [PubMed] [Google Scholar]
- Peplau LA, & Perlman D (1982). Loneliness: A Sourcebook of Current Theory, Research and Therapy. New York, USA: Wiley & Sons. [Google Scholar]
- Petersen J, Kaye J, Jacobs PG, Quinones A, Dodge H, Arnold A, & Thielke S (2015). Longitudinal relationship between loneliness and social isolation in older adults: Results from the Cardiovascular Health Study. Journal of Aging and Health, 28, 775–795. [DOI] [PMC free article] [PubMed] [Google Scholar]
- Perissinotto CM, Cenzer IS, & Covinsky KE (2012). Loneliness in older persons: A predictor of functional decline and death. Archives of Internal Medicine, 172, 1078–1093. [DOI] [PMC free article] [PubMed] [Google Scholar]
- Petitte T, Mallow J, Barnes E, Petrone A, Barr T, & Theeke L (2015). A systematic review of loneliness and common chronic physical conditions in adults. Open Psychology Journal, 8 (Suppl 2), 113–132. [DOI] [PMC free article] [PubMed] [Google Scholar]
- Pinquart M (2003). Loneliness in married, widowed, divorced, and never-married older adults. Journal of Social and Personal Relationships, 20, 31–53. [Google Scholar]
- Pinquart M, & Sörensen S (2001). Influences on loneliness in older adults – A meta-analysis. Basic and Applied Social Psychology, 23, 245–266. [Google Scholar]
- Pinquart M, & Sörensen S (2003). Risk factors for loneliness in adulthood and old age—A meta-analysis. Advances in Psychology Research, 19, 111–143. [Google Scholar]
- Pitkala KH, Valvanne J, Kulp S, Strandberg TE, & Tilvis RS (2001). Secular trends in self-reported functioning, need for assistance, and attitudes towards life: 10-year differences of three older cohorts. Journal of the American Geriatric Society, 49, 596–600. [DOI] [PubMed] [Google Scholar]
- Prieto-Flores M-E, Fernandez-Mayoralas G, Forjaz MJ, Rojo-Perez F, & Martinez-Martin P (2011). Residential satisfaction, sense of belonging and loneliness among older adults living in the community and in care facilities. Health & Place, 17, 1183–1190. [DOI] [PubMed] [Google Scholar]
- Primack BA, Shensa A, Sidani JE, Whaite EO Lin L,…& Miller E (2017). Social media use and perceived social isolation among young adults in the U.S. American Journal of Preventive Medicine, 53, 1–8. [DOI] [PMC free article] [PubMed] [Google Scholar]
- Raley RK, Sweeney MM, & Wondra D (2016). The growing racial and ethnic divide in U.S. marriage patterns. Future Child, 25, 89–109. [DOI] [PMC free article] [PubMed] [Google Scholar]
- Reher D & Requena M (2015). The mid-twentieth century fertility boom from a global perspective. The History of the Family, 20, 420–445. [Google Scholar]
- Russell D (2009). Living arrangements, social integration, and loneliness in later life: The case of physical disability. Journal of Health and Social Behavior, 50, 460–475. [DOI] [PubMed] [Google Scholar]
- Sacuiu S, Gustafson D, Sjöberg M, Guo X, Östling S, Johansson B, & Skoog I (2010). Secular changes in cognitive predictors of dementia and mortality in 70-year-olds. Neurology, 75. 10.1212/WNL.0b013e3181f0737c. [DOI] [PMC free article] [PubMed] [Google Scholar]
- Schirmer W, & Michailakis D (2018). Inclusion/exclusion as the missing link. A Luhmannian analysis of loneliness among older people. Systems Research and Behavioral Science, 35, 76–89. [Google Scholar]
- Selvin E, Parrinello CM, Sacks DB, & Coresh J (2014). Trends in prevalence and control of diabetes in the United States, 1988–1994 and 1999–2010. Annals of Internal Medicine, 160, 517–525. [DOI] [PMC free article] [PubMed] [Google Scholar]
- Skrondal A, & Rabe-Hesketh S (2004). Generalized Latent Variable Modeling. New York: Chapman & Hall/CRC. [Google Scholar]
- Smith J, Ryan L, Sonnega A, & Weir D (2017). Psychosocial and Lifestyle Questionnaire 2006–2016. Retrieved from http://hrsonline.isr.umich.edu/sitedocs/userg/HRS2006-2010SAQdoc.pdf.
- Snyder TD, Ed. (1993). 120 years of American education: A statistical portrait. National Center for Education Statistics. Retrieved from https://nces.ed.gov/pubs93/93442.pdf [Google Scholar]
- Spuling SM, Wurm S, Tesch-Römer C, & Huxhold O (2015). Changing predictors of self-rated health: Disentangling age and cohort effects. Psychology and Aging, 30, 462–474. [DOI] [PubMed] [Google Scholar]
- Stack S (1998). Marriage, family and loneliness: A cross-national study. Sociological Perspectives, 41, 415–432. [Google Scholar]
- StataCorp (2017). Stata: Release 15. Statistical Software. College Station, TX: StataCorp LLC. [Google Scholar]
- Stevens NL, & Van Tilburg TG (2000). Stimulating friendship in later life: A strategy for reducing loneliness among older women. Educational Gerontology, 26, 15–35. [Google Scholar]
- Stevens NL, & Van Tilburg TG (2011). Cohort differences in having and retaining friends in personal networks in later life. Journal of Social and Personal Relationships, 28, 24–43. [Google Scholar]
- Suanet B, & Huxhold O (2018). Cohort difference in age-related trajectories in network size in old age: Are networks expanding? Journals of Gerontology: Social Sciences. Advance Access publication. doi: 10.1093/geronb/gbx166 [DOI] [PubMed] [Google Scholar]
- Suanet B, Van Tilburg TG, & Broese van Groenou MI (2013). Nonkin in older adults’ personal networks: More important among later cohorts? Journals of Gerontology: Psychological Sciences & Social Sciences, 68, 633–643. [DOI] [PubMed] [Google Scholar]
- Sung Y-K, Li L, Blake C, Betz J, & Lin FR (2016). Association of hearing loss and loneliness in older adults. Journal of Aging and Health, 28, 979–994. [DOI] [PubMed] [Google Scholar]
- Theeke LA (2009). Predictors of loneliness in U.S. adults over age sixty-five. Archives of Psychiatric Nursing, 23, 387–396. [DOI] [PubMed] [Google Scholar]
- U.S. Department of Labor (2019). 1948–2016 annual averages, Current Population Survey, U.S. Bureau of Labor Statistics. Retrieved from https://www.dol.gov/wb/stats/NEWSTATS/facts/women_lf.htm#one. [Google Scholar]
- Van Tilburg TG, Aartsen MJ, & Van Der Pas S (2015). Loneliness after divorce: A cohort comparison among Dutch young-old adults. European Sociological Reviews, 31, 243–252. [Google Scholar]
- Vasilopoulos T, Kotwal A, Huisingh-Scheetz MJ, Waite LJ, McClintock MK, & Dale W (2014). Comorbidity and chronic conditions in the National Social Life, Health and Aging Project (NSHAP), Wave 2. Journals of Gerontology: Psychological Sciences & Social Sciences, 69 (Suppl. 2), S154–65. [DOI] [PMC free article] [PubMed] [Google Scholar]
- Vespa J (2017). Historical living arrangements of older adults: 1967–2016. US Census Bureau. Retrieved from https://www.census.gov/content/dam/Census/library/working-papers/2017/demo/SEHSD-WP2017-30.pdf. [Google Scholar]
- Victor CR, Scambler SJ, Shah S, Cook DG, Harris T, Rink E, & De Wilde S (2002). Has loneliness amongst older people increased? An investigation into variations between cohorts. Ageing and Society, 22, 585–597. [Google Scholar]
- Wallhagen MI, Strawbridge WJ, Shema SJ, Kurata J & Kaplan GA (2001). Comparative impact of hearing and vision impairment on subsequent functioning. Journal of the American Geriatrics Society, 49, 1086–1092. [DOI] [PubMed] [Google Scholar]
- World Bank (2017). GINI Index (World Bank estimate). Accessed January 9, 2019, https://data.worldbank.org/indicator/SI.POV.GINI?locations=US-GB.
- Yan Z, Yang X, Wang L, Zhao Y, & Yu L (2014). Social change and birth cohort increase in loneliness among Chinese older adults: A cross-temporal meta-analysis, 1995–2011. International Psychogeriatrics, 26, 1773–1781. [DOI] [PubMed] [Google Scholar]
- Yu RP, McCammon RJ, Ellison NB, & Langa KM (2016). The relationships that matter: Social network site use and social wellbeing among older adults in the United States of America. Ageing & Society, 36, 1826–1852. [Google Scholar]
- Zhong B-L, Chen S-L, Tu X, & Conwell Y (2017). Loneliness and cognitive function in older adults: Findings from the Chinese Longitudinal Healthy Longevity Survey. Journal of Gerontology: Social Sciences, 72, 120–128. [DOI] [PMC free article] [PubMed] [Google Scholar]
Associated Data
This section collects any data citations, data availability statements, or supplementary materials included in this article.