

Abstract
Rationale.
Cannabidiol (CBD) is found in the cannabis plant and has garnered attention as a potential treatment for alcohol use disorder (AUD). CBD reduces alcohol consumption and other markers of alcohol dependence in rodents, but human research on CBD and alcohol is limited. It is unknown whether CBD reduces drinking in humans, and mechanisms through which CBD could impact behavioral AUD phenotypes are unknown.
Objectives.
This study explores effects of oral CBD on breath alcohol level (BrAC), and subjective effects of alcohol in human participants who report heavy drinking.
Methods.
In this placebo-controlled, crossover study, participants consumed 30mg CBD, 200mg CBD, or placebo CBD before receiving a standardized alcohol dose. Participants were blind to which CBD dose they received at each session and completed sessions in random order. 36 individuals completed at least one session and were included in analyses.
Results.
Differences in outcomes across the three conditions and by sex were explored using multilevel structural equation models. BrAC fell fastest in the placebo condition, followed by 30mg and 200mg CBD. Stimulation decreased more slowly in the 200mg CBD condition than placebo (b=−2.38, BCI [−4.46, −.03]). Sedation decreased more slowly in the 30mg CBD condition than placebo (b=−2.41, BCI [−4.61, −.09]). However, the magnitude of condition differences in BrAC and subjective effects was trivial.
Conclusions.
CBD has minimal influence on BrAC and subjective effects of alcohol. Further research is needed to test whether CBD impacts alcohol consumption in humans, and if so, what mechanism(s) may explain this effect.
Keywords: Alcohol, cannabidiol (CBD), subjective effects, stimulation, sedation, Breath-alcohol concentration
Introduction
Alcohol use disorders (AUD) contribute to significant morbidity and mortality in the United States and worldwide, and are considered a public health crisis throughout the U.S. (Grant et al. 2017). However, because currently available psychosocial and pharmacological interventions for individuals seeking to reduce their alcohol consumption reveal only moderate long-term effectiveness (Dutra et al. 2008; Jonas et al. 2014; Lappan et al. 2020), there is increasing interest in exploring new AUD treatments, including those that may involve targeting novel neural pathways and biological systems. One potential AUD treatment target that has garnered interest in recent years is the endogenous cannabinoid system (ECS) (Sloan et al. 2017). Notably, cannabidiol (CBD) is a cannabinoid found in the cannabis plant that has been shown to be safe and well-tolerated in humans (Taylor et al. 2018), and has demonstrated promise in preclinical studies as a possible novel candidate pharmacotherapy for AUD (Turna et al. 2019; Nona et al. 2019). Specifically, rodent studies indicate that CBD decreases alcohol’s reinforcing effects and significantly reduces both motivation to consume alcohol and alcohol intake (Viudez-Martínez et al. 2018b, a). In another study leveraging a rodent AUD model, CBD was found to attenuate both cue-induced and stress-induced alcohol-seeking behavior, alcohol reinstatement (relapse), anxiety, and impulsivity (Gonzalez-Cuevas et al. 2018). Several recent reviews of the existing research on CBD also suggested that CBD may protect against the deleterious effects of alcohol on the liver and brain (Turna et al. 2019; Nona et al. 2019).
Although there is limited human data on the effects of CBD on alcohol consumption and AUD phenotypes, we have previously proposed a mechanistic model explaining how CBD may aid in treating AUD in humans (Karoly et al. 2020). Briefly, chronic alcohol exposure is known to disturb gut, immune and brain function, and our proposed model suggests that CBD may ameliorate the deleterious peripheral effects of alcohol as well as mitigate neurobehavioral symptoms of AUD (e.g., alcohol consumption, craving, impaired control) through exerting beneficial actions across the digestive tract, immune system and brain, collectively known as the microbiota-gut-brain-axis (MGBA) (Karoly et al. 2020). CBD may also directly influence brain systems that underlie the clinical symptoms of AUD. For example, rodent models of AUD have shown that administration of CBD can impact expression of genes that mediate alcohol reward, such as OPRM1, GPR55, 5HT1A and CB1 (Mague and Blendy 2010; Francés et al. 2015; Parsons and Hurd 2015; Musella et al. 2017; Viudez‐Martínez et al. 2018). Human data exploring the effects of alcohol and CBD throughout the brain and body are needed to shed light on these potential mechanisms.
Notably, despite the existence of numerous compelling preclinical studies suggesting that CBD may impact alcohol consumption through modulation of neural pathways associated with alcohol reward, the human research on CBD and alcohol is limited to only three laboratory studies. These studies explored the effects of co-administration of oral CBD and a standardized dose of alcohol on cognitive and motor performance and breath alcohol concentration (BrAC). Two studies demonstrated that CBD had no effect on cognitive/motor performance when combined with alcohol (Belgrave et al. 1979; Bird et al. 1980), whereas one indicated that CBD plus alcohol did produce cognitive and motor impairments (Consroe et al. 1979). One study found that CBD was associated with lower BrAC compared to when alcohol was consumed without CBD (Consroe et al. 1979), but the other studies found no effects of CBD on BrAC (Belgrave et al. 1979; Bird et al. 1980). Given these conflicting findings, further human research is needed in order to better understand the acute effects of alcohol combined with CBD.
In addition to testing the effects of CBD on BrAC, it is also important to determine whether CBD may impact the sedating and stimulating subjective effects (Hendler et al. 2011) of alcohol across the blood alcohol concentration (BAC) curve. If CBD is found to alter the magnitude and/or duration of the subjective effects of alcohol, this could be one mechanism through which CBD may influence alcohol consumption (e.g., if CBD decreases the degree to which individuals experience the enjoyable effects of alcohol, this could be one mechanism through which CBD could aid in reducing alcohol intake). Finally, in light of the well-established sexual dimorphism of the endocannabinoid system (Wiley 2003; Craft et al. 2013; Wakley et al. 2014; Brents 2016; Schlienz et al. 2017), it is possible that biological sex may moderate the impact of CBD on alcohol-related outcomes, but to our knowledge, no human studies to date have explored this topic.
To address these gaps in the literature and shed light on the possible mechanism(s) through which CBD may influence alcohol consumption in humans, this placebo-controlled, crossover study, conducted with a sample of heavy-drinking individuals, aims to assess the effects of plant-based CBD (200mg, 30mg and placebo) on craving, self-reported affect, and subjective responses to alcohol over a 5-hour period. We hypothesize that, compared to placebo, CBD will be associated with reduced alcohol craving over the course of the experiment We hypothesize that CBD will alter the magnitude and/or duration of these subjective effects of alcohol in a dose dependent fashion, however we lack prior data to inform directional hypotheses. In addition, given the conflicting findings in the prior human laboratory studies on this topic, we lack clear directional hypotheses regarding the effect that CBD may have on BrAC.
Method
Procedures.
Participants were recruited using online and social media postings (e.g., Craigslist, Reddit) and flyers posted throughout the community. Trained research assistants screened participants via phone and determined eligibility using the following criteria: 21–60 years old, able to provide consent, willing to consume CBD during the study, report heavy drinking (>5 drinks [>4 for women] per occasion on at least 5 days/month in the past 3 months), not cannabis/CBD naive (i.e. THC or CBD use at least once in the past year), do not use cannabis regularly (i.e., less than monthly over past year), and no past-month cannabis use. Participants were excluded if they were: a regular or recent cannabis user (i.e. they used cannabis more often than monthly during the past year or used cannabis in the past month), were seeking treatment a substance use disorder (SUD) including AUD, taking medications to treat bipolar or psychotic disorders, using nicotine every day, or taking blood thinning medications. They were also excluded if they reported having a major medical condition contraindicating alcohol or CBD use (e.g., liver disease or heart disease), reported current suicidality, met criteria for psychotic disorder, bipolar disorder or a current major depressive episode, reported using illicit drugs in the 30 days prior to beginning the study or tested positive for any illicit drugs, or were pregnant, breastfeeding or trying to become pregnant. Note that individuals were excluded for recent or regular cannabis use to ensure that no CBD or THC would be present in their blood during experiments, but were required not to be cannabis/CBD naïve for safety reasons (i.e., to ensure that participants had experience using cannabis and/or CBD prior to the session and had not experienced adverse reactions).
Eligible individuals completed three appointments scheduled approximately one week apart. At the first session, a trained research assistant secured the participant’s informed consent. Each session began with participants completing a urine pregnancy test (if applicable) and a urine drug screening and a breathalyzer test to measure breath alcohol content (BrAC), using the Alco-Sensor IV by Intoximeter (St. Louis, MO)1. One participant was disqualified for a positive drug test at session 1; no participants tested positive for pregnancy. Sessions were rescheduled if BrAC was above 0.000 g/dL. After urine testing, participants completed baseline survey measures, including a demographics form followed by psychological functioning (e.g., Beck Depression Inventory (Beck et al. 1988), Beck Anxiety Inventory(Beck and Steer 1990)) and substance use questionnaires (e.g., Alcohol Use Disorders Identification Test (Saunders et al. 1993)). Next, the experimental portion of the session began. Each subsequent session began with urine testing and then commenced to experimental procedures. Baseline surveys were only administered at each participant’s first session.
All three sessions followed the same experimental procedure (Figure 1). After a blood draw, participants received either placebo CBD (water mixed with red dye), 30 mg CBD dissolved in water mixed with red dye or 200 mg CBD dissolved in water mixed with red dye. The dosing order was determined using a random number generator for each participant; participants were blind to the CBD dose they received. They waited in the lab for 25 minutes before having their blood drawn again. As in previous alcohol/cannabis coadministration research, participants were then given 0.6g/kg of vodka mixed with orange juice (Brumback et al. 2007), to be consumed within 20 minutes (Belgrave et al. 1979; Consroe et al. 1979; Bird et al. 1980; Ramaekers et al. 2011). The alcohol dose for females was reduced by 8% to adjust for biological sex differences that affect alcohol absorption (HINDMARCH et al. 1991; Dougherty et al. 2008). A third blood draw was taken 60 minutes after alcohol dosing, which corresponded to 90 minutes post-CBD ingestion. Over the next 3.5 hours, BrAC assessments and other measures (listed below) were repeated every 30 minutes (Figure 1). Participants had to reach a BrAC <0.03 g/dL before leaving the lab. They were provided with a rideshare if they were unable to arrange someone to pick them up.
Figure 1.

Study session timeline.
The second and third sessions were identical to the first, except that the participants received each of the other two CBD doses, so that over three sessions each participant completed one session with placebo CBD, one session with 30mg CBD, and one session with 200mg CBD.
Measures
All measures listed below were administered prior to alcohol consumption at T0, and then repeated 8 times (T1-T8) after alcohol was consumed (Figure 1).
The Biphasic Alcohol Effects Scale (BAES) is a self‐report scale that measures the stimulant and sedative effects of alcohol (Martin et al. 1993). It has good reliability and validity in individuals with AUD. The BAES has 14 items with response option from 0–10, and can be broken into two subscales: stimulation and sedation. The Subjective Effects of Alcohol Scale (SEAS) is a standard self-report measure for assessing subjective mood responses to alcohol (specifically, high and low arousal positive and negative affect), which includes 14 items with response option that range from 1–10 (Morean et al. 2013). Note that we did not analyze the negative affect subscales due to a high number of outlier values across multiple timepoints. The Alcohol Urge Questionnaire (AUQ) is a well-established, 8-item measure of alcohol craving and desire to drink that is commonly used in the context of acute alcohol administration (Bohn et al. 1995). The range of responses for each question is 1–7.
There were three venous blood draws for blood cannabinoids during each of the three visits. Blood draws occurred before CBD/placebo ingestion (to verify no CBD use prior to the experiment); 25 minutes post-CBD consumption, corresponding with rising CBD blood levels in a prior study using this CBD product (Williams et al. 2021); and again 60 minutes later (i.e., 60 minutes after the start of the alcohol consumption period), corresponding with expected peak alcohol content in the blood (Dougherty et al. 2008). Plasma was extracted and stored at −80°C until being assayed for CBD using High Performance Liquid Chromatography-Tandem Mass Spectrometry (Klawitter et al. 2017). Blood alcohol concentration was also assessed from blood samples taken at the 60-minutes-post-alcohol timepoint. A detailed description of processing methods used in cannabinoid assays are included in the Supplementary Materials.
Oral CBD preparation.
Caliper Foods supplied a commercially available, water-soluble CBD solution for this study. Details are provided in the Supplementary Materials. The pharmacokinetics of the product were benchmarked in a prior study (Williams et al. 2021). The CBD doses were chosen because the 200mg dose is consistent with prior CBD and alcohol laboratory research (Consroe et al. 1979) and the 30mg dose is closer to the amount of CBD that is commonly found in commercial CBD products.
Analytic Plan
Prior to hypothesis testing, we conducted data wrangling and visualizations on the raw data for all 6 outcomes using the R programming language and packages included in tidyverse (Team 2013; Wickham et al. 2019) (e.g., ggplot2 (Wickham 2016)). Figure 2 shows plots of raw data for all outcomes across the study time period by condition. To examine changes over time in BrAC, alcohol craving, affect, sedation, and stimulation during the descending limb of the BrAC curve (T2 – T8, see Figure 1) and to compare these changes by sex and condition, we ran a series of Multilevel Structural Equation Models (MSEM;(Mehta and Neale 2005) using Mplus 8 (Muthén and Muthen 2017). Due to the research design, where each participant completed each condition (placebo, 30mg CBD and 200mg CBD) and within each condition there were 7 repeated measures of interest, MSEMs were run with a latent growth curve on the within-level to capture the change over time. Repeated measures of interest were taken at timepoints T2-T8, which represent the descending limb of the BrAC curve. We focused on the descending limb because evidence suggests that some subjective effects of alcohol may be particularly prominent during the descending limb (Pihl et al. 2003; Brick 2006). In addition, prior medication studies have demonstrated that notable medication effects such as reduction in craving and stimulation are observed in both the descending and ascending limb (Ray and Hutchison 2007), but some unique effects such as increased tension may be specific to the descending limb (Ray et al. 2008). Another advantage of focusing on the descending limb is that changes during this time are expected to be approximately linear (e.g., BrAC decreases linearly (Posey and Mozayani 2007)), which supports a more straightforward interpretation of model results. Note that T2= 90 minutes after the start of the alcohol administration session and T8=4.5 hours after the start of the alcohol administration session.
Figure 2.
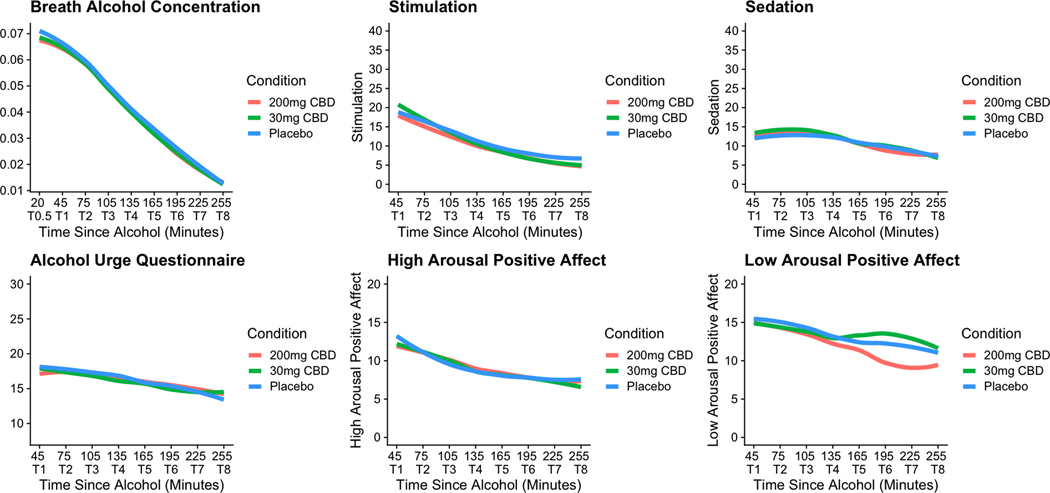
Plots of raw data for all study outcomes by condition over the course of each experimental session. Note: X-Axis indicates time elapsed since the end of the 20-minute alcohol administration period. Note for BrAC plot, “T0.5” is an extra timepoint for this outcome only—as such, this timepoint was not included in analyses or plots for the other outcomes of interest.
In all models, condition was treated as a within-person variable, and sex was treated as a between-person variable. To examine whether condition influenced changes over time, we regressed the latent slope parameter defined by the latent growth curve model on a dummy coded within-person condition variable. As there were 3 conditions, each model had to be run twice to assess all pairwise comparisons. First with placebo as the referent group (i.e., comparing placebo to 30mg CBD and placebo to 200mg of CBD) and then again with 30mg CBD as the referent group (i.e., to get the comparison of 30mg CBD to 200mg CBD). To determine if sex moderated the condition→change relationship we created a random slope of condition predicting the latent slope variable and then regressed that random slope on the between-person binary sex variable. This is referred to as the random coefficient prediction method (Preacher et al. 2010, 2016). We also used this method to determine if the overall change over time was moderated by sex by regressing the random latent slope parameter on the between-person sex variable. The MSEM approach allows paths that include within-level effects to have random intercepts and allows for the creation of Bayesian credible intervals for assessing significance of effects. Bayesian credible intervals provide a robust test of direct and moderation effects, are computationally efficient, and are amenable to a variety of variable characteristics (e.g., hierarchical–nested and non-normal data; (Gelman et al. 2004; Muthén and Asparouhov 2012).
Results
Participant Characteristics.
Thirty-six participants between ages 21–51 completed at least one session. Of those individuals, twenty-two completed all three appointments, four completed two appointments and 10 completed one appointment. Table 1 shows the demographics of the overall sample (N=36) and Figure 3 2 is a flow diagram indicating the number of participants that completed each session and reasons for ineligibility and for dropping out of the study.
Table 1.
Sample demographics and psychological assessment scores
| Overall N=36 | |
|---|---|
| Age, y, mean (SD) | 26.5 (6.8) |
| Women, No. (%) | 19 (52.8%) |
| Marital status, married, No. (%) | 3 (8.3%) |
| Education, bachelor’s degree or higher, No. (%) | 20 (55.6%) |
| Employment, full-time No. (%) | 10 (27.8%) |
| Race, white, No. (%) | 34 (94.4%) |
| AUDIT, mean (SD) | 9.7 (4.7) |
| BDI, mean (SD) | 7.3 (6.3) |
| BAI, mean (SD) | 4.4 (5.8) |
Note. AUDIT=Alcohol Use Disorders Identification Test; BDI=Beck Depression Inventory-II, BAI=Beck Anxiety Inventory
Figure 3.
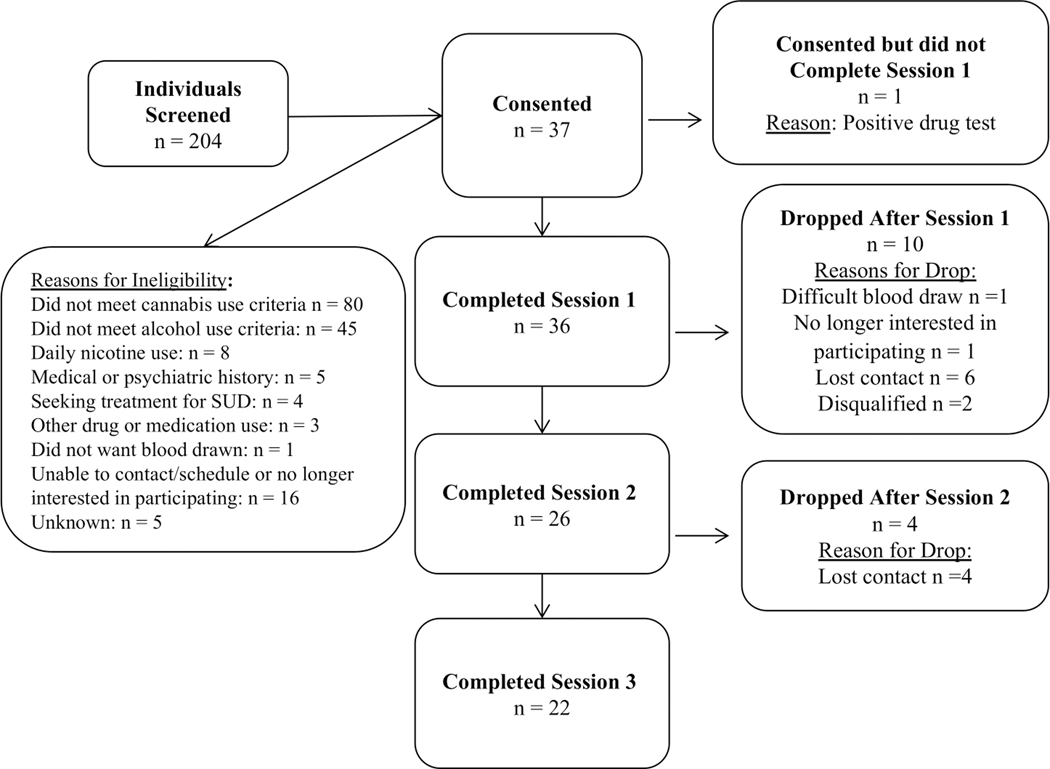
Flow diagram indicating participant involvement in each study session and reasons for dropout and ineligibility.
Change in Outcomes Over Time.
Figure 2 is a panel plot showing changes in the raw data for each outcome of interest over the course of the experimental study period. It should be noted that the plots in Figure 2 do not directly correspond with the model results presented in Table 2 because the figures present the raw data, while the models account for measurement error, effects of condition and sex differences.
Table 2.
Multilevel Structural Equation Modeling Results Describing Sex and Condition (200mg CBD, 30mg CBD, Placebo) Differences in Change in Outcomes during the Descending Limb of the BrAC Curve.
| BrAC*100 | |||
|
|
|||
| Estimate | Posterior SD | Bayesian CI | |
|
|
|||
| SBrAC | −1.67 | 0.59 | −2.91, −0.72 |
| S30-P | −0.84 | 0.25 | −1.25, −0.30 |
| S200-P | −0.71 | 0.31 | −1.34, −0.12 |
| S200–30 | −0.71 | 0.31 | −1.33, −0.14 |
| SBrAC ← Sex | 0.10 | 0.38 | −0.50, 0.93 |
| S30-P← Sex | 0.06 | 0.16 | −0.31, 0.34 |
| S200-P← Sex | −0.07 | 0.20 | −0.44, 0.32 |
| S200–30 ← Sex | −0.60 | 0.18 | −0.43, 0.30 |
|
|
|||
| AUQ | |||
|
|
|||
| Estimate | Posterior SD | Bayesian CI | |
|
|
|||
| SAUQ | −1.38 | 1.49 | −4.53, 1.29 |
| S30-P | −0.19 | 0.44 | −1.07, 0.68 |
| S200-P | −0.50 | 0.57 | −1.65, 0.52 |
| S200–30 | −0.44 | 0.48 | −1.45, 0.49 |
| SAUQ ← Sex | −0.12 | 0.91 | −1.78, 1.78 |
| S30-P← Sex | −0.12 | 0.27 | −0.68, 0.39 |
| S200-P← Sex | 0.04 | 0.34 | −0.58, 0.72 |
| S200–30 ← Sex | −0.01 | 0.29 | −0.59, 0.56 |
|
|
|||
| SED | |||
|
|
|||
| Estimate | Posterior SD | Bayesian CI | |
|
|
|||
| SSED | −0.17 | 1.64 | −4.29, 2.13 |
| S30-P | −2.41 | 1.15 | −4.61, −0.09 |
| S200-P | −1.07 | 1.12 | −3.37, 1.03 |
| S200–30 | −0.80 | 1.00 | −2.61, 1.50 |
| SSED ← Sex | −0.22 | 0.92 | −1.91, 1.73 |
| S30-P← Sex | 0.69 | 0.75 | −0.89, 2.07 |
| S200-P← Sex | −0.19 | 0.69 | −1.43, 1.23 |
| S200–30 ← Sex | −0.30 | 0.60 | −1.70, 0.75 |
|
|
|||
| STIM | |||
|
|
|||
| Estimate | Posterior SD | Bayesian CI | |
| SSTIM | 0.51 | 1.42 | −2.46, 3.08 |
| S30-P | −2.26 | 1.17 | −4.60, 0.18a |
| S200-P | −2.38 | 1.19 | −4.46, −0.03 |
| S200–30 | −2.62 | 1.40 | −5.42, 0.11a |
| SSTIM ← Sex | −0.10 | 0.89 | −1.80, 1.65 |
| S30-P← Sex | 0.39 | 0.78 | −1.16, 1.90 |
| S200-P← Sex | 0.62 | 0.73 | −0.82, 2.01 |
| S200–30 ← Sex | 0.55 | 0.83 | −1.01, 2.19 |
|
|
|||
| HA-POS | |||
|
|
|||
| Estimate | Posterior SD | Bayesian CI | |
|
|
|||
| SHA-POS | −3.09 | 1.66 | −6.68, −0.59 |
| S30-P | −0.46 | 0.61 | −1.58, 0.76 |
| S200-P | −1.17 | 0.69 | −2.51, 0.21a |
| S200–30 | −1.03 | 0.63 | −2.22, 0.22 |
| SHA-POS ← Sex | 0.67 | 0.84 | −0.82, 2.47 |
| S30-P← Sex | −0.11 | 0.41 | −0.96, 0.66 |
| S200-P← Sex | 0.33 | 0.44 | −0.53, 1.20 |
| S200–30 ← Sex | 0.30 | 0.40 | −0.52, 1.03 |
|
|
|||
| LA-POS | |||
|
|
|||
| Estimate | Posterior SD | Bayesian CI | |
|
|
|||
| SLA-POS | 0.86 | 1.47 | −2.79, 2.90 |
| S30-P | −1.09 | 0.73 | −2.39, 0.48 |
| S200-P | −1.13 | 1.25 | −3.86, 1.09 |
| S200–30 | −1.00 | 1.28 | −3.71, 1.25 |
| SLA-POS ← Sex | −1.19 | 0.85 | −2.50, 0.70 |
| S30-P← Sex | 0.26 | 0.46 | −0.72, 1.08 |
| S200-P← Sex | 0.19 | 0.73 | −1.10, 1.72 |
| S200–30 ← Sex | 0.12 | 0.74 | −1.20, 1.72 |
Note: BrAC
100 = breath alcohol concentration multiplied by 100 to aid in model convergence; AUQ = alcohol urge questionnaire; STIM = biphasic alcohol effects scale stimulation; SED = biphasic alcohol effects scale sedation; HA-POS = subjective effects of alcohol scale high arousal positive affect; LA-POS = subjective effects of alcohol scale low arousal positive affect; S = random slope, subscript indicates change over time or provides the pairwise comparison for predicting slope from condition (e.g., S30-P = dummy coded condition predicting the random slope capturing change over time in the outcome for that section of the table); SD = standard deviation; CI = credibility interval.
indicates an estimate that was significant based on the p-value but not based on the Bayesian CI. All results are from the model with placebo as the referent group besides effects that compare 30mg to 200mg, which came from the re-run of the model for all pairwise comparisons.
Correlation between blood and breath alcohol concentration.
To demonstrate the accuracy of breath alcohol concentration measurements taken throughout the study, breath alcohol measurements taken one hour after the start of the alcohol administration period were correlated with alcohol concentration of blood drawn at the same time. This correlation was r =.82.
Blood-CBD.
Figure 4 shows a plot of the CBD levels in the blood at each blood timepoint (pre-CBD use, 25 minutes post-CBD, and again 60 minutes later [i.e., 60 minutes after the start of the alcohol administration period]) by condition. CBD rose from the first blood draw to the second, and from the second blood draw to the third. In addition, the highest levels of CBD were observed at the third blood timepoint. CBD blood-levels achieved at the second and third blood-draw timepoints were higher for the 200mg CBD condition (average peak CBD = 96.39 ng/ml) than the 30mg CBD condition (average peak CBD = 8.19 ng/ml). In the placebo condition, blood-CBD was maintained at zero across all three blood-draw timepoints.
Figure 4.
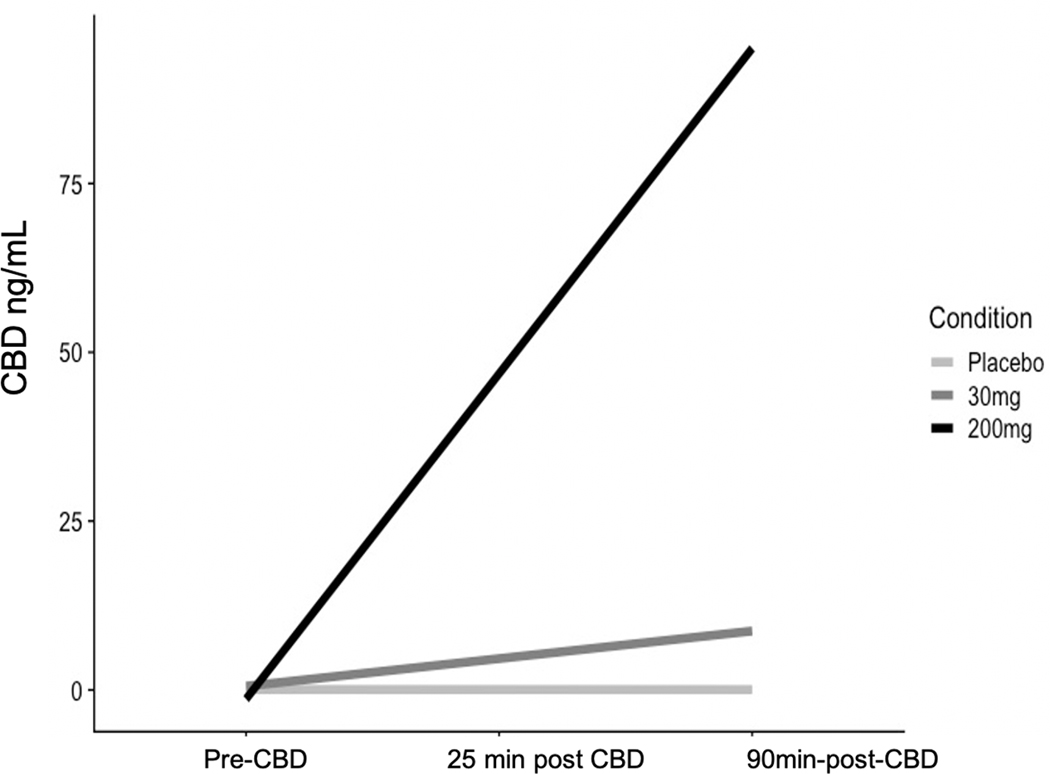
Changes in blood-levels of CBD (in ng/mL) over time.
Multilevel Structural Equation Models.
MSEM results are presented in Table 2. As models were run twice to gather all pairwise comparisons, only non-redundant information is presented. More specifically, we report all model parameter estimates from the model with placebo as the referent group and then only report paths that contain the 30mg CBD vs. 200mg CBD comparison from the re-run model. Full results for the re-run models are available upon request. In Table 2 parameters that were significant based on the Bayesian CIs were bolded. Note that in several instances, the p-value was significant and the Bayesian CI contained zero. In these cases, we note the significant p-value but interpret the effect as non-significant as the Bayesian CIs are more robust to the data characteristics than the associated p-values.
Change in BrAC and subjective effects of alcohol over time.
BrAC and high arousal positive affect significantly reduced from T2-T8 when data were collapsed across conditions. Estimated BrAC reduction on average across conditions was −.01 g/dL from one timepoint to the next3. Estimated high arousal positive affected reduction on average across conditions was 3.09 from one timepoint to the next (for reference the total scores on this measure can range from 14–140). All other outcomes did not demonstrate significant change during this time period. However, examination of the raw data and direction of the effects indicates that most outcomes did decrease over the experimental session.
Condition differences in change over time for all outcomes
There were significant differences among all conditions on changes in BrAC over time, such that placebo had the steepest negative slope, followed by 30mg CBD, and 200mg CBD had the flattest negative slope. This indicates that CBD slowed the reduction of BrAC from T2-T8. The magnitude of these condition differences was trivial, as the predicted change in average slopes between conditions from one timepoint to the next ranged from .007 to .008 g/dL. Similarly, there was a significant difference between 200mg CBD and placebo on changes in stimulation, with 200mg CBD being associated with a flatter negative slope, indicating that the 200mg dose was associated with slower reduction in stimulation during the descending limb of the BrAC curve than placebo. However the magnitude of differences between slopes was small (i.e., a 2.38-unit difference over 30 minutes on a scale with a possible range of 0–140), with overlapping in scores across groups (see raw data plot in Figure 2) and relatively wide Bayesian Credible Intervals (Table 2). The same pattern was seen for sedation, with a significant difference identified between the 30mg CBD and placebo conditions, suggesting that 30 mg CBD was associated with slower reduction in sedation during the descending limb of the BrAC curve. However, the magnitude of differences between slopes was small (i.e., 2.4-unit difference over 30 minutes on a scale with a possible range of 0–140), with overlapping scores across groups (see raw data plot in Figure 2), and relatively wide Bayesian Credible Intervals (Table 2). None of the other condition effects were significant, but many displayed similar patterns.
Sex differences in change over time and sex as a moderator of the condition by change slope
There were no significant sex differences in any outcomes and no significant moderating effects of sex. This indicates that the pattern of findings is similar across binary sex identities.
Discussion
Using a placebo-controlled, crossover design, this is the first human laboratory study in over 40 years to explore the effects of CBD on BrAC and the subjective and objective effects of alcohol. As shown in Figure 2, outcomes of interest generally followed expected descending patterns over the course of the descending limb of the BAC curve during experimental sessions (King et al. 2011; Rueger et al. 2015). This work leverages several improvements over prior designs, including testing multiple CBD doses and taking frequent (every 30 minutes) measurements of BrAC, craving, affect and subjective effects (Belgrave et al. 1979; Consroe et al. 1979; Bird et al. 1980). The goal of this study was to assess the effects of two doses of oral CBD (30mg and 200mg) compared to placebo CBD on BrAC, alcohol craving and subjective responses following a standard dose of alcohol.
Although MSEMs demonstrated significant condition differences in BrAC, sedation and stimulation, such that CBD was associated with a slower decline in BrAC and subjective effects during the descending limb of the BAC curve compared to placebo, further inspection of the magnitude of these differences indicate that they are likely too small to be of clinical significance (i.e., differences in the predicted change in average BrAC slopes between conditions from one timepoint to the next were .007-.008 g/dL; see Figure 2). We suspect it may be difficult for individuals to discern differences in their own BrAC on the scale of .007 to .008 g/dL over 30 minutes, which is further evidenced by the lack of clinically meaningful differences in subjective effects between conditions. For reference, a single, standard drink is expected to raise BAC by approximately .02-.04 g/dL and the average rate of elimination of alcohol from the body is around .018 g/dL per hour (although these numbers can vary substantially between and within individuals) (Posey and Mozayani 2007; Sadler and Parker 2014; Sadler and Lennox 2015). Thus, the condition differences we observed are very small in comparison to the effect of even a single drink on the body. It is also notable the margin of error for the breathalyzer devices we used is +/− .005, which further underscores the triviality of the observed BrAC differences between conditions. In addition, significant effects in the BrAC model had relatively wide Bayesian credible intervals, which suggests a lack of precision in the results. On the other hand, credible intervals for CBD condition effects on BrAC were all negative, supporting the association between CBD and a slower drop in BrAC after consuming alcohol. In sum, this preliminary investigation indicates that CBD may influence BrAC, but the small effects and lack of precision limit the extent to which these findings can be clinically informative.
MSEM models also indicated a statistically significant difference in slopes for stimulation, such that the 200mg CBD condition had a flatter negative slope during the descending limb than the placebo condition and 30mg CBD condition. This pattern suggests that CBD may prolong the stimulating effects of alcohol. However, the magnitude of these differences was small, as shown by the plots of the raw data in Figure 2. Further, Bayesian credible intervals were wide, suggesting a lack of precision in the results. A similar pattern was observed for sedation, and findings are similarly interpreted as lacking in clinical significance due to small magnitude of condition differences (see Figure 2) and wide Bayesian Credible Intervals.
The potential for CBD to serve as a treatment option for heavy-drinking individuals who wish to reduce their drinking is grounded in compelling rodent studies which have shown that CBD reduces alcohol intake, motivation for alcohol and reinstatement (Filev et al. 2017; Viudez-Martínez et al. 2018b, a; Gonzalez-Cuevas et al. 2018). For example, in one study among rats who were trained to self-administer oral ethanol, CBD treatment reduced ethanol seeking after just 1 day of treatment, as well as after repeated treatments over 7 days, and the effects of CBD (reduction of ethanol intake) persisted 138 days after the CBD treatment was stopped (Gonzalez-Cuevas et al. 2018). Whether CBD confers similar effects on alcohol intake in the laboratory in humans is unknown, and the mechanism through which CBD might influence alcohol consumption has not been investigated in humans. The three prior human studies on this topic are limited in that they do not explore alcohol consumption as a dependent variable, two of them have small sample sizes (N=10 (Consroe et al. 1979) and N=15 (Belgrave et al. 1979)) and results are conflicting regarding the impact of CBD on BrAC (Belgrave et al. 1979; Consroe et al. 1979; Bird et al. 1980). The present study is also a preliminary investigation into this topic, and was not designed to test alcohol consumption as a dependent variable. Our primary finding—that CBD is associated with only minimal effect on BrAC and subjective effects of alcohol—suggests that if CBD is eventually shown to be associated with reduced alcohol consumption in humans, more research is needed to determine potential mechanism(s) of action.
Finally, there is limited human data on potential sex differences in effects of CBD on the brain and body. In this sample, there were no main or moderating effects of sex on any of the outcomes tested. Conversely, one rodent study demonstrated that chronic CBD administration reduced ethanol consumption in male mice across 3 CBD doses (30, 60 and 90 mg/kg), but this reduction in drinking only occurred for female mice at the highest dose, suggesting that CBD may be less effective in reducing alcohol intake in females (Viudez-Martínez et al. 2019). It remains unknown whether sex differences in alcohol consumption following CBD ingestion may emerge in humans.
Limitations and Future Directions
Prior research has established that CBD has a favorable safety, profile, and confers low-risk of negative side effects (Taylor et al. 2018). Thus, CBD may be a safe option for individuals to use in combination with alcohol as a means of potentially reducing their alcohol intake. However, little is known about how CBD may influence the acute effects of alcohol in humans. This study was designed to be an initial, preliminary investigation into the effects of CBD and alcohol in the laboratory, and was therefore somewhat limited by the relatively small sample size. However, the number of repeated measurements and the crossover design in which participants completed each CBD or placebo condition increased power substantially. Still, is possible that our limited power impacted our ability to detect meaningful nuances in these data. Another limitation of note is that the present sample was recruited on the basis of self-reported heavy drinking, and participants were not clinically screened to determine whether they met criteria for AUD. However, the average AUDIT score in the present sample was 9.7 (see Table 1)—which is well above established cut-points for identifying at-risk drinking (Reinert and Allen 2007)—suggesting that at least some participants would likely meet criteria for AUD. It is also worth noting, however, that treatment-seeking individuals were excluded from the present study. Thus, it is unknown how CBD may interact with alcohol in a sample of treatment-seeking individuals who meet criteria for AUD. Future laboratory studies of alcohol and CBD co-administration in a more severe clinical sample are needed. It is also notable that 94% of the sample reported their race as White, which limits the generalizability of these results and underscores the need to replicate this study in a sample that is more representative of the population. Also, it should be noted the present analysis focused on the descending limb of the BAC curve, and analyses including or focusing on the ascending limb may produce different results.
Finally, like the three prior human laboratory studies on CBD and alcohol co-administration, we administered a standardized dose of alcohol to target a specific BrAC (.06 g/dL) based on participant body weight, rather than allowing participants to self-administer their desired amount of alcohol during each laboratory session. Thus, the present results cannot serve as a direct human replication of rodent findings (in which ethanol intake was the primary dependent variable of interest) and do not offer insight into whether CBD acutely decreases alcohol intake among humans in the laboratory. Future study designs should include alcohol self-administration (e.g., in a bar lab setting (Schacht et al. 2018)) as a primary outcome, in an effort to test the hypothesis that CBD (compared to placebo) may reduce the number of drinks individuals choose to self-administer in a given drinking session. Future studies could also include higher doses of alcohol and/or CBD, investigate the effects of CBD during both the ascending and descending limb of the BAC curve, include a more diverse and representative sample and explore potential moderation by individual difference variables such as personality facets and other indicators of psychological functioning and/or physical health. Future longitudinal studies are also needed to explore whether CBD impacts alcohol intake and desire to drink over time.
Conclusions
In this study, CBD conferred only minimal effects on BrAC and subjective effects of alcohol. CBD should be further explored for its potential to aid individuals who wish to reduce their drinking, but future studies should directly explore the effects of CBD on alcohol consumption, following compelling preclinical evidence that suggests that CBD may be associated with reducing alcohol intake. If CBD is shown to be associated with reduced drinking, further exploration is needed to understand potential mechanism(s) of action.
Supplementary Material
Funding.
This publication was supported by NIH/NCATS Colorado CTSA Grant Number UL1 TR002535 (Colorado Clinical and Translational Sciences Institute Co-Pilot Grant Funds awarded to HK). HK is also supported by K23AA028238. Contents are the authors’ sole responsibility and do not necessarily represent official NIH views.
Footnotes
Note that the breathalyzer used in this study, the Intoximeter Alco-Sensor IV, takes measurements in grams of alcohol per 210L of breath, as is typical for breathalyzer devices used in the U.S. For simplicity, we report units of BrAC measurements throughout the paper as g/dL, as this is how BAC is typically reported, and it is consistent with how BrAC is reported in prior alcohol administration studies using BrAC measurements to approximate BAC (e.g., Bujarski et al. 2017).
Note that in the “Reasons for Ineligibility” box within Figure 3, excluded individuals could have endorsed multiple reasons for ineligibility. For the purposes of reporting here, screened individuals were counted only once. If an individual did not meet cannabis use criteria, then “Did not meet cannabis use criteria” was listed as their reason for ineligibility, though it is possible that they also could have been excluded based on not meeting other criteria. If they met cannabis use criteria but did not meet alcohol use criteria, then “Did not meet alcohol use criteria” was listed as their reason for ineligibility, though it is possible that they also could have been excluded on the basis of additional ineligibility reasons listed below. The same rule applies to each successive reason for ineligibility listed in Figure 3.
Note that BrAC models were run using BrAC*100 to aid in model convergence, but interpretations provided in text are transformed back to the typical scale, (i.e., model estimates were divided by 100).
Declaration of interests: none to declare
Conflict of interest statement: On behalf of all authors, the corresponding author states that there is no conflict of interest.
References
- Beck AT, Steer RA (1990) Manual for the Beck anxiety inventory [Google Scholar]
- Beck AT, Steer RA, Carbin MG (1988) Psychometric properties of the Beck Depression Inventory: Twenty-five years of evaluation. Clin Psychol Rev 8:77–100. 10.1016/0272-7358(88)90050-5 [DOI] [Google Scholar]
- Belgrave BE, Bird KD, Chesher GB, et al. (1979) The effect of cannabidiol, alone and in combination with ethanol, on human performance. Psychopharmacology (Berl) 64:243–6 [DOI] [PubMed] [Google Scholar]
- Bird KD, Boleyn T, Chesher GB, et al. (1980) Intercannabinoid and cannabinoid-ethanol interactions and their effects on human performance. Psychopharmacology (Berl) 71:181–188. 10.1007/BF00434409 [DOI] [PubMed] [Google Scholar]
- Bohn MJ, Krahn DD, Staehler BA (1995) Development and initial validation of a measure of drinking urges in abstinent alcoholics. Alcohol Clin Exp Res 19:600–606 [DOI] [PubMed] [Google Scholar]
- Brents LK (2016) Marijuana, the endocannabinoid system and the female reproductive system. Yale Journal of Biology and Medicine 89:175–191 [PMC free article] [PubMed] [Google Scholar]
- Brick J (2006) Standardization of alcohol calculations in research. Alcohol Clin Exp Res 30:1276–1287 [DOI] [PubMed] [Google Scholar]
- Brumback T, Cao D, King A (2007) Effects of alcohol on psychomotor performance and perceived impairment in heavy binge social drinkers. Drug Alcohol Depend 91:10–17. 10.1016/J.DRUGALCDEP.2007.04.013 [DOI] [PMC free article] [PubMed] [Google Scholar]
- Bujarski S, Hutchison KE, Prause N, Ray LA (2017) Functional significance of subjective response to alcohol across levels of alcohol exposure. Addiction biology 22:235–245 [DOI] [PubMed] [Google Scholar]
- Consroe P, Carlini EA, Zwicker AP, Lacerda LA (1979) Interaction of cannabidiol and alcohol in humans. Psychopharmacology (Berl) 66:45–50. 10.1007/BF00431988 [DOI] [PubMed] [Google Scholar]
- Craft RM, Marusich JA, Wiley JL (2013) Sex differences in cannabinoid pharmacology: A reflection of differences in the endocannabinoid system? In: Life Sciences. pp 476–481 [DOI] [PMC free article] [PubMed] [Google Scholar]
- Dougherty DM, Marsh-Richard DM, Hatzis ES, et al. (2008) A test of alcohol dose effects on multiple behavioral measures of impulsivity. Drug Alcohol Depend 96:111–120. 10.1016/J.DRUGALCDEP.2008.02.002 [DOI] [PMC free article] [PubMed] [Google Scholar]
- Dutra L, Stathopoulou G, Basden SL, et al. (2008) A Meta-Analytic Review of Psychosocial Interventions for Substance Use Disorders. American Journal of Psychiatry 165:179–187. 10.1176/appi.ajp.2007.06111851 [DOI] [PubMed] [Google Scholar]
- Earleywine M, Erblich J (1996) A confirmed factor structure for the Biphasic Alcohol Effects Scale. Exp Clin Psychopharmacol 4:107 [Google Scholar]
- Filev R, Engelke DS, Da Silveira DX, et al. (2017) THC inhibits the expression of ethanol-induced locomotor sensitization in mice. Alcohol 65:31–35. 10.1016/j.alcohol.2017.06.004 [DOI] [PubMed] [Google Scholar]
- Francés F, Portolés O, Castelló A, et al. (2015) Association between opioid receptor mu 1 (OPRM1) gene polymorphisms and tobacco and alcohol consumption in a Spanish population. Bosn J Basic Med Sci 15:31. [DOI] [PMC free article] [PubMed] [Google Scholar]
- Gelman A, Carlin JB, Stern HS, Rubin DB (2004) Bayesian Data Analysis Chapman & Hall. CRC Texts in Statistical Science [Google Scholar]
- Gonzalez-Cuevas G, Martin-Fardon R, Kerr TM, et al. (2018) Unique treatment potential of cannabidiol for the prevention of relapse to drug use: preclinical proof of principle. Neuropsychopharmacology 43:2036–2045. 10.1038/s41386-018-0050-8 [DOI] [PMC free article] [PubMed] [Google Scholar]
- Grant BF, Chou SP, Saha TD, et al. (2017) Prevalence of 12-Month Alcohol Use, High-Risk Drinking, and DSM-IV Alcohol Use Disorder in the United States, 2001–2002 to 2012–2013. JAMA Psychiatry 74:911. 10.1001/jamapsychiatry.2017.2161 [DOI] [PMC free article] [PubMed] [Google Scholar]
- Hendler RA, Ramchandani VA, Gilman J, Hommer DW (2011) Stimulant and sedative effects of alcohol. Behavioral neurobiology of alcohol addiction 489–509 [DOI] [PubMed] [Google Scholar]
- HINDMARCH I, KERR JS, SHERWOOD N (1991) THE EFFECTS OF ALCOHOL AND OTHER DRUGS ON PSYCHOMOTOR PERFORMANCE AND COGNITIVE FUNCTION. Alcohol and Alcoholism 26:71–79. 10.1093/oxfordjournals.alcalc.a045085 [DOI] [PubMed] [Google Scholar]
- Holdstock L, de Wit H (1998) Individual differences in the biphasic effects of ethanol. Alcohol Clin Exp Res 22:1903–1911 [PubMed] [Google Scholar]
- Jonas DE, Amick HR, Feltner C, et al. (2014) Pharmacotherapy for Adults With Alcohol Use Disorders in Outpatient Settings. JAMA 311:1889. 10.1001/jama.2014.3628 [DOI] [PubMed] [Google Scholar]
- Karoly HC, Mueller RL, Bidwell LC, Hutchison KE (2020) Cannabinoids and the Microbiota–Gut–Brain Axis: Emerging Effects of Cannabidiol and Potential Applications to Alcohol Use Disorders. Alcohol Clin Exp Res [DOI] [PubMed] [Google Scholar]
- King AC, De Wit H, McNamara PJ, Cao D (2011) Rewarding, stimulant, and sedative alcohol responses and relationship to future binge drinking. Arch Gen Psychiatry 68:389–399 [DOI] [PMC free article] [PubMed] [Google Scholar]
- Klawitter J, Sempio C, Mörlein S, et al. (2017) An Atmospheric Pressure Chemical Ionization MS/MS Assay Using Online Extraction for the Analysis of 11 Cannabinoids and Metabolites in Human Plasma and Urine. Ther Drug Monit 39:556–564. 10.1097/FTD.0000000000000427 [DOI] [PMC free article] [PubMed] [Google Scholar]
- Lappan SN, Brown AW, Hendricks PS (2020) Dropout rates of in‐person psychosocial substance use disorder treatments: a systematic review and meta‐analysis. Addiction 115:201–217 [DOI] [PubMed] [Google Scholar]
- Mague SD, Blendy JA (2010) OPRM1 SNP (A118G): involvement in disease development, treatment response, and animal models. Drug Alcohol Depend 108:172–182 [DOI] [PMC free article] [PubMed] [Google Scholar]
- Martin CS, Earleywine M, Musty RE, et al. (1993) Development and validation of the Biphasic Alcohol Effects Scale. Alcohol Clin Exp Res 17:140–146 [DOI] [PubMed] [Google Scholar]
- Mehta PD, Neale MC (2005) People are variables too: Multilevel structural equations modeling. Psychol Methods 10:259. [DOI] [PubMed] [Google Scholar]
- Morean ME, Corbin WR, Treat TA (2013) The Subjective Effects of Alcohol Scale: Development and psychometric evaluation of a novel assessment tool for measuring subjective response to alcohol. Psychol Assess 25:780. [DOI] [PMC free article] [PubMed] [Google Scholar]
- Musella A, Fresegna D, Rizzo FR, et al. (2017) A novel crosstalk within the endocannabinoid system controls GABA transmission in the striatum. Sci Rep 7:7363. 10.1038/s41598-017-07519-8 [DOI] [PMC free article] [PubMed] [Google Scholar]
- Muthén B, Asparouhov T (2012) Bayesian structural equation modeling: a more flexible representation of substantive theory. Psychol Methods 17:313. [DOI] [PubMed] [Google Scholar]
- Muthén LK, Muthen B (2017) Mplus user’s guide: Statistical analysis with latent variables, user’s guide. Muthén & Muthén [Google Scholar]
- Nona CN, Hendershot CS, Le Foll B (2019) Effects of cannabidiol on alcohol-related outcomes: A review of preclinical and human research. Exp Clin Psychopharmacol. 10.1037/pha0000272 [DOI] [PubMed] [Google Scholar]
- Parsons LH, Hurd YL (2015) Endocannabinoid signalling in reward and addiction. Nat Rev Neurosci 16:579–594. 10.1038/nrn4004 [DOI] [PMC free article] [PubMed] [Google Scholar]
- Pihl RO, Paylan SS, Gentes‐Hawn A, Hoaken PNS (2003) Alcohol affects executive cognitive functioning differentially on the ascending versus descending limb of the blood alcohol concentration curve. Alcohol Clin Exp Res 27:773–779 [DOI] [PubMed] [Google Scholar]
- Posey D, Mozayani A (2007) The estimation of blood alcohol concentration. Forensic Sci Med Pathol 3:33–39 [DOI] [PubMed] [Google Scholar]
- Preacher KJ, Zhang Z, Zyphur MJ (2016) Multilevel structural equation models for assessing moderation within and across levels of analysis. Psychol Methods 21:189–205. 10.1037/met0000052 [DOI] [PubMed] [Google Scholar]
- Preacher KJ, Zyphur MJ, Zhang Z (2010) A general multilevel SEM framework for assessing multilevel mediation. Psychol Methods 15:209–233. 10.1037/a0020141 [DOI] [PubMed] [Google Scholar]
- Ramaekers JG, Theunissen EL, de Brouwer M, et al. (2011) Tolerance and cross-tolerance to neurocognitive effects of THC and alcohol in heavy cannabis users. Psychopharmacology (Berl) 214:391–401. 10.1007/s00213-010-2042-1 [DOI] [PMC free article] [PubMed] [Google Scholar]
- Ray LA, Hutchison KE (2007) Effects of naltrexone on alcohol sensitivity and genetic moderators of medication response: a double-blind placebo-controlled study. Arch Gen Psychiatry 64:1069–1077 [DOI] [PubMed] [Google Scholar]
- Ray LA, Hutchison KE, MacKillop J, et al. (2008) Effects of naltrexone during the descending limb of the blood alcohol curve. American Journal on Addictions 17:257–264 [DOI] [PubMed] [Google Scholar]
- Reinert DF, Allen JP (2007) The alcohol use disorders identification test: an update of research findings. Alcohol Clin Exp Res 31:185–199 [DOI] [PubMed] [Google Scholar]
- Rueger SY, Hu H, McNamara P, et al. (2015) Differences in subjective response to alcohol in heavy‐and light‐drinking C hinese men versus C aucasian A merican men. Addiction 110:91–99 [DOI] [PMC free article] [PubMed] [Google Scholar]
- Sadler DW, Lennox S (2015) Intra-individual and inter-individual variation in breath alcohol pharmacokinetics: Variation over three visits. J Forensic Leg Med 34:88–98 [DOI] [PubMed] [Google Scholar]
- Sadler DW, Parker J (2014) Intra-individual and inter-individual variation in breath alcohol pharmacokinetics: the effect of short-term variation. J Forensic Leg Med 25:77–84 [DOI] [PubMed] [Google Scholar]
- Saunders JB, Aasland OG, Babor TF, et al. (1993) Development of the alcohol use disorders identification test (AUDIT): WHO collaborative project on early detection of persons with harmful alcohol consumption‐II. Addiction 88:791–804 [DOI] [PubMed] [Google Scholar]
- Schacht JP, Voronin KE, Randall PK, Anton RF (2018) Dopaminergic genetic variation influences aripiprazole effects on alcohol self-administration and the neural response to alcohol cues in a randomized trial. Neuropsychopharmacology 43:1247–1256 [DOI] [PMC free article] [PubMed] [Google Scholar]
- Schlienz NJ, Budney AJ, Lee DC, Vandrey R (2017) Cannabis Withdrawal: a Review of Neurobiological Mechanisms and Sex Differences. Curr Addict Rep 4:75–81. 10.1007/s40429-017-0143-1 [DOI] [PMC free article] [PubMed] [Google Scholar]
- Sloan ME, Gowin JL, Ramchandani VA, Le Foll B (2017) The endocannabinoid system as a target for addiction treatment: Trials and tribulations. Neuropharmacology 124:73–83. 10.1016/J.NEUROPHARM.2017.05.031 [DOI] [PubMed] [Google Scholar]
- Taylor L, Gidal B, Blakey G, et al. (2018) A Phase I, Randomized, Double-Blind, Placebo-Controlled, Single Ascending Dose, Multiple Dose, and Food Effect Trial of the Safety, Tolerability and Pharmacokinetics of Highly Purified Cannabidiol in Healthy Subjects. CNS Drugs 32:1053–1067. 10.1007/s40263-018-0578-5 [DOI] [PMC free article] [PubMed] [Google Scholar]
- Team RC (2013) R: A language and environment for statistical computing. R Foundation for Statistical Computing, [Google Scholar]
- Turna J, Syan SK, Frey BN, et al. (2019) Cannabidiol as a Novel Candidate Alcohol Use Disorder Pharmacotherapy: A Systematic Review. Alcohol Clin Exp Res. 10.1111/acer.13964 [DOI] [PMC free article] [PubMed] [Google Scholar]
- Viudez-Martínez A, García-Gutiérrez MS, Fraguas-Sánchez AI, et al. (2018a) Effects of cannabidiol plus naltrexone on motivation and ethanol consumption. Br J Pharmacol 175:3369–3378. 10.1111/bph.14380 [DOI] [PMC free article] [PubMed] [Google Scholar]
- Viudez‐Martínez A, García‐Gutiérrez MS, Fraguas‐Sánchez AI, et al. (2018) Effects of cannabidiol plus naltrexone on motivation and ethanol consumption. Br J Pharmacol 175:3369–3378 [DOI] [PMC free article] [PubMed] [Google Scholar]
- Viudez-Martínez A, García-Gutiérrez MS, Manzanares J (2019) Gender differences in the effects of cannabidiol on ethanol binge drinking in mice. Addiction Biology e12765. 10.1111/adb.12765 [DOI] [PubMed] [Google Scholar]
- Viudez-Martínez A, García-Gutiérrez MS, Navarrón CM, et al. (2018b) Cannabidiol reduces ethanol consumption, motivation and relapse in mice. Addiction Biology 23:154–164. 10.1111/adb.12495 [DOI] [PubMed] [Google Scholar]
- Wakley AA, Wiley JL, Craft RM (2014) Sex differences in antinociceptive tolerance to delta-9-tetrahydrocannabinol in the rat. Drug Alcohol Depend 143:22–28. 10.1016/j.drugalcdep.2014.07.029 [DOI] [PMC free article] [PubMed] [Google Scholar]
- Wickham H (2016) ggplot2: elegant graphics for data analysis Springer-Verlag; New York; 2009 [Google Scholar]
- Wickham H, Averick M, Bryan J, et al. (2019) Welcome to the Tidyverse. J Open Source Softw 4:1686 [Google Scholar]
- Wiley JL (2003) Sex-dependent effects of Δ9-tetrahydrocannabinol on locomotor activity in mice. Neurosci Lett 352:77–80. 10.1016/j.neulet.2003.08.050 [DOI] [PubMed] [Google Scholar]
- Williams NNB, Ewell TR, Abbotts KSS, et al. (2021) Comparison of Five Oral Cannabidiol Preparations in Adult Humans: Pharmacokinetics, Body Composition, and Heart Rate Variability. Pharmaceuticals 14:35. [DOI] [PMC free article] [PubMed] [Google Scholar]
Associated Data
This section collects any data citations, data availability statements, or supplementary materials included in this article.